INTRODUCTION
Assessment of the catch characteristics and population patterns of target species can be undertaken using a number of different approaches. These approaches include the use of scientific observations, fishermen's logbooks (Hilborn & Walters, Reference Hilborn and Walters1992; Woll et al., Reference Woll, van der Meeren and Fossen2006; King, Reference King2007) and questionnaire surveys (Berkes et al., Reference Berkes, Colding and Folke2000; Bergmann et al., Reference Bergmann, Hinz, Blyth, Kaiser, Rogers and Armstrong2004; McLeod & Leslie, Reference McLeod and Leslie2009) all of which can provide information to underpin the sustainable use of stocks and conservation of their habitats. Despite the variety of data gathering techniques that can be deployed they are rarely evaluated together, e.g. geo-referenced catch and effort data from commercial logbooks and the effort data from experimental fishery surveys (Vigneaux et al., Reference Vigneaux, Vigneaux, Lizamore and Gresham1998; Jennings et al., Reference Jennings, Alvsvag, Cotter, Ehrich, Greenstreet, Jarre-Teichmann, Mergardt, Rijnsdorp and Smedstad1999; Petitgas et al., Reference Petitgas, Poulard and Biseau2003). In the present study, a range of different approaches are implemented to provide a full understanding of catch per unit effort (CPUE), population structure, sex ratio and size distribution of an economically important brown crab fishery.
Brown crab, Cancer pagurus Linnaeus, 1758, is distributed in the NE Atlantic, and occurs from Norway to the north coast of Africa and the Mediterranean Sea (Ungfors, Reference Ungfors2008; FAO, 2014). Cancer pagurus can live for up to 15 years and reach a maximum size of ~270 mm carapace width (CW) in males and ~250 mm CW in females (Brown & Bennett, Reference Brown and Bennett1980; Mill et al., Reference Mill, Dobby, McLay and Mesquita2009). The life cycle consists of a short pelagic stage and a long benthic stage (Woll & Alesund, Reference Woll and Alesund2006). Male and female crabs appear to undertake migrations that are linked to mating and the development and release of larvae by female crabs (Edwards, Reference Edwards1979; Bennett & Brown, Reference Bennett and Brown1983; Hunter et al., Reference Hunter, Eaton, Stewart, Lawler and Smith2013). Brown crab is caught by pots (baited traps) in NW European waters. Brown crab is commercially fished in 13 countries with total landings of 47,640 tonnes in 2012, with the largest catches from the UK (27,273 t), Ireland (6269 t) and France (6141 t) (FAO, 2014). The landings of brown crab have increased markedly in the UK during the last 40 years (FAO, 2014). Despite the recent increases in fishing intensity and efficiency, the quantification of potting effort and stock assessment of brown crab have been poorly documented to date (ICES, 2005; Bannister, Reference Bannister2009, Reference Bannister2011).
As for many rural areas in the UK, brown crab is an important contributor to the Isle of Man fishing economy with landings in 2012 of around 495 t worth in excess of £0.5 million (FAO, 2014). The commercial potting vessels range from 4 to 12 m in length and are registered with a UK potting licence. The pot fishing occurs all around the island within 3 nm of the coast (with the possible exception of the NE coast), and out to the territorial sea boundary (12 nm) off the central-west and south-west coasts. Fishers use traditional inkwell pots as well as more modern steel framed parlour pots of a variety of different sizes. Several fish species (mainly the Atlantic herring Clupea harengus Linnaeus, 1758, the Atlantic mackerel Scomber scombrus Linnaeus, 1758, small spotted catshark Scyliorhinus canicula (Linnaeus, 1758), and grey gurnard Eutrigla gurnardus (Linnaeus, 1758)) are used as bait in pots. Soak time, the length of time the pot is in the water, ranges between 1 and 12 days, depending on fishermen's practices and weather conditions, although 1–2 days is most typical. There are a number of regulations that promote conservation of brown crab populations in the Isle of Man. Fisheries legislation requires escape gaps (80 mm wide × 45 mm high) to be fitted to allow undersized crabs and lobsters to escape. The minimum landing size (MLS) for brown crab is 130 mm carapace width and the landing of berried crab and landing of claws (i.e. de-clawing) is prohibited. Commercial fishermen record their catches in logbooks.
Catch per unit effort (CPUE) is generally used as an index of relative abundance in fisheries stock assessment (Bell et al., Reference Bell, Addison and Bannister2001; Su et al., Reference Su, Yeh, Sun, Punt, Chen and Wang2008). However, catchability of crustaceans can vary with environmental and fishery-specific factors such as water temperature and wind stress (Drinkwater et al., Reference Drinkwater, Tremblay and Comeau2006), habitat structure (Addison & Lovewell, Reference Addison and Lovewell1991), location of fishing areas (Woll et al., Reference Woll, van der Meeren and Fossen2006), season (Brown & Bennett, Reference Brown and Bennett1980; Hart, Reference Hart, Pitcher, Hart and Pauly1998), depth (Linnane et al., Reference Linnane, McGarvey, Hoare and Hawthorne2013), gear type (Addison & Lovewell, Reference Addison and Lovewell1991), position of trap in the string (Bell et al., Reference Bell, Addison and Bannister2001), escape gaps (Brown, Reference Brown1982), bait (Chapman & Smith, Reference Chapman and Smith1979) and soak time (Bennett, Reference Bennett1974; Fogarty & Addison, Reference Fogarty and Addison1997). Hence, in order to reduce the effects of these factors, CPUE data are commonly standardized using various methods such as generalized linear models (GLMs), generalized additive models (GAMs) and generalized linear mixed models (GLMMs) (McDonald et al., Reference McDonald, Kendrick and Breen2001; Maunder & Punt, Reference Maunder and Punt2004; Ye & Dennis, Reference Ye and Dennis2009). Nevertheless, despite the standardization of catch and effort data, there is still no guarantee that the resultant index of abundance is linearly proportional to abundance (Maunder & Punt, Reference Maunder and Punt2004). Information on catch and effort can be collected either from fishermen's logbooks or catch returns (fishery dependent data – FDD) or from direct scientific observations (observer data). Logbook data are relatively inexpensive to collect and provide more comprehensive information in terms of space and time coverage than experimental fishing data (Ye & Dennis, Reference Ye and Dennis2009). In contrast, observer data provide more reliable estimates of CPUE that are precisely geo-referenced and can provide useful information on additional bio-ecological characteristics (e.g. distribution and abundance of young individuals), but usually at higher uncertainty due to low sample size (Verdoit et al., Reference Verdoit, Pelletier and Bellail2003). The use of fishers’ knowledge also can contribute to a better understanding of spatio-temporal trends in the abundance of the target species and historical patterns in ecosystem parameters that may influence the target species (Whiteley, Reference Whiteley2009). The comparison of logbook data, observer data and fisher's knowledge is rare (Fox & Starr, Reference Fox and Starr1996; Potier et al., Reference Potier, Petitgas and Petit1997; Petitgas et al., Reference Petitgas, Poulard and Biseau2003).
The first aim of this study was to determine the population characteristics of brown crab in the waters surrounding the Isle of Man (Irish Sea) using observer data that related to the spatial and temporal variations in the size distributions and sex ratio of brown crab. The observer data (2012–2013) was related to logbook data for the period 2007–2012 to examine the spatial and temporal variations in CPUE. The effects of environmental and fishery-specific factors (e.g. depth and soak time) on CPUE were also examined.
MATERIALS AND METHODS
Study area and observer data (experimental fishing)
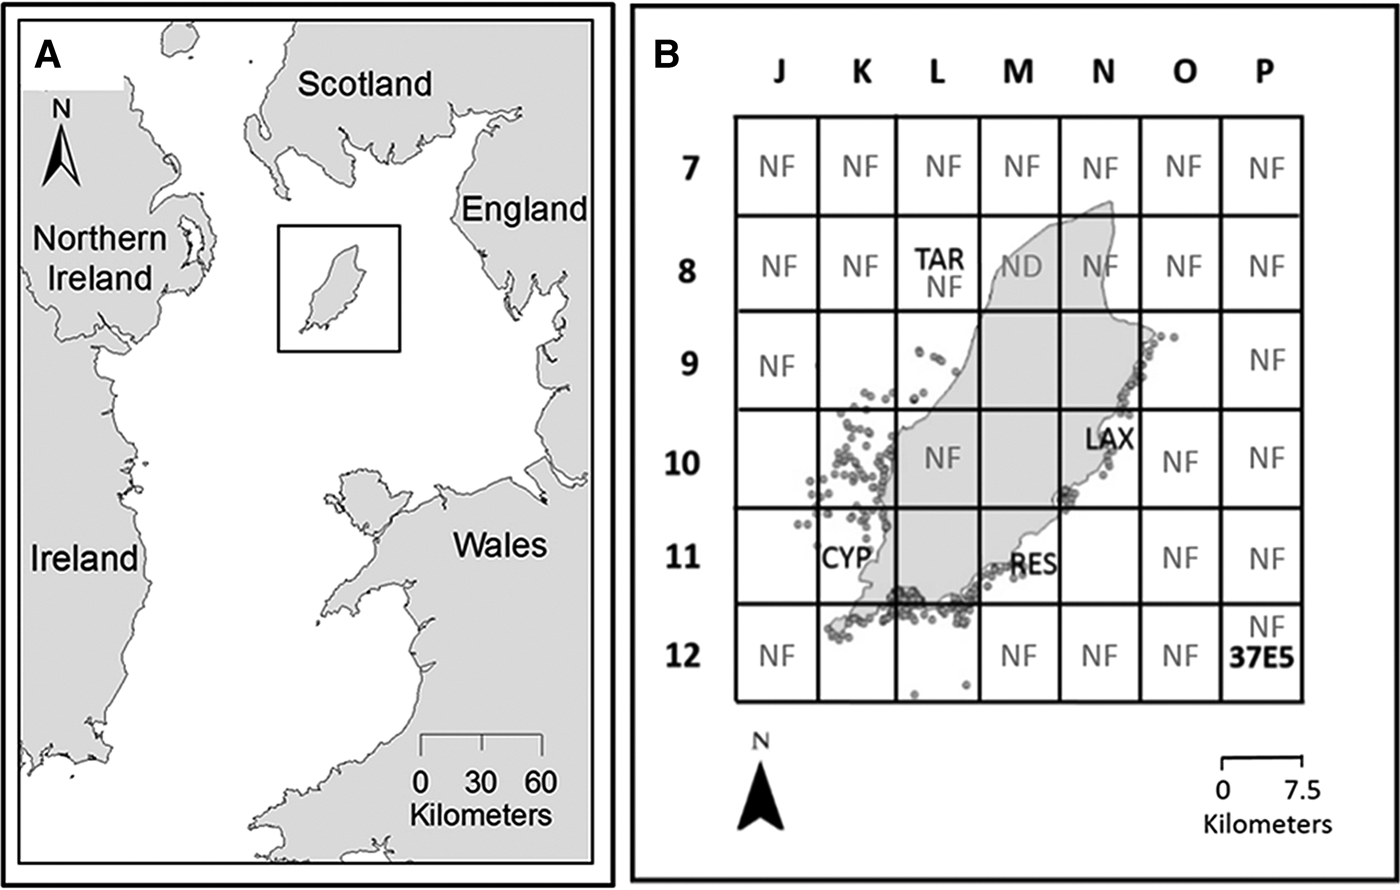
The Isle of Man is situated in the northern Irish Sea, NE Atlantic (Figure 1A). The waters within the Isle of Man's 12 mile territorial limits are shallow, in particular to the east of the island, where they are mostly less than 30 m deep (Craven et al., Reference Craven, Brand and Stewart2012). Nearshore sediments are predominantly fine sand, whilst offshore sediments can be mainly categorized in four classes: coarse sands and gravel, fine sand, muddy sand and mud (Barne et al., Reference Barne, Robson, Kaznowska, Doody and Davidson1996; Craven et al., Reference Craven, Brand and Stewart2012).
(A) location of the Isle of Man in Northern Irish Sea (ICES subdivision VII A); (B) study area subdivided into 42 areas of ~75 km2. The grid shows the alpha-numeric coordinates for ICES statistical rectangle 37E5. The grey data points show the sample locations for the period between spring 2012 and summer 2013. The string numbers (sample size) (N) of each grid are J10 = 2, J11 = 2, K10 = 38, K11 = 23, K12 = 31, K9 = 4, L11 = 33, L12 = 46, L9 = 13, M10 = 8, M11 = 12, N10 = 12, N11 = 1, N9 = 14, O9 = 5. The environmental data stations (Targets (Tar), Cypris (Cyp), Resa (Res) and Laxey (Lax)) are also shown. The abbreviations are: No fishing (NF), crab fishing occurs there but no data (ND).

On-board observations related to the evaluation of the crab population were made by the same person (F.Ö.) around the Isle of Man during six seasonal experimental pot surveys from spring 2012 to summer 2013. Sampling was undertaken from eight commercial fishing boats that operated in different locations spaced out around the Isle of Man. In some seasons the sampling area was reduced because of limited fishing activity and the restrictions imposed by weather conditions. Fishermen do not fish in the north of the Isle of Man; hence no sampling was undertaken in these areas. To provide spatial and temporal comparisons of catch ratio, data were standardized to reporting areas of ~75 km2, which subdivide the 37E5 (ICES) rectangle (Figure 1B). A day's fishing on a crab boat generally started at ~7.00 and finished at 16.00. Commercial fishing pots fitted with escape gaps were fished at depths ranging between 2 and 65 m. The location of each haul was recorded using a GPS system. Environmental factors such as depth as well as fishery-specific factors including the number of pots fished, the number of fleets of pots hauled and soak time were recorded. Pot number in strings varied from 1 to 50. A total of 244 strings were sampled (Figure 1B). Soak time varied from 24 to 288 h. Pot volume was variable among fishers (0.11, 0.12, 0.14, 0.17 and 0.20 m3) hence the effect of this on CPUE was examined using sub-samples. The effect of bait types (small spotted catshark, the Atlantic cod Gadus morhua Linnaeus, 1758, grey gurnard, haddock Melanogrammus aeglefinus (Linnaeus, 1758), Atlantic herring, Atlantic mackerel and European pollack Pollachius pollachius (Linnaeus, 1758)) on CPUE was compared. Information related to crab catch composition (sex, carapace width, body weight, moult stage (soft or hard) and egg bearing) was recorded at sea.
Logbook data
Logbooks are completed by licensed fishers during each day of fishing activity. Fishermen are required to report the fishing dates, fishing ports, number of hauled pots and the total live weight of crabs landed. In contrast to observer data, logbook data do not include the information about the proportion of the catch under the MLS. Landings returns were used to calculate LPUE of brown crab in the period 2007–2012. Spatial analyses of these data were only possible for 2007 when the industry used the grid square reporting scheme (Figure 1B), thereafter, landings were reported in relation to the vessel's home port only. The catching capacity of vessels in the Isle of Man was determined from the relationship between boat size and the number of hauled pots.
Questionnaire study
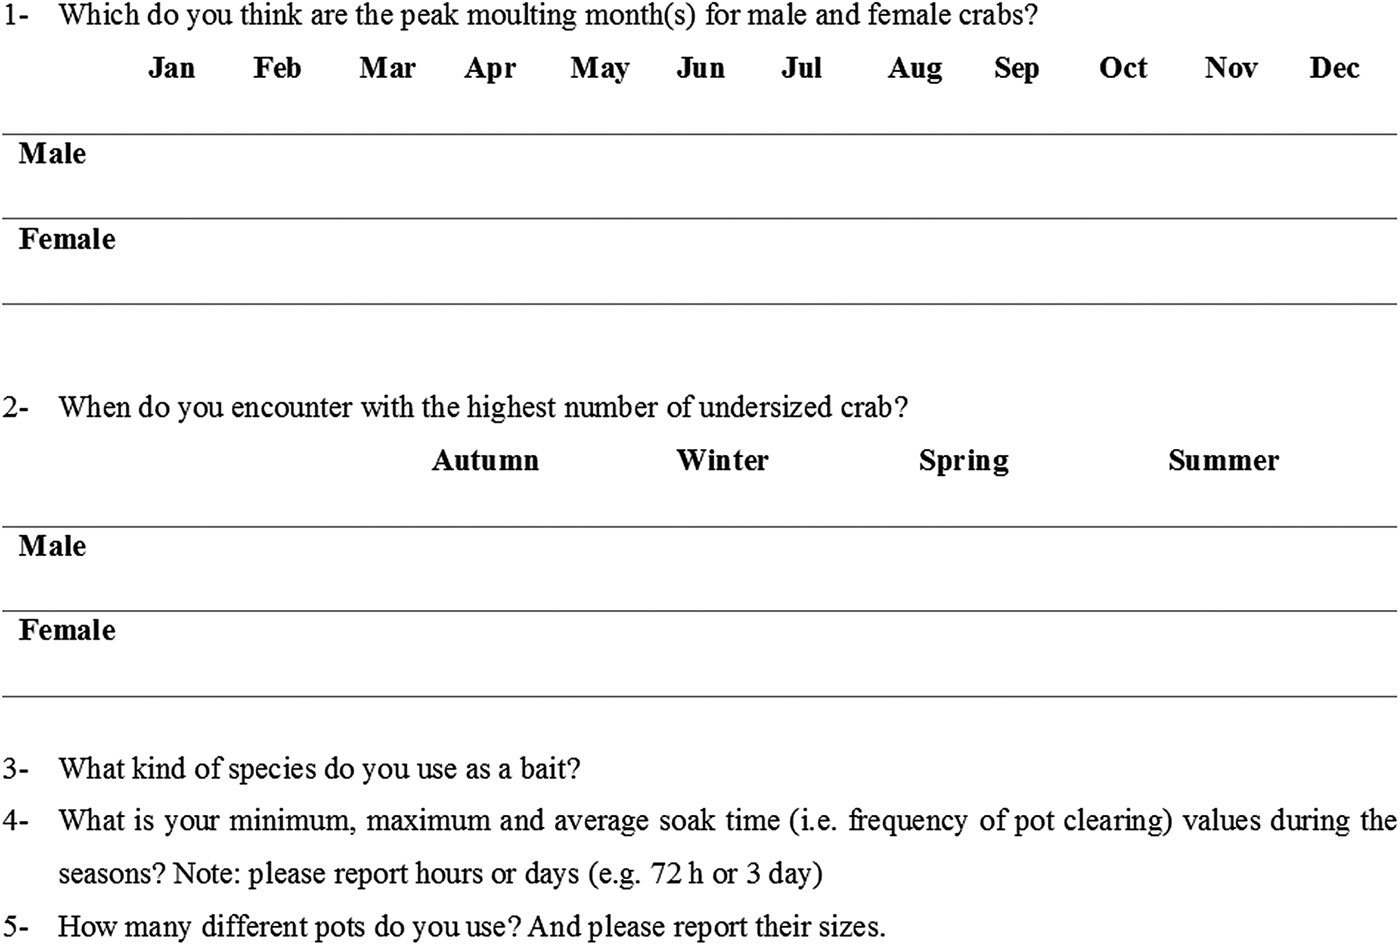
Additional information was collected using face to face interviews based on a semi-structured questionnaire in July 2013 (Figure 2). Interviewees were owners of fishing vessels that actively fish for brown crab. A total of 10 interviews were conducted (represents 40% of total fishermen population). The questions were designed to capture information about the ecology of the brown crab (e.g. patterns in moulting, and discards) and basic information of the fishery-specific factors (soak time and bait type) which were considered relevant in consideration of factors that influence CPUE.
Questionnaire format used in face to face interviews.

Environmental data
In addition to the crab fisheries survey data, monthly time series of marine quality data (bottom water temperature and dissolved oxygen) for the period 2007–2013 at four sites (Targets, Cypris, Resa and Laxey) around the Isle of Man (Figure 1B) obtained from the Isle of Man Government Laboratory.
Data analyses and CPUE modelling
Statistical analyses were performed with the SPSS software (Version 20), Stata software (Version 13) and R (R Core Team, 2016). Spatial data were evaluated using ArcGIS (Version 10.1). Linear regression was used to test the relationship between carapace width (CW) and depth to understand whether depth was related to the size of crabs caught. Spatial (statistical square) and temporal variations (monthly or seasonal) in CW with sex as a covariate were examined using a general linear model (GLM).
To investigate the factors determining CPUE, observer data were assessed using generalized additive models (GAMs) in R. Modelling was conducted with the package ‘mgcv’ (Wood & Augustin, Reference Wood and Augustin2002; Wood, Reference Wood2006) and began with the most complex model (1):
 $$\eqalign{{\rm CPU}{\rm E}_{{\rm Obs}}\; & \sim {\rm Area + Season}\left( {{\rm Year}} \right) + s\left( {{\rm Depth}} \right) \cr & \qquad + s\left( {{\rm Soak\; time}} \right)}$$
CPUEObs is the Catch per unit effort calculated by applying the following equation to observer data, where ‘all C’ is the total number of crabs caught in a string, including undersized, soft and berried crabs, and ‘thp’ is the total number of pots hauled per string. The number of pots in a string varied such that it was necessary to standardize the data by reducing the data to catch per pot per string.
 $${\rm Observed\; CPUE} = \displaystyle{{{\rm all\; C\; (number)}} \over {thp}}$$
Season(Year) is a factor variable describing the season in which the observation was made in a specific year, for example Spring 2013. Depth was recorded on-board the commercial vessel using the depth-sounder and soak-time was noted in hours (h). Models were fitted using a gamma error distribution and a log link function was applied. Modelling employed a backward selection, reducing the complexity of the model by comparing AIC values (a model with an AIC value two points lower than a comparable model was preferred). Finally ‘s’ denotes where isotropic ‘smooths’ were applied to the factor within the GAM. Finally, a separate approach was used to investigate the relationship between pot volume (m3) and CPUE as well as the influence of bait species on CPUE, with the former analysed using linear regression analysis.
Concerning logbook data (2007–2012), ANOVA was used to test the relationship between landings per unit effort (LPUE) and sampling season. For the logbook data (2007), the relationship between LPUE and sampling area was tested using ANOVA. The sampling area was pooled because fishermen recorded several areas at the same day on their logbooks. Spearman's rank correlation was used in order to test the relationship between LPUE and monthly mean bottom water temperature. LPUE is calculated using the equation:
Logbook data
 $${\rm LPUE} = \displaystyle{{LC\; (kg)} \over {thp}}$$
Where LC (legal catch) is the crab catch kg; thp the total hauled pot per trip.
To understand the relationship between catching capacity and vessel size, the relationship between mean number of pots hauled per trip of boats and deck area (length × breadth) was examined using a Spearman's rank correlation.
RESULTS
Environmental data
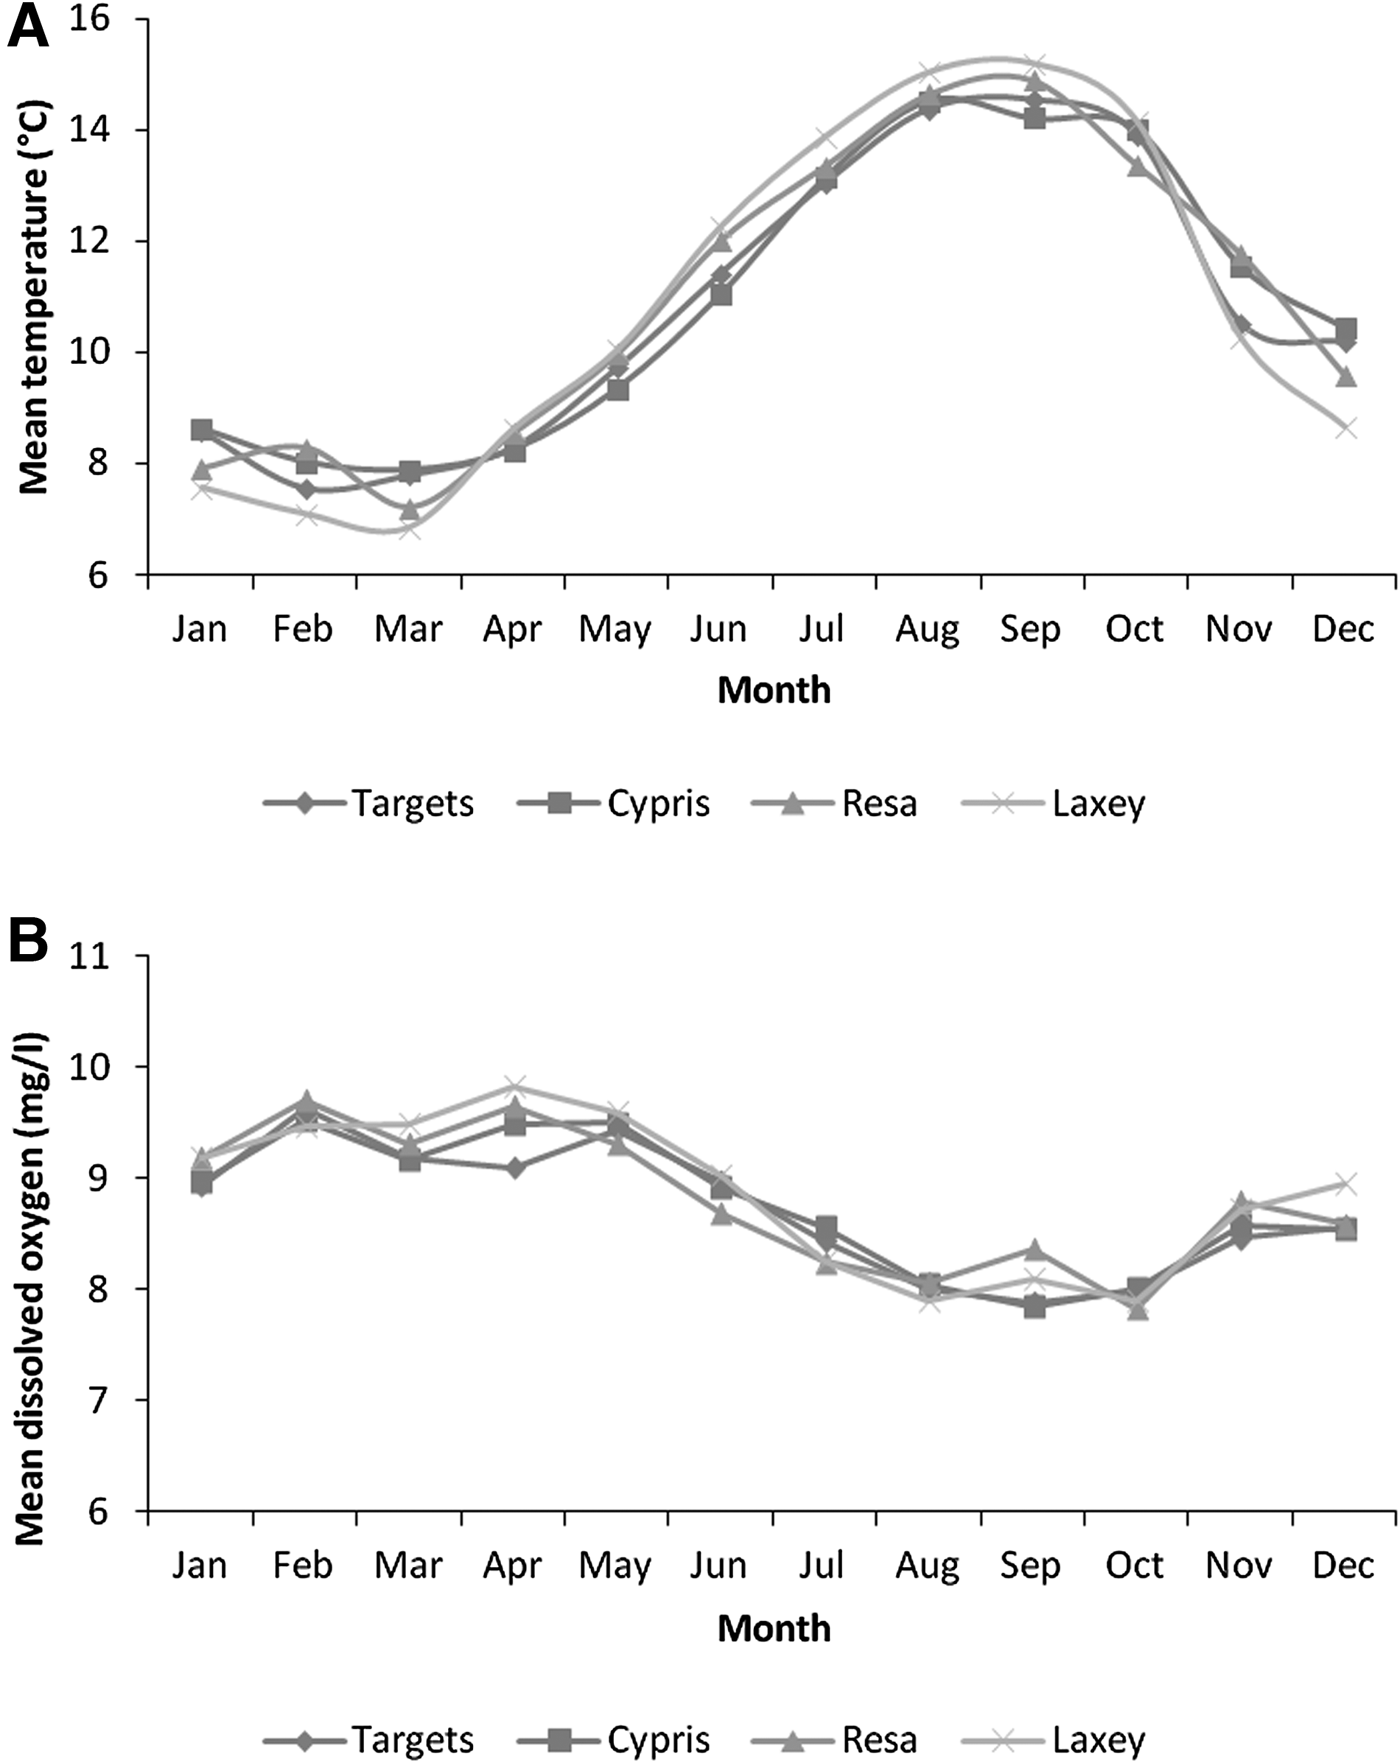
During 2007–2013 (pooled data), September was the warmest month (T mean = 14.70°C) in terms of bottom seawater temperature, and March the coldest (T mean = 7.43°C). The monthly water (bottom) temperature values showed similar trends at all the stations (Figure 3A). The highest value of mean dissolved oxygen was determined in April in Laxey (9.82 mg l−1), whereas the lowest value found in October in Resa (7.83 mg l−1) (Figure 3B).
(A) Temporal variations of mean seawater (bottom) temperature (°C); (B) mean dissolved oxygen (mg l−1) at four sampling stations (Resa, Laxey, Targets and Cypris) for the period between 2007 and 2013.

Catch composition, size and sex distribution
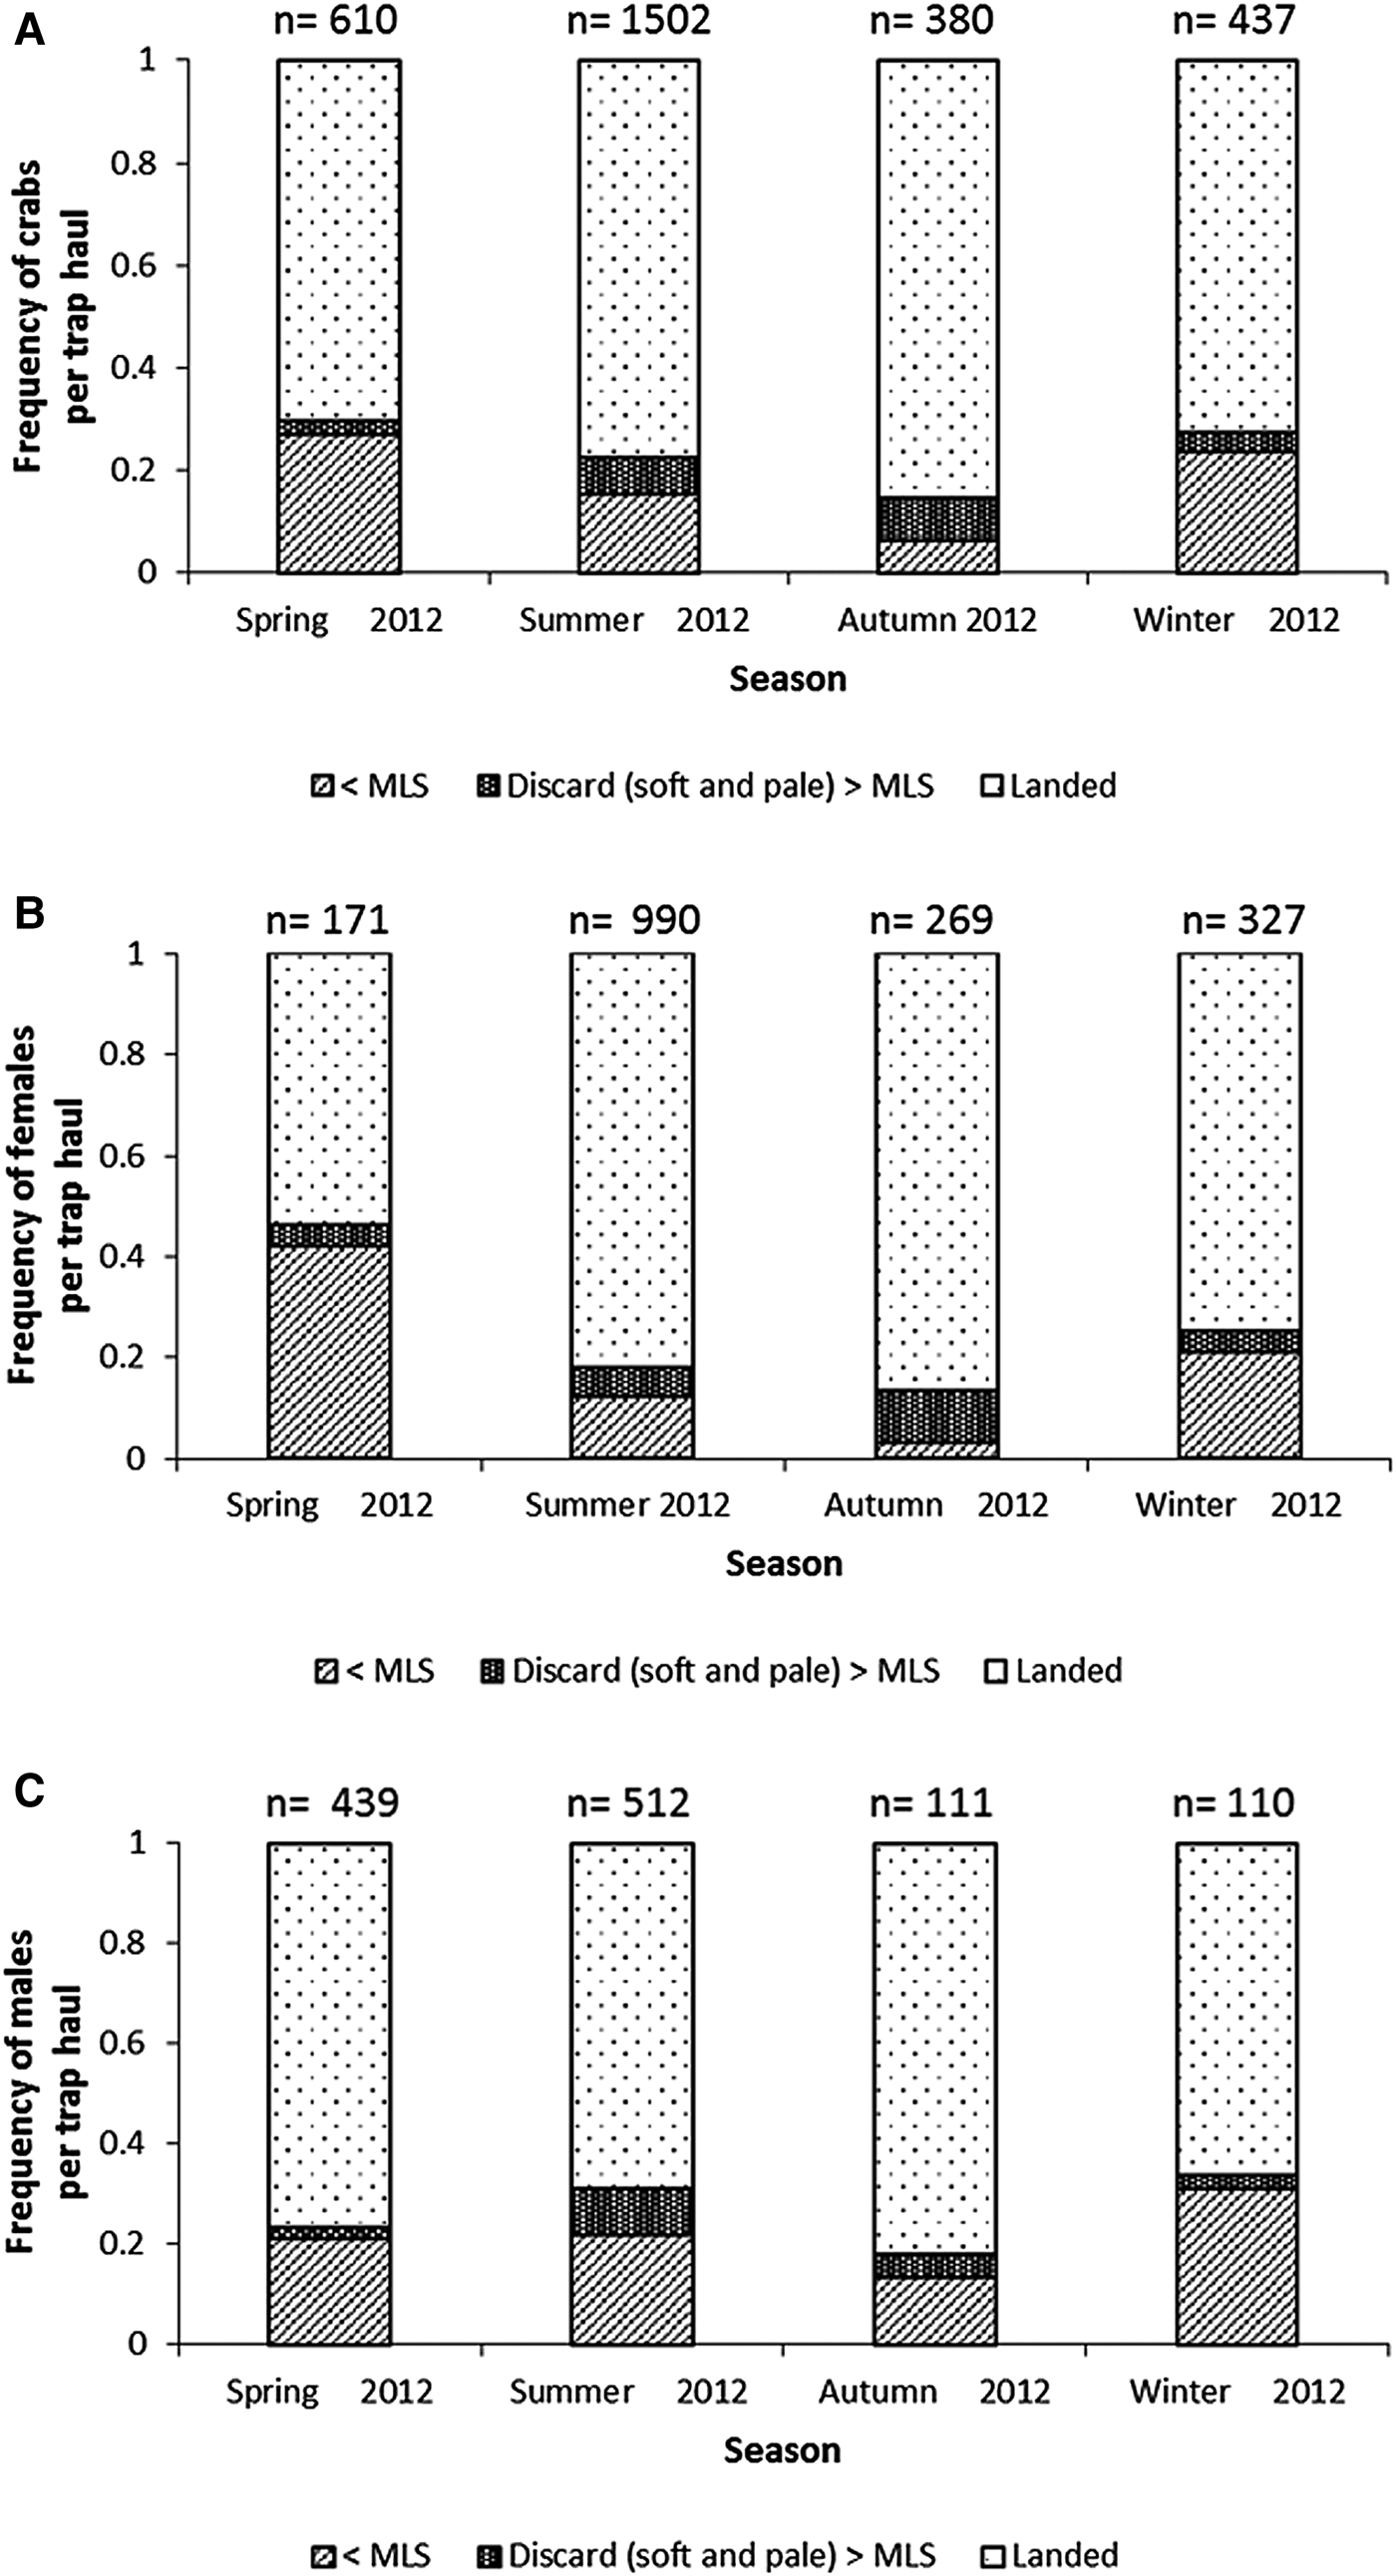
Throughout the experimental surveys, a total of 5795 commercial pots were hauled and only 16 ovigerous females were found in the pots. Despite the use of escape gaps the traps still retained 13% of females and 20% of males that were under the MLS (130 mm). The highest percentage of undersized (sub-legal) crabs in catches was 27% in spring 2012, whilst the lowest percentage was 6% in autumn 2012 (Figure 4A). The highest catches of soft and pale shelled crabs were most prevalent in catches in autumn 2012 (8%) and were least common in spring 2012 (3%) (Figure 4A). The highest landings of soft crabs exhibited seasonal differences depending on sex and perhaps suggested that males moult earlier than females (Figure 4B, C).
Proportional catch composition of (A) combined sexes, (B) females and (C) males in different seasons. The average number of crabs per trap haul is indicated above each histogram. The minimum landing size (MLS) is 130 mm. Categories: undersized crabs (<MLS), discard (soft and pale crabs) ≥ MLS and landed crabs (≥MLS). During the study only 16 ovigerous crabs were found, thus these egg-bearing crabs were not added to the stacked columns.

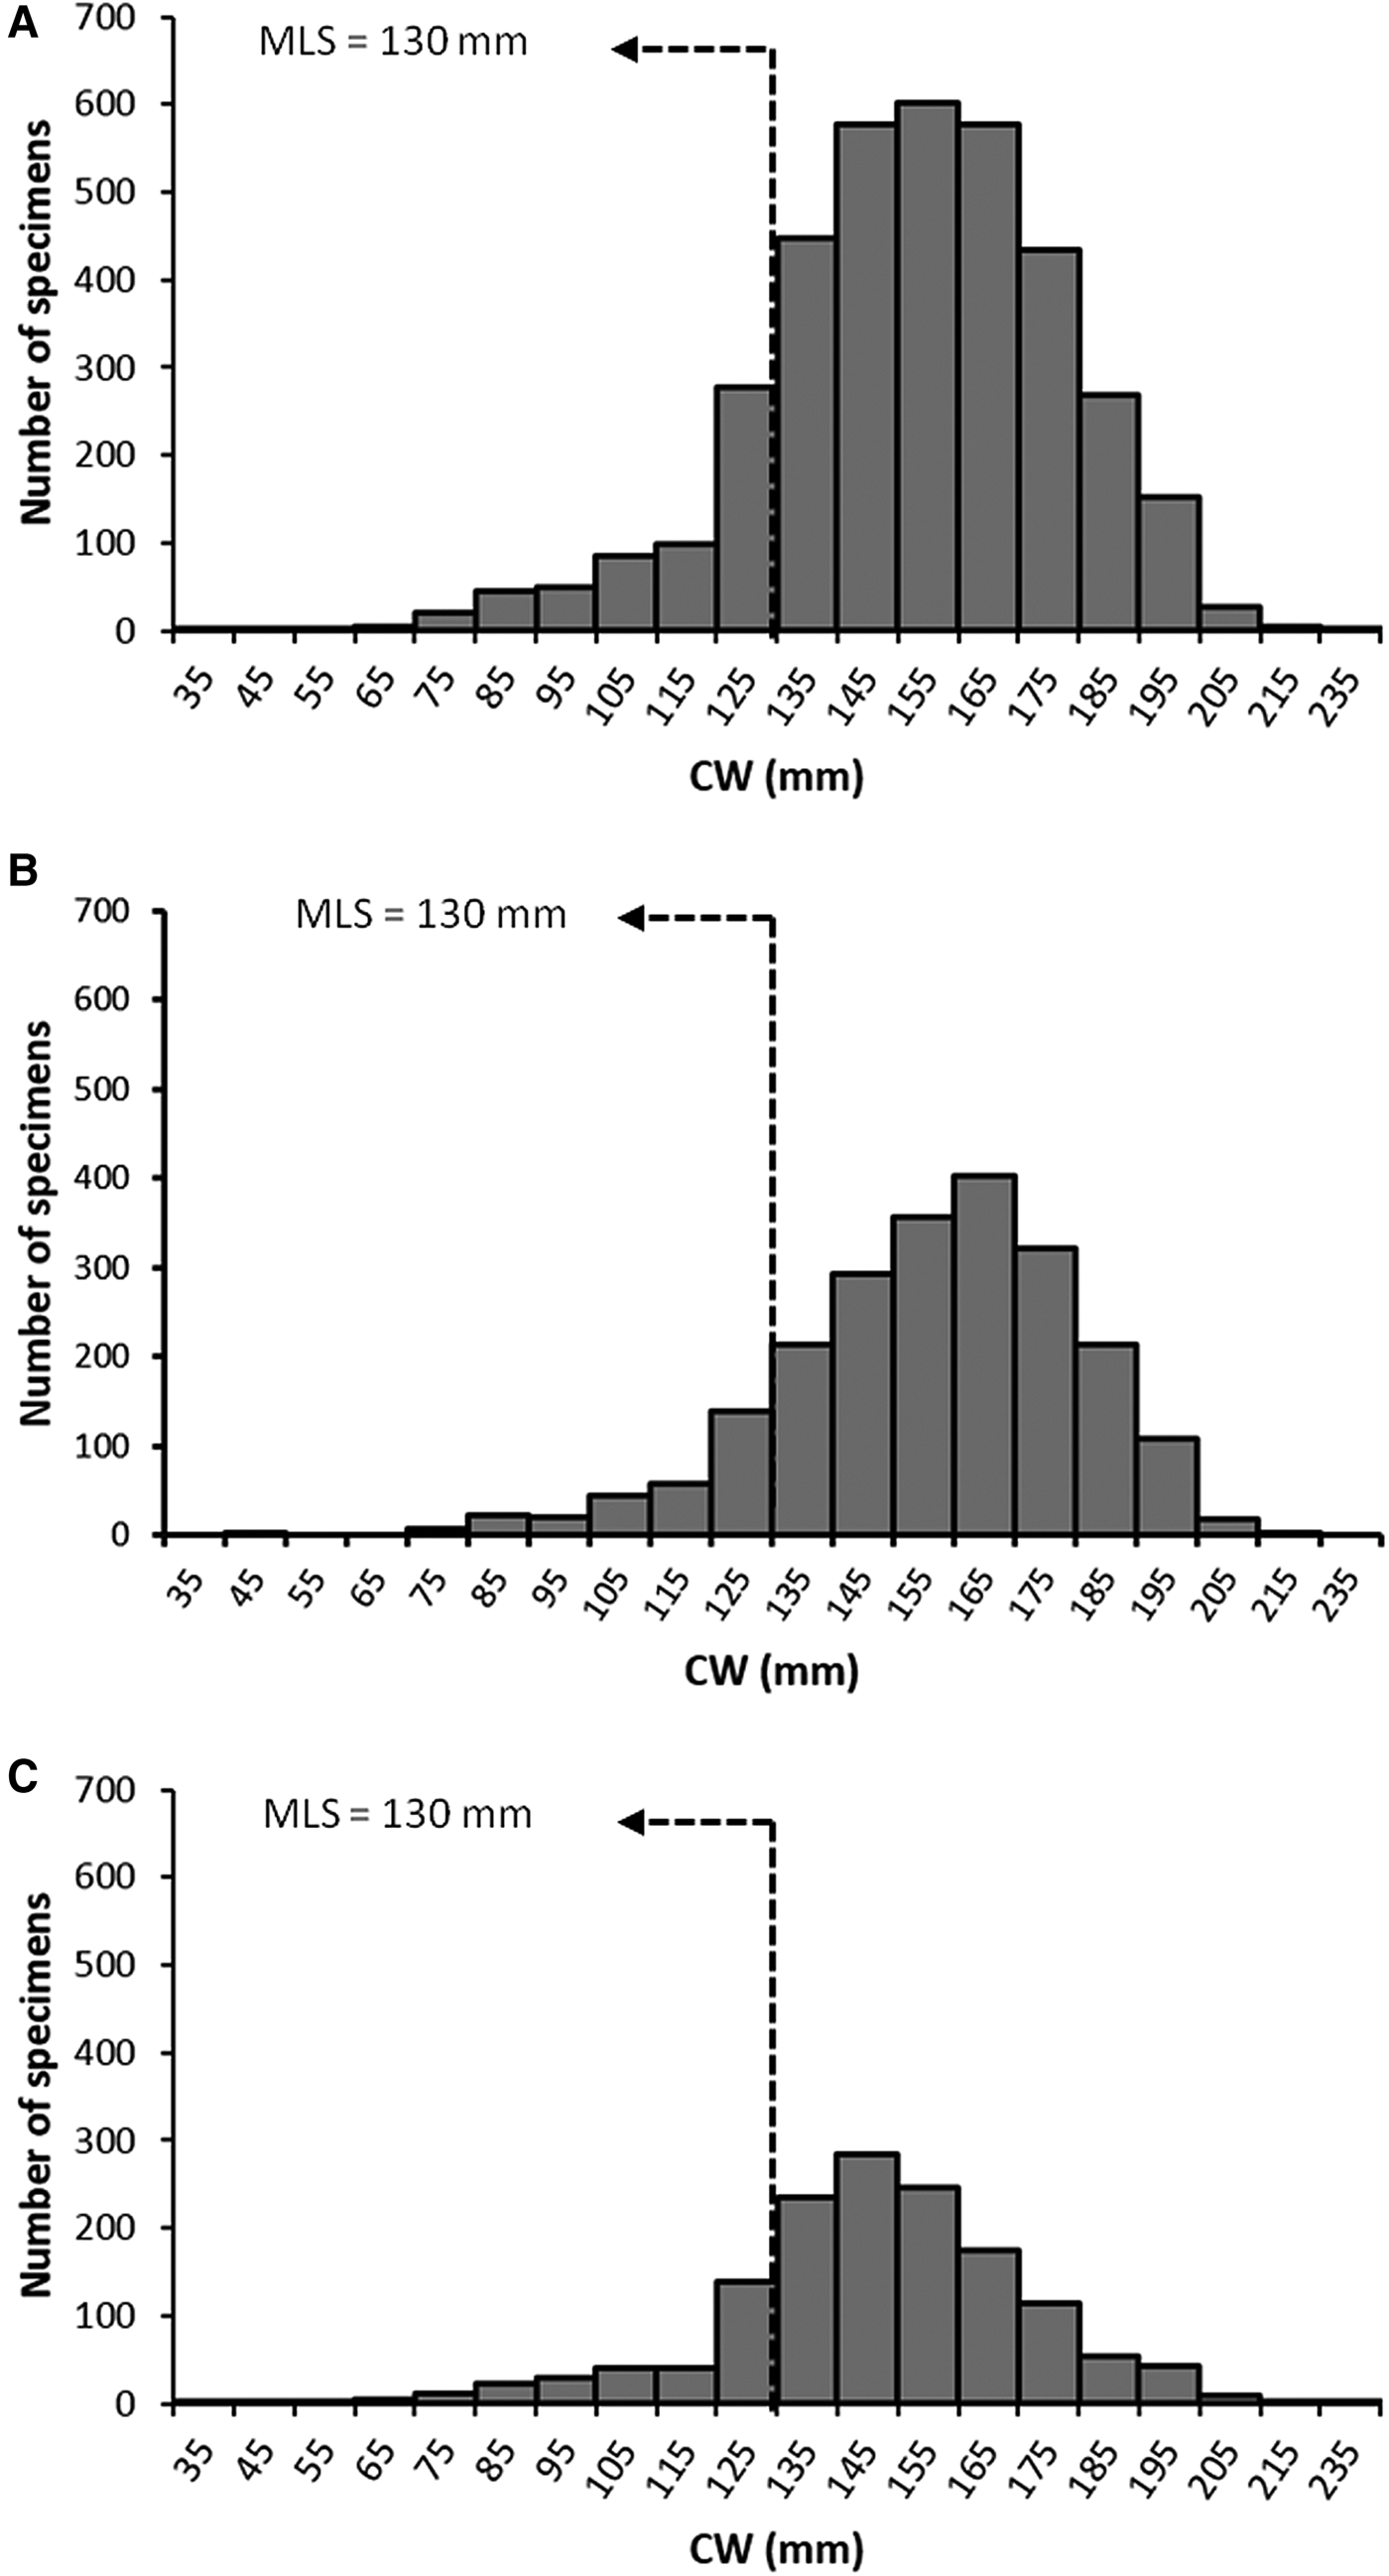
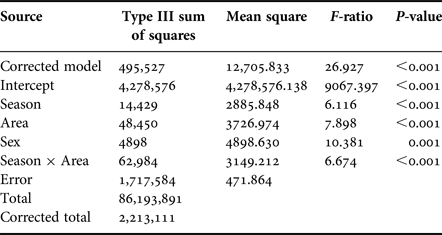
Based on the experimental fishing surveys, the mean carapace width of sampled crabs was 151 ± 25 mm (N = 3680) (Figure 5A). Mean female CW was significantly higher than that for males (females 155 ± 24 mm (N = 2228), males 145 ± 25 mm (N = 1452)) (t = 11.80, P < 0.001) (Figure 5B, C). CW of females and males significantly increased with depth (Linear regression, females: r = 0.26, P < 0.001, males: r = 0.13, P < 0.001). During the sampling period, male and female crabs from the west coast were larger than those from the fished areas of the east coast of the island and there was a significant difference (Appendix 1, Table 1). During the six seasonal experimental pot surveys, the highest mean CW of females was found in autumn 2012 (167 ± 19 mm) and CW varied significantly by the sampling seasons (Table 1). The highest mean CW of males was recorded in winter 2012 (151 ± 30 mm) and there was a significant difference in sampling seasons (Table 1).
Size (CW) distribution of (A) combined sexes; (B) female; (C) male taken in commercial catches during 2012 and 2013 (N = 3680, 2228 and 1452 respectively) using the observer data. The MLS of 130 mm is indicated with the broken line. Data came from eight fishing boats.

Summary of fitting a General linear model (GLM) using observer data to explain the relationship between the carapace width (CW) distribution and factors for the period between spring 2012 and summer 2013.

Dependent variable: Carapace width (CW), fixed factors: season and area, covariate: sex (male and female), R 2 = 0.22.
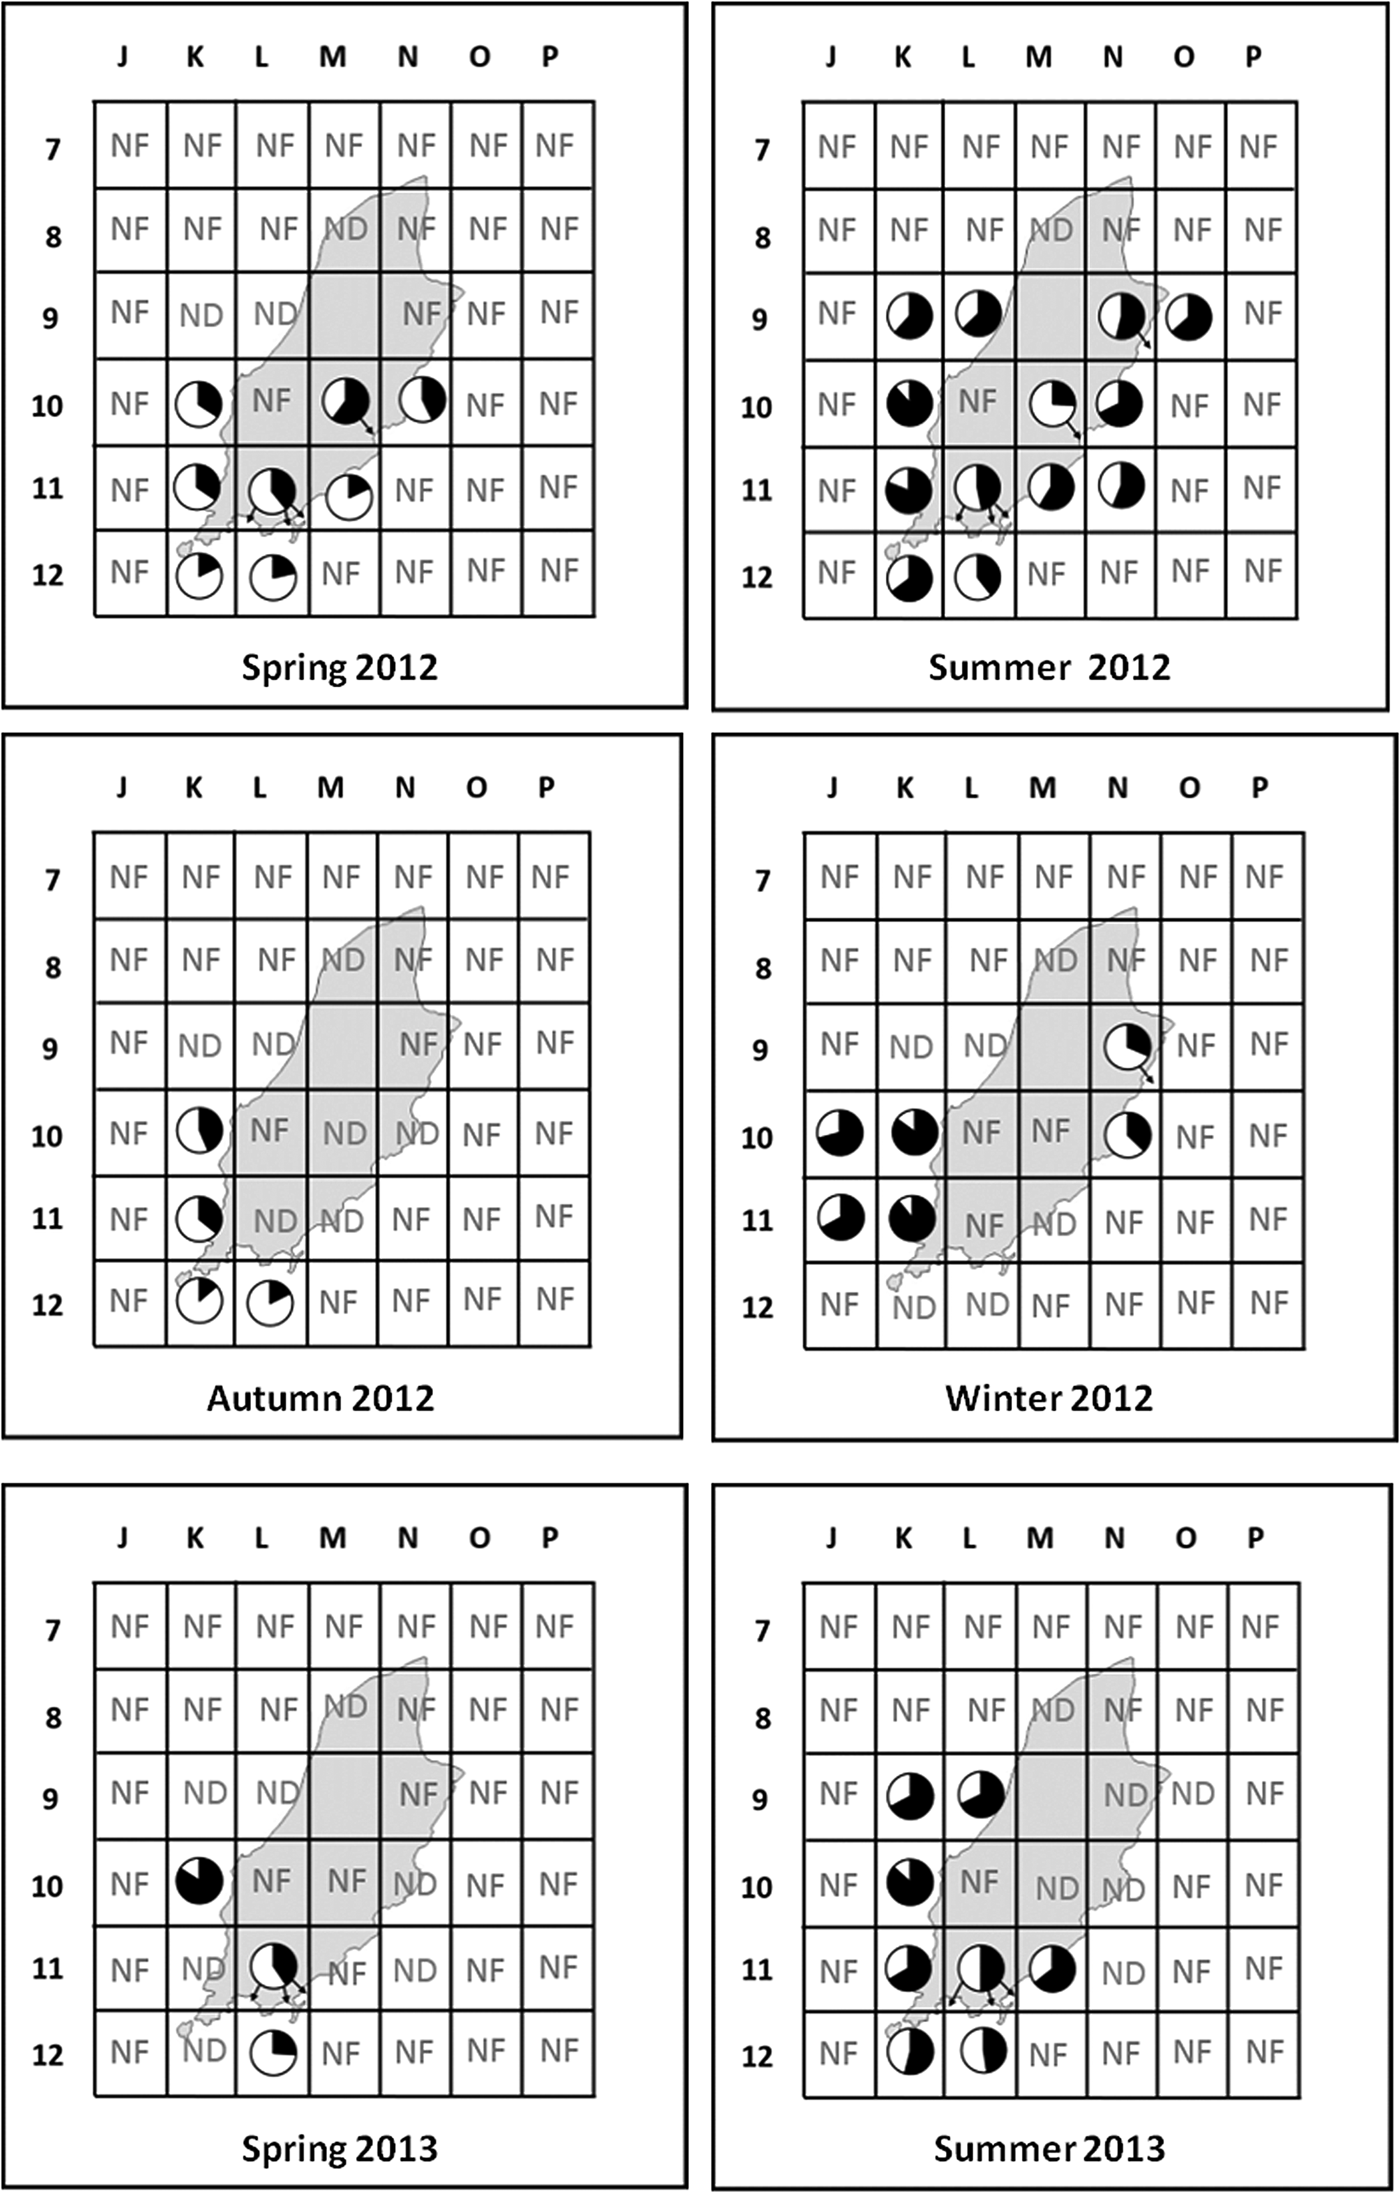
The sex ratio observed in the different areas appears to follow a pattern, with male crabs more prevalent that female crabs in both the spring of 2012 and 2013 (Figure 6). In the summer female crabs become more prevalent. The high proportion of female crabs to the west of the Isle of Man appears to be stable through the autumn and winter; however the data are limited in these seasons (Figure 6).
Seasonal sex ratios of C. pagurus for different statistical areas around the Isle of Man (for the period between spring 2012 and summer 2013). Black = females, white = males. The abbreviations are: No fishing (NF), crab fishing occurs there but no data (ND).

The relationships among CPUE and environmental and fishery-specific factors
OBSERVED CPUE
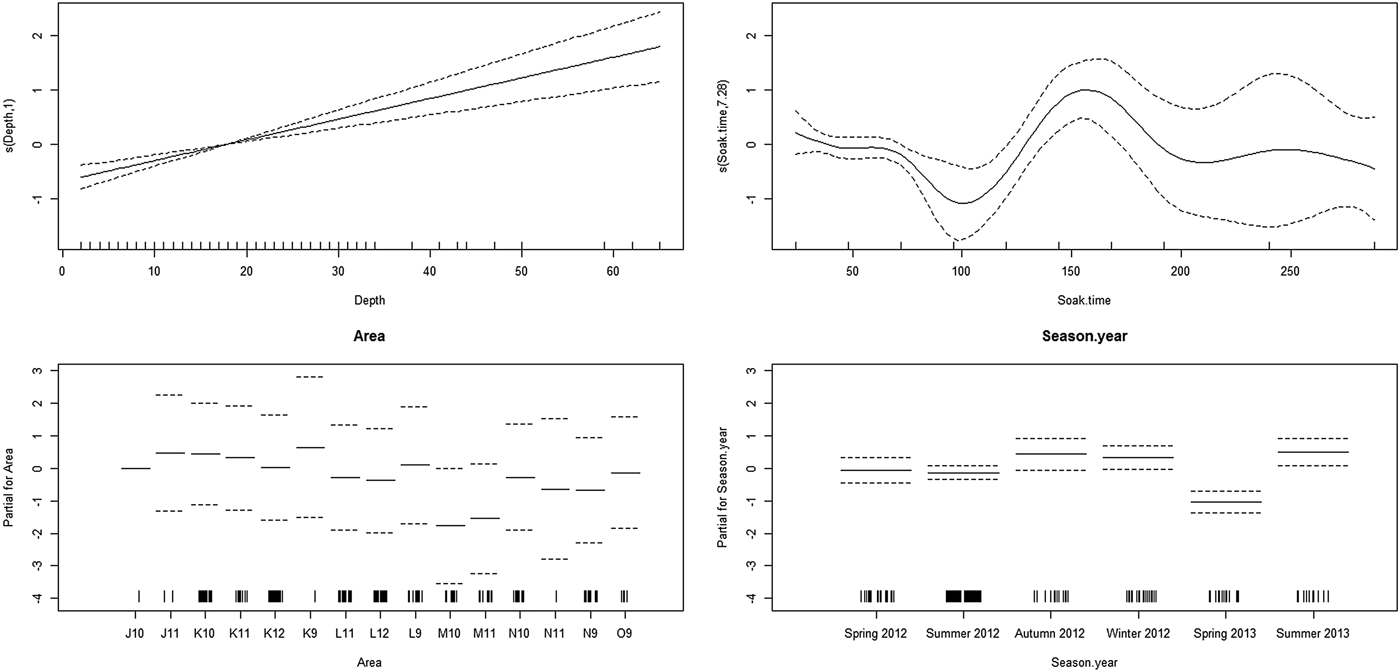
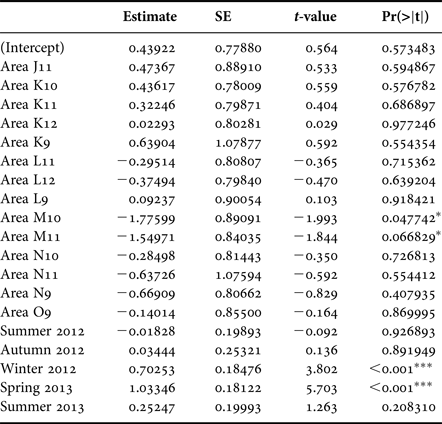
A General Additive Model (Model 1) was able to describe 65.5% of the deviance in observed CPUE data, and the smoothed terms within the model (Depth and Soak time) were significant (F = 31.45, P < 0.001; F = 2.855, P = 0.004 respectively). The adjusted coefficient of determination, R 2, value shows that the model was able to explain 69.3% of the variation in CPUE data. Backwards selection showed that a simpler model was not able to explain CPUE, with variations in model structure having a greater AIC value (Model 1 AIC = 479.58). The modelled data are visually represented in Figure 7 and summarized in Table 2.
The General Additive Model (GAM); Model 1. CPUE is explained using the model 〖CPUE〗_Obs ~ Area+ Season(Year) + s(Depth) + s(Soak time), where both Depth and Soak Time are smoothed terms.

The estimated parameters, t-values and P-values for Model 1 describing the relationship between CPUE and Factors; Depth, Soak, Area and Season.

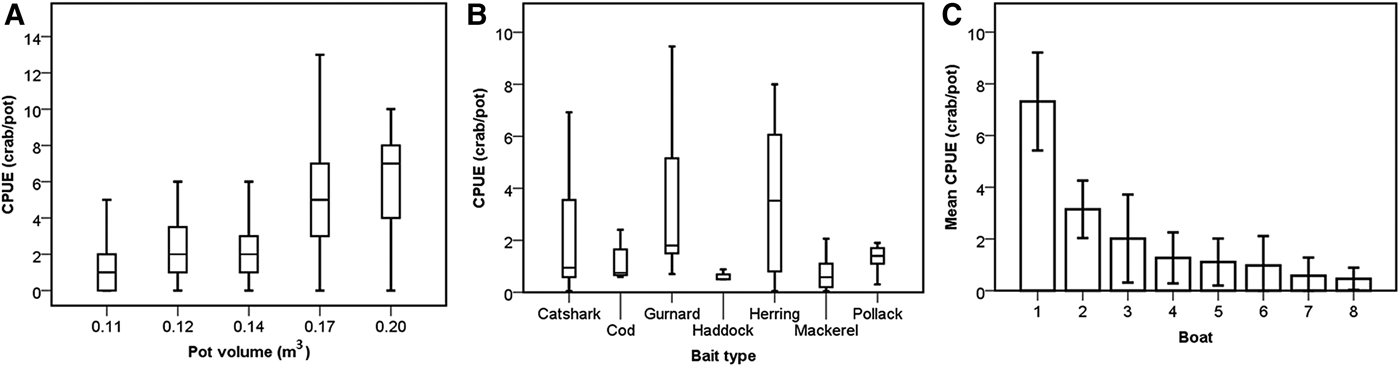
The lnCPUE of brown crab significantly increased with increasing pot volume (linear regression, r = 66.58, P < 0.001) (Figure 8A). The mean CPUE of crabs, in the pots that were baited with grey gurnard, was the highest with 3.72 ± 3.63 crab/pot, then the pots were baited with Atlantic herring and small spotted catshark had a lower mean CPUE with 3.67 ± 2.82 and 2.78 ± 0.57 crab/pot respectively (Figure 8B). The mean CPUE varied depending on boats (Figure 8C).
Scientific CPUE of brown crab depends on (A) pot volume range from 0.11–0.20 m3; (B) bait type; (C) boat.

LOGBOOK LPUE
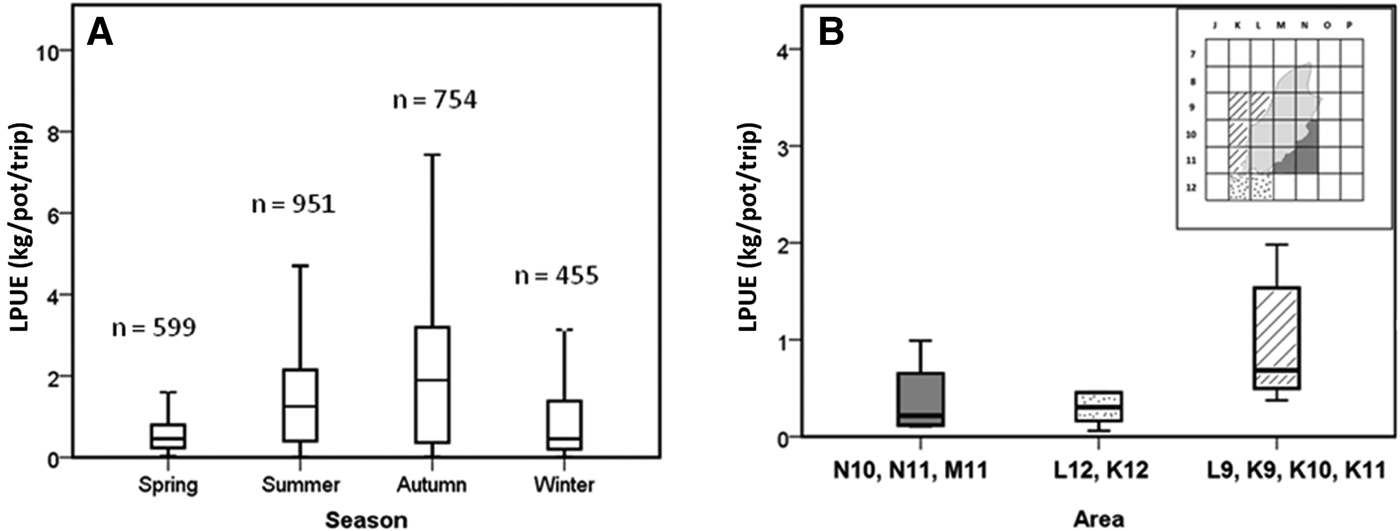
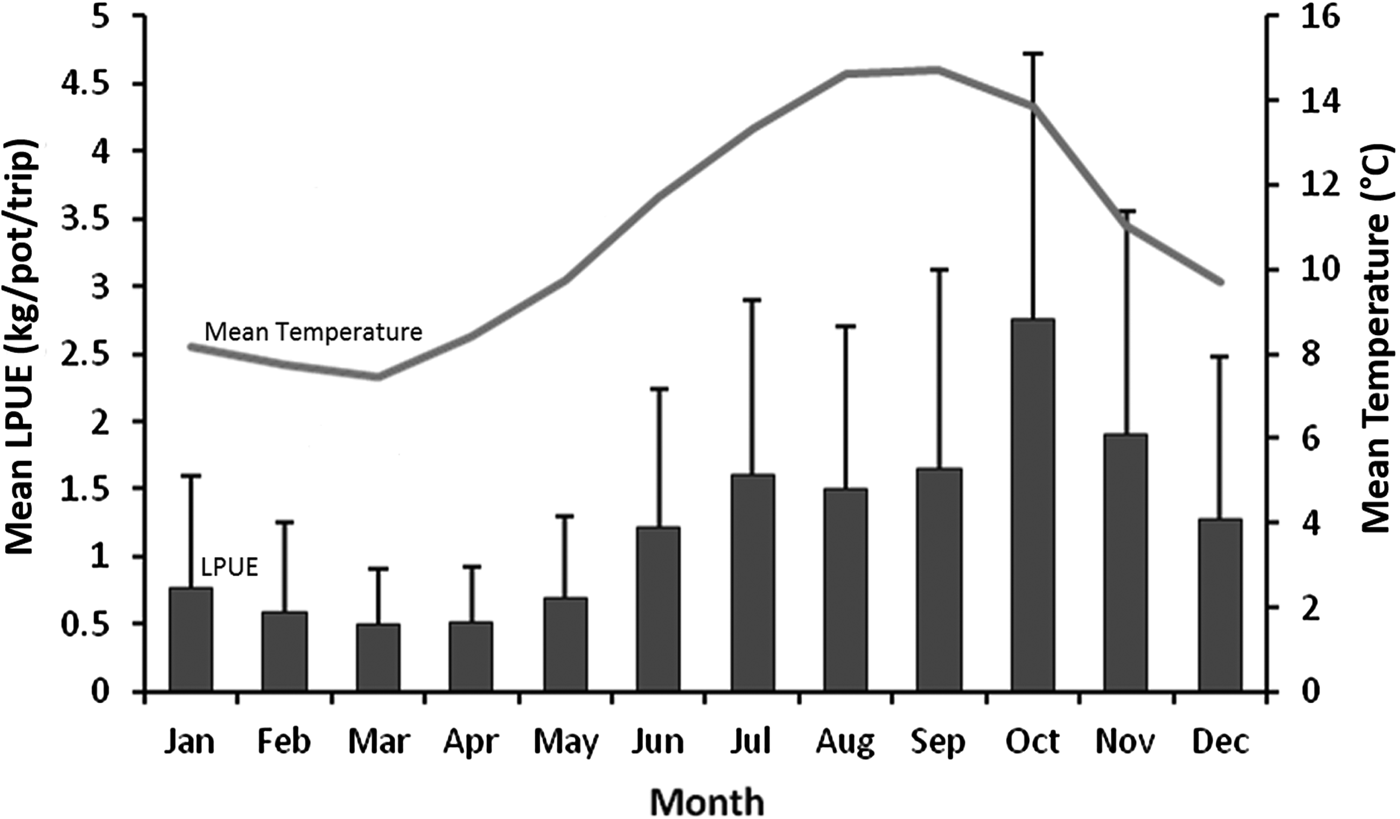
The Logbook LPUE significantly changed during the seasons for the period 2007–2012 (ANOVA, F 3, 2755 = 184.19, P < 0.001; Figure 9A). Similarly, the commercial LPUE changed depending on fishing areas in 2007 (ANOVA, F 2, 1403 = 102.74, P < 0.001; Figure 9B). Based on the logbook data, the monthly mean LPUE increased with increasing monthly mean bottom water temperature (Figure 10). Based on logbook data of annual LPUE (kg/pot/trip) for the period of 2007–2012, the LPUE of brown crab showed the smallest value with 0.92 ± 1.12 kg/pot/trip in 2008 and peaked at a record of 2.03 ± 1.76 kg/pot/trip in 2011. Furthermore, 6 years average LPUE value was determined as 1.22 ± 0.48 kg/pot/trip.
LPUE of brown crab depends on (A) season from the pooled 6 years (2007–2012) logbook data; (B) fishing area from the year 2007 logbook data.

Monthly variations in mean LPUE (kg/pot/trip) (±SD) of brown crab (Logbook data) for the period 2007–2012 (column chart) and mean bottom water temperature (°C) for the period 2007–2013 (line chart) pooled across all environmental data stations. The correlation between these two variables was significant (Spearman rank correlation, r = 0.81, P = 0.001).

Questionnaire study
Results of the questionnaire study showed that the highest numbers of soft crabs were caught in traps in the summer and autumn. Fishermen reported that the highest number of undersized crabs was caught in pots in spring. These patterns could not be differentiated between males and females. According to the questionnaire study, soak time varied between 24 and 120 h. The most common mean soak time is 48 h. Six out of 10 fishermen reported that they use three different sizes of pots of which 0.11, 0.12 and 0.14 m3 pots were the most common. The most commonly used baits are dogfish (small spotted catshark) and Atlantic herring. The responses on preferred bait usage align with the baits giving the higher average catch rates from the scientific surveys (Figure 8).
Fishing effort
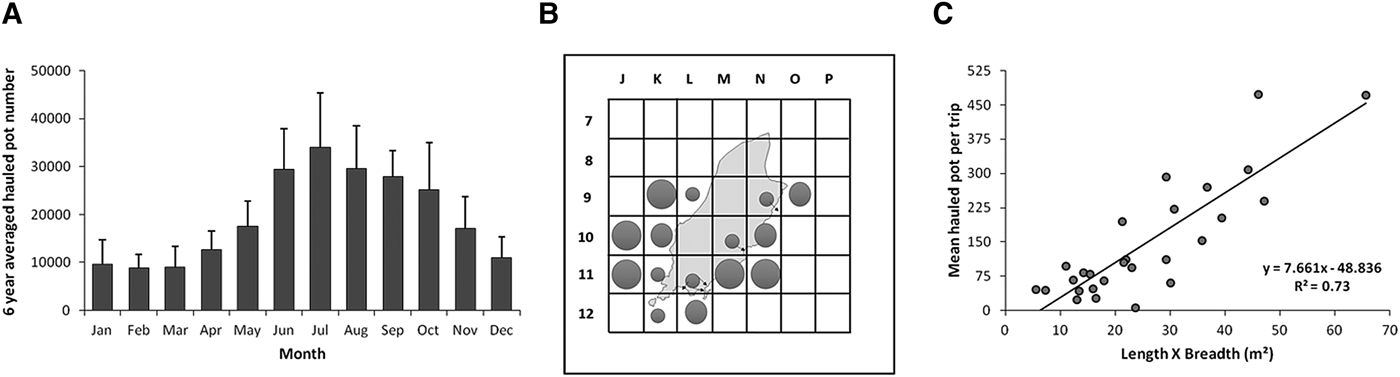
According to fishermen's logbook data, the 6-year averaged hauled pot number peaked in summer months, whilst the numbers were considerably lower in winter and early spring (for the period between 2007 and 2012) (Figure 11A). According to experimental fishing surveys, spatial variations of mean hauled pot number were highest further offshore and lowest inshore (Figure 11B). The mean hauled pot per trip increased with increasing boat space (length × breadth) (m2) (Spearman rank correlation, r = 0.76, P < 0.001; Figure 11C) which indicated that larger vessels fish with a greater number of pots in deeper water further offshore.
(A) Mean (±SD) monthly variations of 6 years averaged hauled pots (fishing effort) in the Isle of Man for the period 2007–2012 (N varied between 15 and 27 fishing boat) (logbook data); (B) Spatial variations of mean hauled pots per string in the Isle of Man in 2012 and 2013 (N = 8 fishing boat) (observer data). Big closed circles: 20 or over 20 pots, medium closed circles: 15–20 pots, small closed circles: less than 15 pots; (C) The relationship between mean hauled pot per trip of boats and length × breadth (m 2) (N = 27 fishing boat) based on fishermens' logbooks in 2012.

DISCUSSION
Catch composition, CW distribution and sex ratio
The present study provides important information about the seasonal and spatial patterns in catch composition in the waters around the Isle of Man. In general, the present study shows that the proportion of female and male crabs discarded in this fishery is relatively low and that this varies seasonally, with most discards occurring in spring and the fewest discards occurring in autumn. This may be related to an onshore migration by larger individuals in summer/autumn or could reflect the moult increment that occurs over the spring/summer season. The moulting frequency of C. pagurus is highly variable in northern Europe (Bennett, Reference Bennett1974; Edwards, Reference Edwards1979; Mill et al., Reference Mill, Dobby, McLay and Mesquita2009). The present study showed that the proportion of soft-shelled crabs in the catches was highest in summer and autumn for males and females respectively. The moulting period of crabs in the Isle of Man would appear to be similar to the moulting periods of crabs in the east coast of England (Edwards, Reference Edwards1979), Norway (Karlsson & Christiansen, Reference Karlsson and Christiansen1996) and Sweden (Ungfors, Reference Ungfors2008) which indicates that the temporal differences in moulting may be due to environmental factors (Bennett, Reference Bennett1979).
The mean size of male and female crabs differed around the Isle of Man such that larger individuals were more prevalent on the west coast where water is much deeper on average compared with the east coast of the island. However, mean size of female and male crabs showed differences depending on areas and seasons (Table 1 and Appendix 1). Similarly, Brown & Bennett (Reference Brown and Bennett1980) reported that larger crabs were found in deeper water at the western end of the English Channel.
The sex ratio of crabs entering pots differs both spatially and seasonally (Brown & Bennett, Reference Brown and Bennett1980; Bennett, Reference Bennett1995). For example, Brown & Bennett (Reference Brown and Bennett1980) noted that the sex ratio was about 1:1 in the first 6 months of the year, and then female crabs started to become dominant in the western Channel. However, they also reported that male crabs were always dominant in the eastern Channel throughout the year. The sex ratio of brown crab populations may vary among fishing grounds, depending on sampling season, habitat structure, mating behaviour, food and competition for space between sexes (Brown & Bennett, Reference Brown and Bennett1980; Bennett, Reference Bennett1995; Mill et al., Reference Mill, Dobby, McLay and Mesquita2009). In particular, mature female crabs tend to live in sandy habitats (Howard, Reference Howard1982; Woll & Alesund, Reference Woll and Alesund2006) and berried females half-bury in soft sediment to avoid strong currents (Hall, Reference Hall1993), whilst male crabs prefer to live in rocky habitats (Woll & Alesund, Reference Woll and Alesund2006). Additionally, reproductive migration is an important factor which affects the sex ratio of crab landings; in particular female crabs generally migrate from inshore to offshore (Brown & Bennett, Reference Brown and Bennett1980; Ungfors, Reference Ungfors2008). Hunter et al. (Reference Hunter, Eaton, Stewart, Lawler and Smith2013) investigated the migration and incubation cycle of mature female C. pagurus individuals using the electronic tags. They reported the westward migration related to their reproductive behaviours. Spawning migrations of female brown crab go against the direction of the prevailing current (Pawson, Reference Pawson1995; Ungfors, Reference Ungfors2008). This pattern is seen in the English Channel and Kattegat-Skagerrak and is presumed to relate to returning larvae towards ground suitable for settlement (Pawson, Reference Pawson1995; Ungfors, Reference Ungfors2008). Together, these studies suggest directional migration of female brown crab from inshore to offshore and from east to west in the English Channel presumably for the purpose of reproduction or to incubate and release larvae. In the present study, catches of female crabs in the southern and south-western waters off the Isle of Man occurred mainly in the summer and autumn (Figure 6) and were considered to relate to migratory behaviour. Presumably, following mating in summer, females migrated to the west and south towards sandy substrata where they prepare to extrude their eggs and bury themselves in the sediment to incubate them. A further line of evidence to support this observation is from the seasonal patterns in by-catch of berried females in scallop dredges which were most commonly caught to the south and west of the Isle of Man in autumn (Öndes et al., Reference Öndes, Kaiser and Murray2016). While female crabs were dominant in catches of the pot fishery in the autumn, by the end of winter and early spring male crabs were dominant in many fishing grounds around the Isle of Man.
CPUE
Catchability of crustaceans in trap gear is not well understood (Green et al., Reference Green, Gardner, Hochmuth and Linnane2014) due to a variety of environmental and biological factors that affect catch rate (e.g. current flow, water temperature) and do not provide direct estimates of abundance. Estimates of actual abundance necessitate the use of mark-recapture techniques. For example, Bell et al. (Reference Bell, Eaton, Bannister and Addison2003) and Ungfors (Reference Ungfors2008) used a mark-recapture experiment and estimated a density of 0.0021 and 0.0038 crab m−2 for edible crab on the east coast of UK and the west coast of Sweden respectively. Nevertheless, even this technique assumes that all animals in the population are likely to be active and attracted to bait which may be a flawed assumption.
Despite these issues, catches in traps may provide a means of establishing a relative index of abundance. For this reason, it is important to understand seasonal patterns in CPUE and whether this differs among areas and among male and female crabs. In the UK, the main period for the brown crab fishery is between April and November, with the highest catches recorded in October and November (Edwards, Reference Edwards1979; Hart, Reference Hart, Pitcher, Hart and Pauly1998; Mill et al., Reference Mill, Dobby, McLay and Mesquita2009). Similarly, seasonal gaps in crab landings were observed in Norway (Woll et al., Reference Woll, van der Meeren and Fossen2006), Ireland (Fahy et al., Reference Fahy, Carroll and Stokes2002; Tully et al., Reference Tully, Robinson, Cosgrove, O'Keeffe, Doyle and Lehane2006) and France (ICES, 2007). Our study shows that the highest catch of brown crab was in autumn in the Isle of Man (Figures 7A & 9A). In addition, observer data were limited in winter because of bad weather which also affects commercial landings at this time of year. Increases in water temperature generally result in an increased catchability of crustaceans because of the increase in metabolic demand (and hence hunger) and the increased rate of diffusion of bait molecules with temperature (Murray & Seed, Reference Murray and Seed2010; Green et al., Reference Green, Gardner, Hochmuth and Linnane2014). In the present study the LPUE of brown crab increased with increasing mean bottom temperature values.
Brown crabs live in both inshore and offshore waters to depths of 100 m or more (Keltz & Bailey, Reference Keltz and Bailey2010). Furthermore, Whiteley (Reference Whiteley2009) reported the change in crab abundance over time in the Isle of Man using a questionnaire study. Fishermen who have fished for many years in the Isle of Man reported that there was a decline in the crab abundance over the last 30–40 years around inshore areas. Thus, fishing grounds tend to change with distance offshore. Similar situations were reported for the brown crab around the western Channel, Yorkshire and East Anglia (Bannister, Reference Bannister2009). The present study reports that CPUE of brown crab increases with depth in the Isle of Man.
Despite a wide range of soak times (24–288 h) encompassed in the present study, there was no discernible effect of soak time on CPUE. Similarly, previous studies have suggested that pot catch does not increase linearly with the soak time (Caddy, Reference Caddy1979; Robertson, Reference Robertson1989; ICES, 2005), yet increases towards an asymptote (Bennett & Brown, Reference Bennett and Brown1979; Briand et al., Reference Briand, Matulich and Mittelhammer2001; Bell et al., Reference Bell, Eaton, Bannister and Addison2003). Interestingly, Ungfors (Reference Ungfors2008) found a positive correlation between soak time and landed brown crab number. Another important issue is trap saturation; Caddy (Reference Caddy1979), Miller (Reference Miller1979) and Robertson (Reference Robertson1989) reported that trap saturation relates to reduced entry of crabs into a trap and/or escapement from the trap. Moreover, crabs are commonly known as nocturnal animals, which mainly feed at night (Karlsson & Christiansen, Reference Karlsson and Christiansen1996; Skajaa et al., Reference Skajaa, Fernoe, Loekkeborg and Haugland1998). Thus, catch rates can be higher at night than during the day (Brown, Reference Brown1982). In conclusion, the effects of localized and seasonal differences in crab abundance around the Isle of Man may have masked any potential effect of soak time in the current dataset.
In brown crab fisheries, pot type and size are not standardized as part of fisheries legislation. For this reason there is considerable freedom for fishermen to utilize a range of different pot designs. Shelton & Hall (Reference Shelton and Hall1981) compared the efficiency of the Scottish creel and inkwell pot in the capture of brown crab. They could not find any significant difference between the numbers caught by these two fishing gears. To date, the effect of trap size on brown crab catches has not been evaluated clearly in the literature. In the current study, a statistically significant correlation was found between the pot volume and amount of catch per pot such that larger pots catch more crabs than small pots. Fisheries management should account for both pot number and pot size or pot volume when considering effort controls.
Bait type may affect catches of some crustacean species which have well-developed chemoreceptory senses (Krouse, Reference Krouse and Caddy1989; Montgomery, Reference Montgomery2005). It is clear from the results of the present study that bait type affected the catch rates of brown crab; the mean CPUE of crabs in pots baited with grey gurnard was the highest, followed by Atlantic herring and small spotted catshark. According to the questionnaire study, the baits commonly used in the Isle of Man are small spotted catshark and Atlantic herring.
There has been some interest in the idea of marketing as bait the by-catch that must be retained and landed under the forthcoming EU Landings Obligation (Boyle & Thompson, Reference Boyle and Thompson2012). Both grey gurnards and small spotted catsharks occur as by-catch in the Isle of Man queen scallop net fishery and thus may provide a ready supply of bait in the future.
The assumptions of an estimate of CPUE are that the catchability of the target species remains constant in relation to environmental variation and interactions with other species. Pot sampling is complicated by the fact that bait plume odours are spread on currents which vary continually from one day to the next and the strength of tide will influence the extent of any bait plume. In the present paper we identify the extent to which some of the environmental variables affect CPUE, e.g. depth which is most probably related to temperature and current strength. Other variables include soak time and the species that are the first entrants into the trap (i.e. the effect on animal behaviour of the first arrivals and number of animals within the pot). In observational studies these variables are usually difficult to control. Nevertheless they can be accounted for by using appropriate covariates as revealed by approaches such as general additive modelling. The data derived in the present study will be of greater value once a time series is developed, however longer term, the control of some variables is highly desirable, e.g. pot design, soak time, bait identity and quantity etc.
Fishing effort
The evaluation of commercial and scientific data together to estimate CPUE is rare in the literature (Fox & Starr, Reference Fox and Starr1996; Potier et al., Reference Potier, Petitgas and Petit1997; Starr & Vignaux, Reference Starr and Vignaux1997; Petitgas et al., Reference Petitgas, Poulard and Biseau2003). Although a major problem in shellfish science is a lack of effort data, it is assumed that potting effort has increased in many fisheries due to the modernization of the inshore fleet and extension of the fisheries to offshore grounds (Bannister, Reference Bannister2009). The present study reports the seasonal variations in hauled pot number in the Isle of Man. The 6-years averaged hauled pot number peaked in summer months, whilst the numbers were considerably lower in winter and early spring (for the period between 2007 and 2012). Similarly, there were considerable spatial variations in the mean hauled pot number. The mean hauled pot number was highest in some areas off the west coast (K9, J10 and J11) and, south-east coast (M11 and N11). Additionally, Whiteley (Reference Whiteley2009) reported that in the Calf of Man (K12) fishing effort is fairly high in the summer in comparison with the winter around the southern tip of the Isle of Man.
Fisheries management
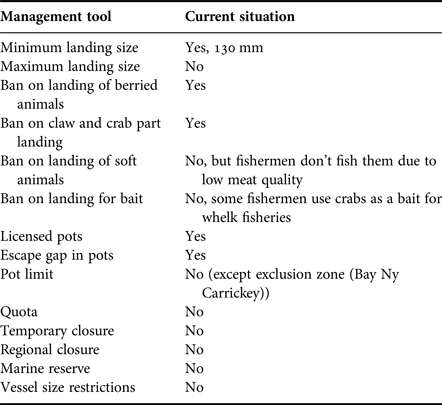
The current regulations in the Isle of Man achieve a number of conservation objectives in relation to crab fisheries. In particular, regulations ban the retention of berried crabs and prevent deliberate de-clawing (Table 3).
Management measures and current regulations that relate to edible crab fisheries in the Isle of Man.

One feature of the Manx fleet that became apparent during the study was the relationship between catch capacity and vessel size. The commercial potting vessels varied from 4 to 12 m in length with most vessels <10 m. More importantly, the present study points out that the mean hauled pots per trip increased with increasing boat deck space (length × breadth). The introduction of a greater number of large vessels into the Isle of Man fishery would indicate increasing fishing capacity and may act as a warning of increasing fishing effort. This also indicates that fishing effort could be controlled through the use of measures that limit vessel size.
According to questionnaire survey, fishermen believed that the MLS, pot number limits and enforcement of MLS are the most effective regulatory tools for the conservation of the crab population (Whiteley, Reference Whiteley2009). Whiteley (Reference Whiteley2009) reported that there appears to have been a change in crab abundance over time in the Isle of Man, based on a questionnaire study. Fishermen who had fished for more than 10 years in the Isle of Man reported a decline in crab perceived abundance over the last 30–40 years around inshore areas. Thus, fishing grounds tend to change to further offshore. However, more recent entrants into the fishery did not perceive this effect. According to Whiteley (Reference Whiteley2009), 40% of Manx pot fishermen believed that individual pot numbers should be decreased, and 15% of fishermen suggested that total number of pots fished in the Isle of Man should be decreased. However, limiting pot numbers has both advantages and disadvantages. For example, the pressure on the grounds can be reduced by reducing the numbers of pots but limitations of individual pot allocation would mean a greater number of vessels, possibly leading to greater conflict over access to ground (Whiteley, Reference Whiteley2009).
CONCLUSIONS
The integration of logbook data, observer data and questionnaire survey data provides useful insights into stock abundance and hence the sustainable management of marine resources (Campbell, Reference Campbell2004; Lordan et al., Reference Lordan, Cuaig, Graham and Rihan2011). In this study, the brown crab fisheries were evaluated based on the logbook data, observer data and questionnaire survey data. The study demonstrates the seasonal and spatial complexity in catch which indicates that sampling regimes should account for this variability, particularly if migratory patterns in male and female crabs are to be taken into account. The use of a ‘sentinel’ commercial fleet with automated monitoring (e.g. through the use of on-board cameras) could achieve this objective (Hold et al., Reference Hold, Murray, Pantin, Haig, Hinz and Kaiser2015). In our study, no crabs under 134 mm CW were found to be carrying eggs. Thus it may be the case that the current MLS does not adequately protect female crabs such that they are able to breed at least once.
SUPPLEMENTARY MATERIAL
The supplementary material for this article can be found at https://doi.org/10.1017/S0025315417001849
ACKNOWLEDGEMENTS
We are grateful to the Department of Environment, Food and Agriculture (DEFA) officers and Manx crab fishermen for their contributions. The comments of anonymous reviewers improved an earlier version of this manuscript.
FINANCIAL SUPPORT
This study was funded by the Ministry of National Education, Republic of Turkey (awarded to F.Ö.) and the Department of Environment, Food and Agriculture (DEFA), the Isle of Man Government (awarded to M.J.K.).