


I. Introduction
There exists significant interest in modeling the determinants of price variations for differentiated products. The hedonic approach, which assumes prices are determined by the attributes or characteristics of products, is typically employed. A substantial body of literature has developed over 25 years that uses the hedonic approach to estimate the relation between the price of wine and its attributes. Attributes typically include a sensory rating of the wine's quality, the impact of weather, the wine's age, grape variety, and region. More than 100 papers estimating hedonic wine price functions have been identified by Outreville and Le Fur (Reference Outreville and Le Fur2020). In part, the vast array of studies over time and across many countries is driven by the highly differentiated nature of wine products making wine a prime candidate for hedonic price function estimation.
The hedonic wine price literature typically cites the Rosen (Reference Rosen1974) framework as its theoretical basis. Rosen's (Reference Rosen1974) perfect competition framework suggests consumers and producers interact to demand and supply a product with various attributes. This interaction results in a market-determined hedonic price function, which is a function of attributes alone. The presence of specific attributes is motivated by their inclusion in the representative consumer's utility function and producer's cost function. The price function results from an envelope of various consumer bid and producer offer functions, which, however, cannot uncover individual consumer or producer-specific features. Most estimated hedonic wine functions recognize the need to use only wine attributes. However, some studies have included producer-specific variables in the hedonic price function to capture supply influences on prices. For example, Outreville and Le Fur (Reference Outreville and Le Fur2020) list 17 papers that employ quantity sold and/or producer size in hedonic price functions.
This paper recognizes that the inclusion of producer-specific variables in the hedonic price function is inconsistent with the Rosen (Reference Rosen1974) framework. To overcome this deficiency, Rosen's (Reference Rosen1974) two-stage approach should be employed to accurately estimate the supply of wine attributes, which includes producer-specific variables. The first stage consists of estimating a standard hedonic price function based on attributes only. Then estimated marginal attribute prices are used in a second stage, which includes producer-specific variables. To identify the inverse supply function, price data from multi-markets of different consumers are used for similar wines.
This paper presents what appears to be the first application of Rosen's (Reference Rosen1974) two-stage approach for estimating wine attribute supply functions. The two-stage approach is applied to Australian produced wines sold in Australia and some of its major international markets. The focus on producer-specific variables rests with producer size, experience, reputation, and the potential influence of wine conglomerates. The application is important as it will help clarify the relation between producer size and attribute prices. This relation has gained considerable attention in the literature, and arguments around the potential effects of economies scale in production are used to rationalize the typically estimated inverse relation between quantity sold and price in hedonic price functions. In contrast, this paper employs the more theoretically consistent two-stage approach to identify the relation between producer size and marginal attribute prices. Unexpectedly, results point to a direct relation between producer size and marginal attribute prices, which appears to be principally due to the different methods employed rather than the peculiarities of the data set.
Given the scarcity attribute supply estimation applications in the general economics literature and that this paper appears to provide the first attribute supply estimates for wine, we initially provide an overview of hedonic price theory and estimation in the next section. In Section III, hedonic wine price models, in general, are discussed. Section IV outlines the data and specifies the hedonic wine functions to be estimated. The results are presented in Section V with a discussion and conclusion provided in Section VI.
II. Hedonic Price Theory and Estimation
Rosen (Reference Rosen1974) assumes a good can be characterized by n different attributes zi whose price is described by a hedonic price function p(z) = p(z 1, z 2,…. zn). The partial derivative of p(z) is termed the marginal implicit price pi (=∂p(z)/∂zi). Rosen (Reference Rosen1974) assumes perfect competition and prices p(z) are determined by the market.
Given the market determined p(z), consumers are assumed to choose levels for attributes by maximizing utility (u) subject to an income (y) constraint. This results in a bid (or value) function θ(z; u, y, α), where α specifies individual consumer-specific tastes. The bid function specifies the maximum price they are willing to pay for an attribute z at a fixed level of utility and income given their tastes.
Symmetrically, given p(z), producers are assumed to choose the number of units (M) of the good and levels of z to produce by maximizing profits (π).

where C(.) represents the total cost function gained after minimizing factor costs given its production technology. It is assumed that C is convex with CM > 0, $C_{z_i}$ > 0, and $C_{z_iz_i}$
 > 0.
The first order conditions for maximizing Equation (1) imply:


This program results in an offer function ϕ(z; π, β), where β specifies differences among producers in terms of factor prices and technology. The offer function describes the minimum price that producers are willing to receive for attributes z at the fixed level of profit, for the optimally chosen output level. Using Equation (2), profit maximization results in $\phi _{z_i}$ (= ∂ϕ/∂zi) = $C_{z_i}/M$
 , that is, the marginal offer function equals the marginal cost per unit of producing the attribute. The optimization program assumes $\phi _{z_i}$
 > 0 and $\phi _{z_iz_i}$
 > 0.
In equilibrium, tangents among the bid and offer functions “kiss” at various levels of z to trace out p(z). The marginal bid $\theta _{z_i}\;$ (= ∂θ/∂zi), marginal offer $\phi _{z_i}$
 , and marginal price pi are equal in equilibrium for attribute zi. The p(z) function is just a function of z and does not reveal any information about y, α, and β as it is a result of a joint envelope of the bid and offer functions.
To estimate marginal bid and marginal offer functions, a two-stage approach was initially recommended by Rosen (Reference Rosen1974). In the first stage, estimate the hedonic price function in Equation (4):

and calculate the respective marginal hedonic prices

Substitute Equation (5) into the empirical counterpart marginal bid and marginal offer functions:


Equation (6) is the empirical marginal bid function where Y 1 captures the demand shifters y (income) and α (taste differences). While Equation (7) is the empirical marginal offer (inverse supply) function where Y 2 captures the supply shifters β (factor price and technology differences).Footnote 1
Brown and Rosen (Reference Brown and Rosen1982) point out a fundamental identification problem in estimating Equations (6) and (7) from single market data as effectively Equation (4) contains the same information as Equations (6) and (7) unless further restrictions are imposed. At least three methods have been employed to overcome this identification problem: (1) impose restrictions on the functional forms employed (e.g., Quigley, Reference Quigley1982); (2) employ data from multiple markets (Brown and Rosen, Reference Brown and Rosen1982); and (3) use a quasi-experimental setting analyzing markets before and after treatment, event, or shock (Greenstone, Reference Greenstone2017; Banzhaf, Reference Banzhaf2021). For a recent overview of the various approaches, see Taylor (Reference Taylor, Champ, Boyle and Brown2017).
We focus on the use of data from multi-markets for model identification. In this case, Equation (4) is estimated separately for each market, and then using marginal prices from Equation (5), data from all markets are combined to estimate a single marginal bid (Equation (6)) and marginal offer (Equation (7)) function for the individual attributes. Importantly, as articulated by Epple (Reference Epple1987) and subsequently recognized by most studies examining marginal prices, the level of attributes is chosen optimally based on marginal prices and, as such, are endogenous in Equations (6) and (7). This requires the use of techniques such as instrumental variables (IV) to consistently estimate the marginal offer and bid functions.
In terms of identification, as summarized by Ekeland, Heckman, and Nesheim (Reference Ekeland, Heckman and Nesheim2002, p. 309), if there is no variation in consumer preferences or producer technologies across markets, then only one price function exists across markets, and the identification problem arises. However, if preferences and/or technologies differ across markets, then identification is possible. In particular, if consumer preferences do not differ across markets, but technologies do, then the demand function or marginal bid function can be identified. This approach has frequently been employed for housing markets to estimate inverse demand functions, see, for example, Palmquist (Reference Palmquist1984), Bartik (Reference Bartik1987), Zabel and Kiel (Reference Zabel and Kiel2000), Mei, Hite, and Sohngen (Reference Mei, Hite and Sohngen2017), Jun (Reference Jun2019), and Shaw et al. (Reference Shaw, Huang, Lin, Hsu and Tsai2021). In contrast, if consumer preferences differ across markets but producer technologies do not, then the supply function or marginal offer function can be identified.
For the wine market application, we focus on the latter case and the estimation of a marginal offer or inverse supply using a multi-market data approach. Unlike demand studies, it appears only a few studies have explicitly estimated marginal offer functions employing the multi-market data; examples include Witte, Sumka, and Erekson (Reference Witte, Sumka and Erekson1979), Kinzy (Reference Kinzy1982), and Coulson, Dong, and Sing (Reference Coulson, Dong and Sing2021) for housing markets, Pardew, Shane, and Yanagida (Reference Pardew, Shane and Yanagida1986) for agricultural land prices, and Thomas (Reference Thomas1993) for the motor carrier industry. Effectively, the task is to identify separate groups of consumers who have different tastes and preferences for similar goods. If the marginal prices across these separate markets are different, then sufficient data variability will exist to trace out the marginal offer or inverse supply function.
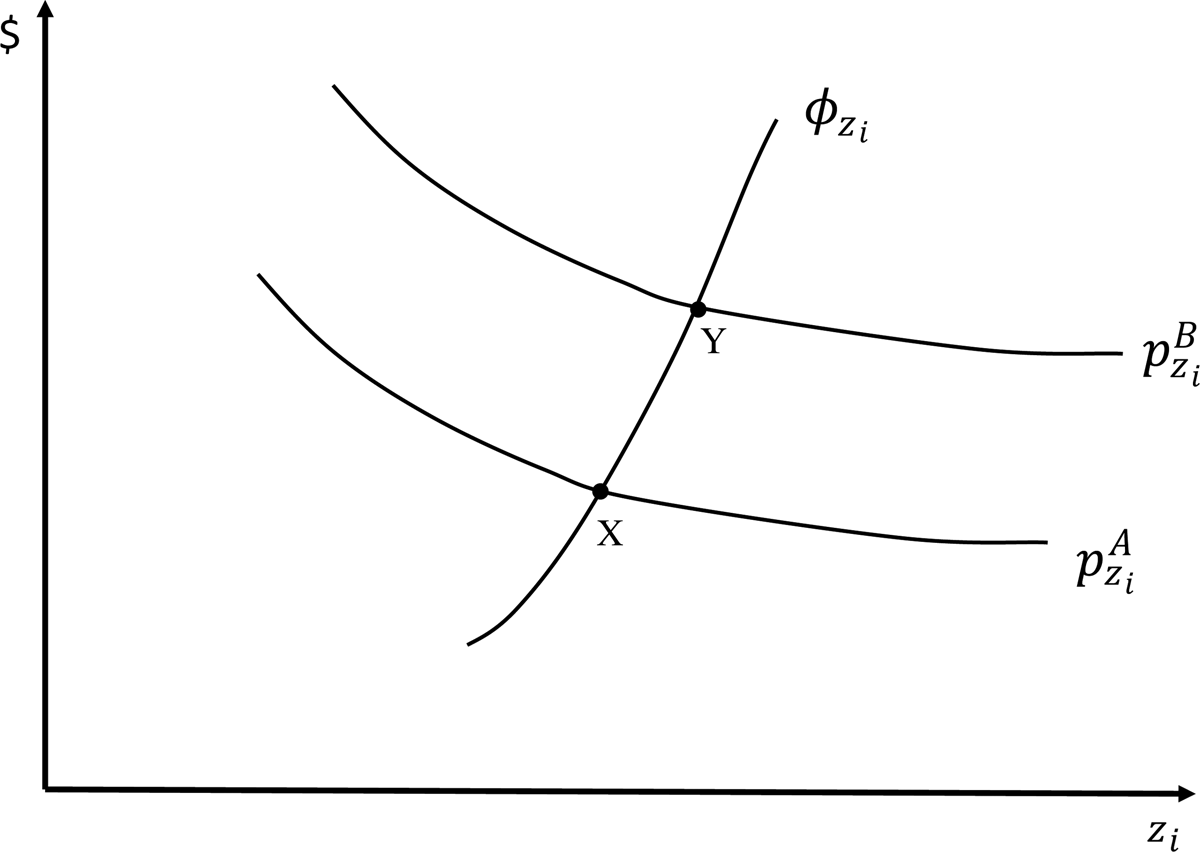
The intuition behind the multiple market approach to supply identification is illustrated in Figure 1, where two separate consumer markets (A and B) exist for the same good. Assume the marginal price function for attribute zi is downward sloping and exists for two separate markets depicted by the curves $p_{z_i}^A$ and $p_{z_i}^B$
 . Downward sloping marginal price functions reflect price functions that are increasing at a decreasing rate in attribute levels, which is typical of applications (Taylor, Reference Taylor, Champ, Boyle and Brown2017, p. 239). An upward sloping marginal offer curve is also depicted by the $\phi _{z_i}$
 curve. If only one market A existed, the marginal offer curve cannot be identified as only one point (X) on it exists. However, assuming that the model types are similar across the two markets A and B, two points (X and Y) can be identified to trace out the marginal offer curve.Footnote 2
Multi-Market Marginal Offer Function
Given our focus on inverse supply estimation, it is useful to discuss some of the properties of Equation (7). We expect that the own attribute price marginal estimate is positive $\phi _{z_iz_i}$ = ∂Gi / ∂z i > 0, this flows from the convexity assumption of the total cost function and suggests that at the profit maximizing position producers operate on a positively sloped marginal cost curve for the attribute (see, e.g., Palmquist (Reference Palmquist1989, p. 25)). Theoretically, the cross marginal attribute estimates (∂Gi / ∂z j) are difficult to sign a priori. One possibility is cross attribute effects may also reflect the increased marginal costs of the production of an attribute, as the use of other attributes are increased and hence $\phi _{z_iz_j}$
 = ∂Gi / ∂z j > 0. For example, Witte, Sumka, and Erekson (Reference Witte, Sumka and Erekson1979, p. 1168), suggest that their finding that an increase in dwelling size produces an increase in the marginal offer price for dwelling quality simply reflects the greater costs required to produce better dwelling quality as the size of a dwelling increases. Similarly, Thomas (Reference Thomas1993, p. 668) for the motor carrier industry, suggests the estimated higher marginal offer price of service intensity as a result of higher performance, reflects that higher service intensity becomes more costly as performance increases. For non-attribute-related regressors contained in Y 2, the nature of the supply shifter will determine its impact on marginal offer prices.
It will prove instructive to comment on the role that M (the number of units of the good produced) plays in previously estimated marginal offer functions. The interpretation of estimates for the impact of M on $\phi _{z_i}$ typically relates to a discussion of economies of scale, which may or may not be consistent with the original Rosen (Reference Rosen1974) producer framework. For example, Witte, Sumka, and Erekson (Reference Witte, Sumka and Erekson1979) estimate a negative impact for the number of units owned by a landlord for both dwelling quality and dwelling size marginal prices and suggest this implies economies of scale in the production of houses and quantity discounts. While Thomas (Reference Thomas1993) finds that quantity is largely unimportant and statistically insignificant in various marginal offer models for the motor carrier industry and concludes this implies firms are producing quality in the constant returns of scale range. In general, these interpretations effectively view M as a supply shifter identifying differences among firms in terms of their scale of operation.
III. Hedonic Wine Price Models
In the hedonic wine pricing literature, it appears most studiesFootnote 3 have only estimated the first stage hedonic price function, using Equation (4). Outreville and Le Fur (Reference Outreville and Le Fur2020) provide a classification and summary description of most previously estimated hedonic wine price models and point to a vast array of variables employed in first stage hedonic wine price functions that include weather/climate, soil/terroir, grape region of origin/appellation, grape varieties, public information (including label information and expert ratings), and the wine's age. Outreville and Le Fur (Reference Outreville and Le Fur2020) further classify some studies that suggest the supply of wine impacts price through the use of variables such as producer size or quantity produced in hedonic price functions. An important issue is that some of these previous studies have not made an explicit distinction between z (attributes) and Y 2 (supply shifters) and have included both variable types in hedonic price functions.
The Rosen (Reference Rosen1974) framework suggests, for a given distribution of consumers (Y 1) and producers (Y 2), attributes (z) consist of variables, which influence the utility of consumers and the production costs of producers, in the sense bid and offer functions kiss to determine the market hedonic price function. For example, consider an improvement in a wine's quality (however measured); this will increase a consumer's utility (increasing their bid price) but will also increase the costs of producing the wine for the producer (increasing their offer price). As a consequence, the kiss between bid and offer functions (across Y 1 and Y 2) occurs at higher levels of wine quality resulting in a positive marginal price for wine quality. This occurs not because of changes in variation among consumers (Y 1) and producers (Y 2) but because of how wine quality enters the typical consumer's utility function and producer's cost function. To this extent, most variables employed in hedonic wine functions can be justified as attributes as they influence the utility and costs of the representative consumer and producer.
If the Rosen framework is adopted, however, the quantity of the wine produced and producer size is producer specific and as such should be excluded from Equation (4) and only employed as Y 2 in estimating a marginal offer function. Outreville and Le Fur (Reference Outreville and Le Fur2020) list 11 papers that employ the quantity of the wine produced and six studies that employ some measure of producer size in hedonic price functions. In nearly every study, a negative relation between quantity (or producer size) and the price is estimated, and arguments about economies of scale are offered as interpretations.
Several counterarguments, however, have been offered for the inclusion of producer size in Equation (4). For example, Oczkowski (Reference Oczkowski2016a) argues the production from small producers may have some “rarity, scarcity, collectability, exclusivity and cult status” (p. 45) consumer desirable value and hence producer size is included in the price function because it appears in the typical consumer's utility function. Alternatively, the perfect competition assumption is said to be violated, and Rosen's framework is abandoned as some production levels for individual producers are too large, and some aspects of imperfect competition price making occur. Both these arguments are typically not supported by any explicit theoretical development and are offered as ad-hoc justifications for including quantity and producer size in hedonic price functions.
The criticism of the use of producer-specific variables directly in hedonic price functions also applies to the use of producer fixed effects in price models as they control for differences among producers, which are supply shifters rather than attributes. A similar criticism could be made to hedonic price functions where consumer-specific characteristics are included in first-stage models. However, models that employ different consumer characteristics to identify different market segments for wine (Caracciolo and Furno, Reference Caracciolo and Furno2020) may be theoretically justified using a modified Rosen theoretical framework for different market segments (Baudry and Maslianskaia-Pautrel, Reference Baudry and Maslianskaia-Pautrel2016).
IV. Data and the Hedonic Wine Price Function
We consider Australian produced wine sold in different countries as the multi-market data set. Effectively, the same product (Australian wine) is sold in a variety of countries and it is postulated consumers across these countries have different tastes and preferences. In total value terms, Australia is the fourth largest exporter of wines in the world (OIV, 2019). In terms of the total export value of bottled wines, the major export markets Australia serves are China (including Hong Kong and Macau), the United States, and the United Kingdom (Wine Australia, Reference Australia2019a).
The database employed to collect information on the main characteristics of wines is James Halliday's Australian Wine Companion (AWC) (https://www.winecompanion.com.au/). The AWC provides expert quality ratings for approximately 9,000 wines each year. The AWC provides the most authoritative and comprehensive assessment of Australian wines and has been extensively used in hedonic price studies, including Schamel and Anderson (Reference Schamel and Anderson2003) and Oczkowski and Pawsey (Reference Oczkowski and Pawsey2019). Using the AWC as the sampling frame, data on market prices is accessed from wine searcher (https://www.wine-searcher.com/). Average retail market prices were collected for Australian produced wines available for sale during January 2020 from wine merchants located and selling to consumers in four countries: Australia, Hong Kong, the United States, and the United Kingdom.Footnote 4 The specific criteria employed for wine sample inclusion is (1) the vintage of the wine is quality rated in the AWC (2020 edition); (2) it is sold by at least three retailers in the country; (3) it is priced less than AUD$500 (to avoid outliers); and (4) it is rated by at least ten Vivino (www.vivino.com) consumer raters (to be employed as an instrument for estimation). To capture the notion of different consumers purchasing similar Australian wines, wines sold in Australia are only included in the analysis if they are available in at least one other country and meet all four sample inclusion criteria. If all wines only sold in Australia were included in the sample, thousands of Australian wines would be part of the sample leading to too many dissimilar wines across countries and the dominance of Australian consumer preferences. The sample of wines is outlined in Table 1. Some noteworthy features include: 48 wines meet all four inclusion criteria for all four countries; the largest wine group occurs with the same 159 wines sold in both Australia and the United Kingdom only. In total, there are 1,297 observations, with most wines sold in Australia (496) and the least in the United States (186).Footnote 5
Australian Produced Wines Sample: Retailer Locations

Notes: Number of wines sold listed. AUS: Australia; UK: United Kingdom; HK: Hong Kong; US: United States.
For the hedonic price function we employ a standard specification:

where Price is the average market retail priceFootnote 6 measured in $AUD, all non-Australian prices are converted to $AUD using the average of daily exchange rates for January 2020 (https://rba.gov.au/); Quality Rating is the expert rating score out of 100 from the AWC; Age Years is the difference between 2019 and the year of grape harvest; Wine Variety is a series of dummy variables reflecting the variety employed; and Wine Region is a series of dummy variables reflecting the region from where the grapes are sourced.
The use of expert quality ratings is a dominant feature of many hedonic wine studies. Oczkowski and Doucouliagos (Reference Oczkowski and Doucouliagos2015) have identified more than 40 studies that have employed expert ratings to explain the price. Expert ratings might be viewed as an average measure of consumer preferences (Costanigro, McCluskey, and Goemans, Reference Costanigro, McCluskey and Goemans2010) or as providing opinion leadership for consumers. Both arguments imply that ratings potentially reflect consumer preferences for higher-quality wines. Expert ratings may also capture the higher costs in producing better quality wines, such as the use of better quality grapes or new oak barrels for maturation. Further, in the Australian context, Oczkowski (Reference Oczkowski2016c) demonstrates how expert ratings may also capture the indirect effects of annual weather variations or vintage effects on prices.
Age years capture any consumer preferences for aged wines and the additional costs of maturation and storage for older wines. To control the sample design, we limited the analysis to five major single varieties where at least ten wines are available in each of the four designated countries. The identification of wine regions was based on Australian geographical indications (GIs) and dummy variables defined if at least ten sampled wines in each country existed. For wines not classified to a main region, two variables were employed, wines sourced from a cool climate (long term growing degree days (GDD) less than 1,668) and those from a warm climate (GDD = 1,668 or greater), see Hall and Jones (Reference Hall and Jones2010). Both wine variety and region capture consumer preference and cost of production features for these wine characteristics.Footnote 7
Summary sample statistics for the entre sample of wines from all four countries are provided in Table 2. The sample comprises a wide variety of different priced and quality wines. Prices range from less than $9 to more than $350; the mean price of $52 indicates that mainly premium wines dominate the sample. The median price of $39 indicates a highly skewed distribution. Quality scores vary accordingly, from a low of 84 to a high of 99 and an average of 93. The age of wines varies from one to seven years. The most dominant varieties are shiraz (38.5%), chardonnay (20.4%), and cabernet sauvignon (16.9%). The main wine regions are different region cool climate wines (31.2%), Barossa Valley (16.1%), and Margaret River (14%). Wines available in Australia make up (38%) of the sample, the United Kingdom (27%), Hong Kong (20%), and the United States (14%).
Summary Statistics

Notes: N = 1,297 covering Australia (496), United Kingdom (355), Hong Kong (260), and United States (186).
The choice of functional form for the hedonic price function has commanded considerable attention in the literature (e.g., Cropper, Deck, and McConnell, Reference Cropper, Deck and McConnell1988). We explicitly consider five commonly employed functions described in Table 3 and choose among them using theoretical and empirical considerations. Rosen (Reference Rosen1974) theoretically questions the use of the linear specification as it implies the possible repacking of a good using different attribute contributions in non-meaningful ways. Further, the linear specification implies a constant marginal price for the attribute. For marginal offer function estimation, this implies marginal prices take on as many values as there are distinct markets, in our case, only four. Rasmussen and Zuehlke (Reference Rasmussen and Zuehlke1990) point to the theoretical limitations of the log-linear specification. For the log-linear specification, marginal attribute prices are just product prices scaled by different constants for each market. This is possibly too restrictive. The other three forms (log-log, quadratic, and log-quadratic) are more theoretically attractive as marginal prices also explicitly depend on attribute levels and can either be increasing or decreasing in attribute levels.
Hedonic Functional Forms

Notes: P = price, X 1 = quality rating, X 2 = age years. Dummy variables for variety and region only enter as linear terms and each equation contains a constant and error term.
The RESET specification test has been found to usefully discriminate among various linear and log specifications (Godfrey, McAleer, and McKenzie, Reference Godfrey, McAleer and McKenzie1988). RESET tests for the five functional forms and four markets are presented in Table 4. The log-quadratic specification is not rejected for any country, while the log-linear specification is not rejected for two of the four markets. The linear, log-log, and quadratic specifications are all rejected by the RESET test, with the log-log specification being the most strongly rejected. Based on the RESET tests, the log-quadratic form is the preferred specification and is highlighted later with references made to the results from other functional forms.Footnote 8
Hedonic Price Functions: RESET

Notes: RESET is the robust Ramsey specification error test using the squared predictions and t statistics. ***, **, and * denotes statistically significant at the 1%, 5%, and 10% levels, respectively.
An important issue for the accurate identification of the marginal offer (cost) function is the existence of separate, distinct price functions across markets, as illustrated in Figure 1. Chow tests are presented in Table 5 to examine whether the estimated parameters are statistically the same across the four markets using the log-quadratic form. Pairwise market comparisons indicate that parameters are statistically different among all markets except for the United Kingdom and the United States. Similar results are obtained for the other functional forms. In summary, the Chow tests possibility point to sufficiently significant differences in parameters across markets to justify the multi-market estimation of the marginal offer function.
Hedonic Price Functions: Chow-Tests

Notes: Chow Test employs cluster robust (by wine_id) standard errors.
***, **, and * statistically significant at the 1%, 5%, and 10% levels, respectively.
V. Results
The estimates for the first stage hedonic price function (Equation (4)) for the log-quadratic specification and each of the markets is presented in Table 6. There is some variability in quality rating and age year effects across markets. The proportionate marginal impact of quality on prices is largest for Australia (0.132) and smallest for the United Kingdom (0.089). For age years, the United States has the largest proportionate price impact (0.354); Hong Kong (0.234) has the lowest. For varieties, chardonnay and pinot noir have the largest positive impact on prices, and cabernet sauvignon has the largest negative impact on prices.Footnote 9 For regions, Barossa Valley and Yarra Valley have the largest positive price impacts, and wines from Margaret River and other warm climate regions have the largest negative price impacts. Once again, the price impacts for regions and varieties appear to differ across markets.
Hedonic Price Functions: Log-Quadratic Form

Notes: ***, **, and * denotes statistically significant at the 1%, 5%, and 10% levels, respectively. Robust t-ratios reported in parentheses.
Summary statistics for the estimated marginal prices using Equation (5) and Table 3 for the log-quadratic form for all four markets are presented in Table 7. Statistics for marginal prices are provided for quality rating, age years, and a representative variety (chardonnay) and region (Barossa Valley). For all countries combined, the sample mean marginal price of age years ($14.18) is double that of quality ratings ($7.06). These values are not directly comparable given their different units of measure. In terms of a sample standard deviation increase, the mean marginal price of age years is $13.70, which is less than the mean marginal price of quality $22. Chardonnay ($6) and Barossa Valley ($5.50) have approximately equal mean marginal prices.
Marginal Prices Summary Statistics: Log-Quadratic Form

Some differences are apparent when comparing the marginal prices across countries in Table 7. In terms of sample means, for quality rating, marginal prices are highest for Hong Kong ($8.59) and lowest for the United Kingdom ($5.76). For age years, marginal prices are highest for the United States ($18.95) and lowest for Australia ($12.71). For Chardonnay, marginal prices are highest for the United States ($13.95) and lowest for Australia ($4.08). While for Barossa Valley, marginal prices are highest for the United Kingdom ($8.39) and lowest for Australia ($3.58). In general, there appear to be no systematic similarities across countries for the sample mean of marginal prices.
It should be noted that for quality rating and age years, the preferred log-quadratic form produces a number of negative marginal prices. The issue is more pronounced for quality ratings (5.0% of observations) than for age years (1.1%). For quality ratings, all negative marginal prices occur in the quality range of 84–87 for Australia, 85–88 for the United Kingdom, 84–89 for Hong Kong, and 84–86 for the United States. This suggests in these ranges, for some but not all wines, an increase in the quality rating reduces prices. The average negative marginal quality price is –$0.94, which is relatively small compared to the average positive marginal price of $7.48. In general, this implies that negative marginal quality prices occur relatively infrequently, are small in magnitude, and are limited to a narrow range at the lower end of the quality rating scale. In part, some negative marginal quality prices may be due to the inaccuracies of quality assessment made by raters and/or the mispricing of wines by producers with regard to quality. It is worth noting that more frequent negative marginal prices are produced by the quadratic form, that is, (12.0%) for quality ratings and (2.1%) for age years.Footnote 10
Given the marginal price estimates from Equation (5) (summarized in Table 7) and the attributes employed for Equation (4) (summarized in Table 6), to estimate the inverse supply or marginal offer function (Equation (7)), the supply shifters (Y 2) need to be specified. As previously indicated, the number of cases of the wine made or producer size, more generally, has been used extensively in previous hedonic price functions. Using Australian data and first stage hedonic price models, Oczkowski (Reference Oczkowski1994, Reference Oczkowski2016b) and Oczkowski and Pawsey (Reference Oczkowski and Pawsey2019) have identified a statistically significant inverse relation between producer size and price. In the Australian context, data for the number of cases produced for individual wines is “commercial in confidence” and not generally available; however, the size of the producer measured by the number of cases produced for all wines is available. ANZWID (2019) collects producer size data using ranges of cases produced, and this necessitates the use of categories for the producer size variable in estimation.
Oczkowski (Reference Oczkowski2016a) used several other producer-specific variables for analyzing producer fixed effects for Australian wine prices. These relate to producer experience, producer reputation, and the use of multi-brands by conglomerates. Producer experience is postulated to have possibly two opposing effects on wine prices (Roma, Di Martino, and Perrone, Reference Roma, Di Martino and Perrone2013). Older firms may be strategically better positioned to serve the market as they have a well-established production and market knowledge, while younger firms may be more dynamic and innovative and are better placed to explore new market opportunities. We also employ a producer rating measure from the AWC (where 5.5 points are given to a 5 red star winery), which captures the quality of the range of wines produced by an individual producer. This AWC producer rating has been used in previous Australian hedonic price models to identify a statistically significant relationship between price and producer reputation (Schamel and Anderson, Reference Schamel and Anderson2003; Oczkowski, Reference Oczkowski2016b; Oczkowski and Pawsey, Reference Oczkowski and Pawsey2019).Footnote 11 In part, it is suggested a higher producer reputation can command wine premiums from consumers who lack quality information. In Australia, a small number of large conglomerates exist that produce a range of wine brands. For our sample, only three exist that occur with any great frequency. Potentially, these conglomerates could employ the relation among brands to influence prices for individual brands (wineries). Producer experience and the use of multi-brands are based on data collected from ANZWID (2019). The summary statistics of the employed producer variables are provided in Table 2 and for dummy variables, estimates are interpreted as deviations from average marginal prices rather than a control group.
As suggested by Epple (Reference Epple1987), we employ IV to consistently estimate the marginal offer function. It is important to develop both theoretically justified and empirically supported instruments to generate accurate estimates for Equation (7). As instruments, we employ consumer quality ratings from Vivino (www.vivino.com); these are average ratings from wine consumers for the wine's vintage and are employed only if ten or more raters score the wine on the 0–5 scale. These alternative ratings have been shown to have similar explanatory power for explaining prices to AWC ratings (Oczkowski and Pawsey, Reference Oczkowski and Pawsey2019). The Vivino ratings can be viewed as an alternative quality rating and hence represents a suitable instrument. The employed approach is similar to that used in Oczkowski (Reference Oczkowski2001), where alternative quality rating measures are used as instruments in IV regressions.
We also employ a series of weather variables as instruments. Oczkowski (Reference Oczkowski2016c) shows for Australian wines, prices are better explained by quality ratings than weather fluctuations directly, and so the impact of weather on prices is better captured through quality ratings. We employ the following weather variables: harvest, growing season, and winter rain; temperature differential; growing season temperature; growing degree days and mean January temperature; with interactions for the late-ripening varieties. Both consumer ratings and weather information are not expected to have any additional explanatory power in determining prices over and above the attributes but are still likely to be highly correlated with the attributes and hence are potentially good candidates for instruments. As suggested by Palmquist (Reference Palmquist, Maler and Vincent2005), we also examined dummy variables identifying the separate markets and their use as interactions as instruments. These proved to be unsuccessful, invariably resulting in the failing of over-identification tests.
All first stage partial F statistics exceed ten and average 31.8, hence the instruments are not weak, and IV estimates are likely to lead to estimation efficiency improvements over ordinary least squares (OLS) (Cameron and Trivedi, Reference Cameron and Trivedi2005). Also, for the employed instruments, the Hansen J cluster robust over-identifying test (Table 8) indicates the specification and/or instruments are valid in the employed models. The cluster robust score test (Table 8) strongly rejects the assumption that the regressors are exogenous in all models, which also suggests the IV estimates are preferred to OLS estimates.
Inverse Attribute Supply: Log-Quadratic Hedonic Marginal Prices

Notes: ***, **, and * denotes statistically significant at the 1%, 5%, and 10% levels, respectively. N = 1,297. Dependent variable log-quadratic marginal hedonic prices. Linear functional forms. Cluster robust t-ratios (based on wine id) reported in parentheses. GR2 is the generalized R2 for IV estimated models. OIV is the Hansen J cluster robust over identifying test based on wine id. The exogeneity test is the cluster robust score test statistic, based on wine-id.
Standard linear inverse supply functions for four attributes using marginal prices from the log-quadratic first stage hedonic functional formFootnote 12 are presented in Table 8. As expected, the impact of the own attribute for quality rating is positive and significant, indicating the convexity of the total cost function and a positively sloped marginal cost curve. Specifically, for a one quality rating point increase, the marginal cost of producing a wine with an additional quality point is $2.20. For a sample standard deviation increase in quality, this implies an increase in the marginal cost of quality of $6.90. Age years is positive, indicating that for an additional age year, the marginal cost of producing additional quality increases by $4.50. For a sample standard deviation increase in age years, this implies an increase in the marginal cost of quality of $4.30, which is less than that for the standard deviation increase in quality. For varieties, the production of pinot noir and shiraz increase the marginal cost of quality, while cabernet sauvignon reduces the marginal cost. For regions, grapes from the Clare Valley increase the marginal cost of quality while those from the Barossa Valley reduce it the most.
The main impacts of producer size on the marginal cost of quality occur at the extremes. Compared to sample mean prices, an important negative impact (–$2.10) is estimated for very small producers (less than 20,000 cases) and a large important positive impact ($5.30) for very large producers (500,000 cases or over). For wine made by producers within these extreme sizes, marginal costs do not significantly differ from the sample mean marginal costs. These results run counter to the standard economies of scale argument used in previous wine studies where increased producer size leads to a fall in wine prices.Footnote 13
In terms of the other producer-related estimates for quality rating, it appears that younger producers are possibly less capable of achieving productive efficiency compared to mean sample prices and are associated with higher marginal costs. Conversely, older producers benefit from reduced marginal costs. Of the conglomerates, it appears wines from Pernod Ricard may incur higher marginal costs, even though the point estimate appears large ($6), it is not statistically significant. Producer rating does not appear to have any demonstrable impact on marginal costs, but this may be due to the narrow range of the employed measure.
In general, these results for quality rating and the log-quadratic form for marginal prices are similar to estimates from the log-linear and log-log forms for marginal prices. The same statistically significant results for producer size and producer experience occur. The results from the linear form for marginal prices are not particularly meaningful, given only four different values for marginal prices in the data set. Estimates from the quadratic model differ, however, from the log forms. The general tendency for a positive relation between producer size and marginal cost is still evident for the quadratic model. For quadratic marginal prices, producer experience and conglomerates are not important; however, a significant and negative impact is estimated for producer rating.
The estimates for the marginal prices of age years (Table 8) largely follow those for the quality rating. While a positively sloped marginal cost curve for age years is established, it is not statistically important. A higher-quality rating is associated with higher marginal costs for age years. In standard deviation terms, the increase in the marginal cost of age years for a change in age years is $2.50, which is much lower than the increase in the marginal cost of age years for a standard deviation change in the quality of $9.30. The positive cross attribute estimate for the marginal cost of age years given a change in quality ($3) establishes some symmetry with the positive impact of age years on the marginal cost of quality ($4.50). The negative relation between producer size and marginal attribute price for age years is still present at the extremes; however, the lower marginal costs of experienced producers are not statistically significant. For conglomerates, Accolade Wines has significantly lower marginal costs, while Pernod Ricard's point estimates remain high. These log-quadratic marginal price results are largely the same as the results from the log-linear and log-log marginal price forms. However, again the quadratic form produces different results: age years is highly significant and negative—this implies a downward sloping marginal cost curve; and no producer variables are statistically important, except for a negative impact for Accolade Wines. In part, the poor performance of the quadratic model may be due to its rejection by the RESET test.
The representative variety (chardonnay) and region (Barossa Valley) marginal price estimates in Table 8 are presented for illustrative purposes only. These regressors are dummy variables and hence strictly do not have the standard marginal price impetration but rather a displacement of offer prices occurs. Both equations suggest a statistically insignificant negative displacement occurs for own attributes. Quality rating and age years are both positive and significant, implying the displacement cost of using either chardonnay or grapes from the Barossa Valley increases as both the quality rating and age years increase. The inverse producer size impact at the extremes for costs still occurs; younger producers again have higher costs while a negative impact for Accolade Wines is estimated. Similar results again are found for the log-linear and log-log forms. For the quadratic form, neither quality rating nor age year is statistically significant; however, the inverse extreme producer size impact is identified for chardonnay only.
VI. Discussion and Conclusion
This paper presents inverse supply or marginal offer (cost) function estimates for wine using the second stage of the Rosen (Reference Rosen1974) hedonic framework. This is achieved by using data for similar wines across four different consumer markets. Unlike some previous hedonic price wine studies, producer-specific variables have been excluded from hedonic price estimation to generate marginal prices for the second stage analysis, where both attributes and producer-specific variables are employed. The results point to a series of interesting findings.
For the two meaningful continuously measured attributes of quality rating and age years, positive sloped marginal cost functions were identified with positive cross attribute effects. Results imply the additional costs of producing better quality wines are higher as a wine's age is increased, while the additional costs of producing older wines are higher as quality is increased.
The impact of producer size on marginal costs is found to be counter to expectations. Compared to sample mean marginal costs, for very small producers, marginal costs are lower, and for very large producers, marginal costs are higher. For producers, in-between these extremes marginal costs are not appreciably different from the sample mean costs. These results are mainly due to the two-stage method employed as direct hedonic function estimation with producer size establishes the standard inverse size relation with price for this data set. A number of explanatory comments can be made.
First, producer size estimates from hedonic price functions relate to the change in the product price and not to the change in marginal attribute price/cost, and hence estimates are not directly comparable.
Second, in Australia, a wine equalization tax (WET) of 29% of the wholesale value is imposed on wine. A rebate is available to wine producers to claim back this tax up to a fixed amount, historically $500,000 and since 2018 $350,000. As a consequence, many small producers do not pay any WET, but large producers may pay an average WET close to the 29% rate (Fogarty and Jakeman, Reference Fogarty and Jakeman2011). This gives small producers a distinct comparative cost advantage compared to large producers and hence may in part explain the finding of a direct relation between producer size and marginal costs. In this context, the WET rebate possibly supports some small producers who may otherwise not operate; this raises some policy issues for the government.
Third, the standard economies of scale argument may be more directly relevant when using quantity sold as the size measure. In contrast, the use of producer size needs to recognize the existence of an entire product line where the quality sold for a specific high-quality wine (typical of our data set) may be very small for a large producer. In general, very small producers tend to employ their own estate-grown grapes, and in the Australian context, over half of the small producers use outside contract winemaking (ACCC, 2019). As a consequence, the higher costs associated with small-scale production may be somewhat mitigated as many producers avoid the outlay of large capital costs and the need to cover significant fixed costs associated with small-scale winemaking. In contrast, very large producers need to efficiently develop skills in producing both high volume low-quality and low volume high-quality wines, and the economies of scale gained from low-quality production may not always translate to high-quality wines.
Finally, the unexpected producer size results may be the outcome of the inappropriate perfect competition assumption of the Rosen (Reference Rosen1974) framework, and that producer size is more appropriately specified directly in the hedonic price function reflecting elements of price making behavior. In the Australian context, over 2,500 winemakers exist (ACCC, 2019); the largest four conglomerates produce approximately 28% of total output (IBISWorld, 2020). IBISWorld classifies the Australian wine production industry as being highly competitive. The bulk of wine production, however, occurs at the low price points, with only approximately 17% of bottled wine sales occurring for wines above $15, which reflects our data set (Wine Australia, Reference Australia2019b). In other words, for our premium wine data set where relatively low volumes are produced by more than 2,000 producers, the influence of large producers may not be particularly strong; however, the existence of market power impacting prices should not be ruled out.
Some of the other results are also worthy of comment. We have found older, more established producers are capable of producing attributes at lower marginal costs. Effectively, well-established producers may be further down the learning curve and hence able to produce wines at lower marginal costs for a wine's quality and age. While, in contrast to some hedonic price function estimates, we do not find producer reputation to have any noticeable impact when employing marginal prices.
In conclusion, as this paper appears to provide the first application of the two-stage Rosen (Reference Rosen1974) framework for wines, it is important to see if these results gained for Australian wines translate to wines produced by other countries where wines are also sold in different markets. In particular, applications of the methodology to countries where quantity sold data for each wine are available could be usefully performed.



