1. Introduction
1.1. Extreme value theory
Even though outliers are often disregarded in statistical models, an understanding of rare and extreme events plays a central role in a variety of situations. An important example, which is analyzed in more detail later, is the occurrence of coincidences for big earthquakes.
It is well known (see [Reference Gnedenko14]) that for independent and identically distributed (i.i.d.) random variables  $X_1,\ldots,X_n$
with common distribution function F(x), in order for a law of large numbers for
 $X_{(n)}=\max_{1\leq i\leq n} X_i$
to hold, it is necessary and sufficient for the
 $X_i$
to have a slowly varying tail. More precisely,
there exists  $m_n$
such that
 $X_{(n)} - m_n\longrightarrow 0 $
in probability if and only if
 \begin{align}\lim_{x\rightarrow +\infty }\frac{1-F(x+y)}{1-F(x)}= 0, \qquad \text{for all} \ y > 0.\end{align}
In the case that the above condition holds, necessary and sufficient conditions for the existence of a limiting distribution for  $X_{(n)}$
, after rescaling, are also standard in the literature, and the limits have been widely studied. For a survey on the subject, as well as generalizations and applications, the reader is referred to [Reference de Haan and Ferreira11,Reference Galambos13].
It is worth mentioning that (1) fails to capture the maxima of a variety of distributions. In particular, if the  $X_i$
only take integer values, the above condition cannot be satisfied, since for
 $0<y<1$
and
 $x\in \mathbb N$
the above limit is one. The goal of this paper is to investigate the limiting behavior of
 $X_{(n)}$
when condition (1) is not satisfied.
In this paper, ‘clustering’ refers to the extent to which  $X_{(n)}$
fails to satisfy a law of large numbers. Roughly speaking, it will be shown that the decay of the mass function determines the size of the cluster. As an instance, for Poisson random variables (whose mass function decays faster than geometrically)
 $X_{(n)}$
clusters at two values with high probability, while for negative binomial random variables (whose mass function has a geometric decay)
 $X_{(n)}$
is spread onto all integers with high probability.
The first rigorous result in this direction is due to Anderson [Reference Anderson3]. He classified the cluster size for maxima of discrete random variables in terms of their tails. A further analysis was carried out in [Reference Sethuraman18], where lower-order statistics were taken into account, as well as in [Reference Athreya and Sethuraman6], where the authors studied the number of ties.
The first result of this paper completes the discussion given in [Reference Anderson3].
Theorem 1. Let  $X_1,\ldots,X_n$
be i.i.d. discrete random variables with common distribution F. Suppose the support of F is not bounded from above, and that, for some
 $\gamma\in[0, 1]$
,
 \begin{equation}\lim_{n\rightarrow +\infty}\frac{1-F(n+1)}{1-F(n)}=\gamma.\end{equation}
Then there exist two sequences  $\{m_n\}\subset \mathbb N, \{p_n\}\subset [0, 1]$
such that
•
 $\gamma=0 \Rightarrow \mathbb{P}(X_{(n)}=m_n)\sim p_n$
,
$\mathbb{P}(X_{(n)}= m_n+1)\sim 1-p_n$
;
•
$\gamma\in (0,1) \Rightarrow \text{for all} \ x\in\mathbb Z$
,
$\mathbb{P}(X_{(n)}\leq m_n+x)\sim p_n^{\gamma^x}$
;•
$\gamma=1 \Rightarrow \text{for all} \ x\in\mathbb Z$
,
$\mathbb{P}(X_{(n)}\leq m_n+x)\sim p_n$
.


In the first case, there exists an increasing sequence  $\{N_i\}_{i\in \mathbb N}\subset \mathbb N$
, with
 $N_i-N_{i-1}\rightarrow \infty$
, such that, for
 $n\rightarrow \infty, n\not\in \{N_i\}$
, we have
 $p_{n+1}\leq p_n$
and
 $p_{n+1}-p_n \rightarrow 0$
.
Remark 1. The last part of Theorem 1 is where the expression ‘oscillations’ originates. Indeed, a more informal way of interpreting the result is the following: if the endpoints of [0, 1] are identified to obtain a circle (and the orientation on [0, 1] induces a counterclockwise orientation on the circle), then  $p_n={\rm e}^{-2\pi i q_n}$
, where the sequence
 $\{q_n\}$
is increasing and satisfies
 $q_n-q_{n-1}\rightarrow 0$
,
 $\limsup q_n=+\infty$
. In words, under this identification the sequence of the
 $p_n$
will move clockwise on the circle with smaller and smaller steps, winding around the origin infinitely many times.
From a probabilistic point of view, in the case  $\gamma=0$
the sequences
 $\{p_n\}, \{1-p_n\}$
represent, for n large, the relative frequency of
 $X_{(n)}=m_n, X_{(n)}=m_{n+1}$
respectively. Therefore, a histogram of many samples from
 $X_{(n)}-m_n$
will not converge to a given shape, it will instead consist of two adjacent columns whose heights oscillate between 0 and 1. Moreover, for every fixed
 $p\in [0, 1]$
, it is possible to find a subsequence along which the height of the left column will converge to p (and correspondingly, the height of the right one will converge to
 $1-p$
). This again justifies the term ‘oscillations’.
Another natural question concerns the number of times the maximum is expected to occur in a sequence of independent and identically distributed samples from a discrete distribution. This question is only addressed here in the case  $\gamma=0$
, where the result is the following.
Theorem 2. Let  $X_1,\ldots,X_n$
be i.i.d. with common distribution F such that
 \begin{align*}\lim_{n\rightarrow +\infty}\frac{1-F(n+1)}{1-F(n)}=0.\end{align*}
Then, for  $p_n, m_n$
as in Theorem 1,
 \begin{equation}\mathbb{P}({at\ least\ k\ ties\ for\ the\ maximum})\sim p_n+1-p_n\sum_{j=0}^{k}\frac{\ln^{\,j}\Big(\frac{1}{p_n}\Big)}{j!}.\end{equation}
As a by-product, the probability of having no ties is given by  $-p_n\ln p_n$
, which thus oscillates between 0 and
 $\frac{1}{{\rm e}}$
.
In the proof of the theorem, it will be clear that in order to determine the number of ties, we first flip a  $p_n$
-biased coin to determine whether the maximum
 $X_{(n)}$
will assume the value
 $m_n$
or
 $m_{n}+1$
. If the former happens, then we expect, for all fixed k, to have at least k ties with high probability as n gets larger; if the latter happens, the number of ties is Poisson distributed with parameter
 $\ln\big(\frac{1}{p_n}\big)$
. In the case where
 $p_n = 0$
or
 $p_n = 1$
for some n, the right-hand side of (3) equals one (according to the convention
 $0\ln 0\,:\!=0$
). Therefore, along subsequences of
 $\{p_n\}$
converging to 0 (resp. 1), the kth-order statistic
 $X_{(n-k)}$
for any fixed k will be
 $m_n$
(resp.
 $m_n + 1$
) with high probability, so that an arbitrarily large number of ties is expected.
Now, suppose that the  $p_n$
-biased coin gives
 $X_{(n)}=m_n$
. It is interesting to determine how many ties are expected to occur, letting k grow with n. This is answered by the following.
Theorem 3. Let  $X_1,\ldots,X_n$
be as before, and let
 $c>0$
be fixed. Then there exists a sequence
 $\{z_n\}$
such that
• if
$c < 1$
,
$\mathbb{P}(X_{n-cz_n}>m_n-1)\rightarrow 1$
;• if
$c > 1$
,
$\mathbb{P}(X_{n-cz_n}>m_n-1)\rightarrow 0$
.




In other words, there is a phase transition for the number of ties in the top position, the critical point being  $z_n$
. It is worth mentioning that
 $z_n$
oscillates as well.
1.2. Multinomial allocations and their Bayesian counterparts
In order to adapt all previous results to the case of dependent random variables, one approach is to use Poissonization. This standard technique has been widely exploited in a variety of situations: various combinatorial problems in probability [Reference Chatterjee, Diaconis and Meckes9], cycle structure [Reference Sheep and Lloyd19] and longest increasing subsequence [Reference Aldous and Diaconis2] of random permutations, ensemble equivalence in statistical mechanics [Reference Zabell21], and many others.
When the randomization leads to an exponential family, from which the original distribution can be obtained by means of conditioning with respect to a sufficient statistic, the results belong to conditioning limit theory. The case where the sufficient statistic is given by  $\sum i x_i$
is treated in [Reference Arratia, Barbour and Tavaré5], while here the focus will be on the sum, already considered in [Reference Diaconis and Holmes12].
In the following, two different allocation problems are considered. Suppose k balls are dropped into n boxes, and we denote the box counts by  $Y=(Y_1,\ldots,Y_n)$
. If different balls are dropped independently, Y has a multinomial distribution; if the probabilities of falling into a certain box are unknown, it is natural to consider a Dirichlet mixture of multinomial distributions.
The starting point is the conditional representation
 \begin{equation*}\mathbb{P}(\textrm{max} (Y_1,\ldots,Y_n)\in A)=\mathbb{P}\Bigl(\textrm{max} (X_1,\ldots,X_n)\in A \Big| \sum X_i=k\Bigr).\end{equation*}
In the case when Y is multinomial with parameters  $(k,p_1,\ldots,p_n)$
, the
 $X_i$
can be chosen in such a way that
 $X_1\sim \mathrm{Poi}(\lambda p_1)$
, …,
 $X_n\sim \mathrm{Poi}(\lambda p_n)$
for every
 $\lambda$
. If the Y are a mixture of multinomial distributions with symmetric Dirichlet kernel with hyperparameter r, then the
 $X_i$
can be chosen to be in the negative binomial family with parameter
 $\mathrm{NB}(r,p)$
. Bayes’ theorem then implies that
 \begin{equation}\mathbb{P}(\textrm{max} (Y_1,\ldots,Y_n)\in A)=\mathbb{P}(\textrm{max} (X_1,\ldots,X_n)\in A)\frac{\mathbb{P}\big(\sum \tilde X_i=k\big)}{\mathbb{P}\big(\sum X_i=k\big)},\end{equation}
where  $\tilde X_i$
is the law of
 $X_i$
conditioned on
 $\max(X_1,\ldots,X_n)\in A$
. Notice that all three terms on the right-hand side only involve independent random variables. The idea is that, under the appropriate choice of the
 $X_i$
on the right-hand side, the ratio appearing there is approximately one, so that
 \begin{align*}\mathbb{P}(\textrm{max} (Y_1,\ldots,Y_n)\in A)\sim \mathbb{P}(\textrm{max} (X_1,\ldots,X_n)\in A).\end{align*}
Notice that in general this does not require either side to have a limit: the only important aspect is that the distribution of  $\max (X_1,\ldots,X_n)$
and
 $\max (Y_1,\ldots,Y_n)$
merge together, and then everything about the former (e.g. convergence, limit points, etc.) carries over to the latter. For different notions of merging, corresponding to different notions of distance between
 $f_n(X_1,\ldots,X_n)$
and
 $f_n(Y_1,\ldots,Y_n)$
, the reader is referred to [Reference D’Aristotile, Diaconis and Freedman1].
The main results of this paper for the allocation models are the following.
Theorem 4. Let  $(Y_1,\ldots,Y_n)$
be multinomial with parameters
 $\big(k,\frac{1}{n},\ldots,\frac{1}{n}\big)$
. Suppose that
 $\lambda=\frac{k}{n}$
is fixed. If
 $m_n, p_n$
are defined as in Theorem 1 for F the distribution function of a Poisson with parameter
 $\lambda$
, then we have
 \begin{align*}\mathbb{P}(Y_{(n)}=m_n)\sim p_n, \qquad \mathbb{P}(Y_{(n)}=m_n+1)\sim 1-p_n.\end{align*}
Theorem 5. Let  $(Y_1,\ldots,Y_n)$
be multinomial with parameters
 $\big(k,\frac{1}{n},\ldots,\frac{1}{n}\big)$
. Let
 $\lambda=\frac{k}{n}$
be fixed. If
 $m_n, p_n, z_n$
are defined as in Theorems 2 and 3 for F the distribution function of a Poisson with parameter
 $\lambda$
, then we have:
• as
$n\rightarrow +\infty$
,
\begin{align*} \mathbb{P}(\text{at least \textit{t} ties at $Y_{(n)}$})\sim p_n+1-p_n\sum_{j=0}^t \frac{\ln^{\,j}\Big(\frac{1}{p_n}\Big)}{j!} ; \end{align*}
• as
$n\rightarrow +\infty$
,
\begin{align*}&\text{if } c<1, \quad \mathbb{P}(X_{n-cz_n}>m_n-1)\rightarrow 1, \\&\text{if } c>1, \quad \mathbb{P}(X_{n-cz_n}>m_n-1)\rightarrow 0.\end{align*}


Theorem 6. Let  $(Y_1,\ldots,Y_n)$
be a (symmetric) Dirichlet mixture of multinomials with parameters (k, r). Let n, k be chosen in such a way that for some fixed p,
 $\frac{rp}{1-p}=\frac{k}{n}$
is fixed. If
 $m_n, p_n$
are defined as in Theorem 1 for F the distribution function of a negative binomial random variable with parameters (r, p), then, for every
 $x\in \mathbb Z$
,
 \begin{align*}\mathbb{P}(Y_{(n)}\leq m_n+x)\sim p_n^{\gamma^x}.\end{align*}
Borrowing language from statistical mechanics, in the multinomial allocations problem (as well as in its Bayesian version), several features involving the top-order statistics can be equivalently studied in the microcanonical and canonical picture [Reference Campenhout and Cover8].
2. The independent case
Let  $X_1,\ldots, X_n$
be i.i.d. random variables with common distribution F, satisfying assumption (2). Denote by
 $\mathcal F\,:\!=1-F$
the tail of the distribution. A real extension
 $\mathcal G$
of
 $\mathcal F$
will be considered, with the properties
•
$\mathcal G(n)=\mathcal F(n)$
for
$n\in \mathbb Z$
;•
$\mathcal G$
is continuous;•
$\mathcal G$
is decreasing;•
$\mathcal G$
is log-convex.


Such an extension always exists; for example, the log-linear one provided by Anderson in [Reference Anderson3] works (yet, sometimes, this is not the most natural one, as in the Poisson case). Notice that the assumption of log-convexity ensures, for example, the existence of
 \begin{align*}\lim_{x\rightarrow +\infty}\frac{\mathcal G\big(x+\frac{1}{2}\big)}{\mathcal G(x)},\end{align*}
since the function  $x\rightarrow \frac{\mathcal G\big(x+\frac{1}{2}\big)}{\mathcal G(x)}$
is decreasing. Combined with (2), we have
 \begin{equation}\lim_{x\rightarrow +\infty}\frac{\mathcal G\big(x+\frac{1}{2}\big)}{\mathcal G(x)}=\sqrt{\gamma}.\end{equation}
In a similar way, because  $\mathcal G$
is continuous and log-convex, for every
 $\varepsilon\in (0,1)$
we have
 \begin{equation}\lim_{x\rightarrow +\infty}\frac{\mathcal G(x+\varepsilon)}{\mathcal G(x)}=\gamma^{\varepsilon}.\end{equation}
Let  $x_n$
be a solution to
 $\mathcal G(x_n)=\frac{1}{n}$
. Owing to the continuity and monotonicity of
 $\mathcal G$
, such a solution exists and it is unique. Set
 $m_n$
to be the floor of
 $x_n+\frac{1}{2}$
. By definition,
 $m_n\in \big[x_n-\frac{1}{2},x_n+\frac{1}{2}\big]$
. Also define
 \begin{equation}\theta_n\,:\!=\frac{\mathcal G(m_n)}{\mathcal G(x_n)}, \qquad p_n\,:\!={\rm e}^{-\theta_n}.\end{equation}
Finally, let
 \begin{align*}z_n\,:\!=-\ln \Bigg(\frac{\mathcal G(m_n-1)}{\mathcal G(x_n)}\Bigg).\end{align*}
Remark 2. While the above definitions of  $m_n$
,
 $x_n$
,
 $p_n$
, and
 $z_n$
depend on the particular choice of
 $\mathcal G$
, all the results stated in the above theorems are equivalent for all such choices.
Consider the case  $\gamma\in (0,1)$
in Theorem 1, the other results being analogous. Let
 $\mathcal G$
and
 $\mathcal{\tilde G}$
be two different extensions of
 $\mathcal F$
, and let
 $\tilde x_n, \tilde m_n, \tilde p_n$
be the quantities corresponding to
 $x_n, m_n, p_n$
, obtained by using the extension
 $\mathcal{\tilde G}$
instead. The first claim is that
 \begin{align*}x_n-\tilde x_n\rightarrow 0.\end{align*}
Indeed, first notice that the floor of both  $x_n$
and
 $\tilde x_n$
is the largest integer
 $t_n$
such that
 $\mathcal F(t_n)\geq \frac{1}{n}$
. Therefore,
 $x_n=t_n+\varepsilon_n$
and
 $\tilde x_n=t_n+\tilde \varepsilon_n$
, with
 $\varepsilon_n, \tilde \varepsilon_n\in [0, 1)$
. Suppose, toward contradiction, that along some subsequence
 $|\varepsilon_n-\tilde \varepsilon_n|\sim \varepsilon>0$
for some fixed
 $\varepsilon$
. In this case, applying (6) leads to
 \begin{align*}\mathcal F(t_n)\gamma^{\varepsilon_n}\sim \mathcal G(x_n)=\frac{1}{n}=\mathcal {\tilde G}(\tilde x_n)\sim \mathcal F(t_n)\gamma^{\tilde \varepsilon_n},\end{align*}
which in turn implies  $\gamma^{\varepsilon}=1$
in the limit, a contradiction.
Therefore, along subsequences of  $\{x_n\}$
(and thus
 $\{\tilde x_n\}$
, since
 $x_n-\tilde x_n\rightarrow 0$
) that are bounded away from half-integers, the definition of
 $m_n$
and
 $\tilde m_n$
will eventually be the same, and consequently
 $p_n$
will eventually be the same (since
 $p_n$
depends on
 $\mathcal G$
only via
 $m_n$
) regardless of the choice of
 $\mathcal G$
.
Along subsequences of  $\{x_n\}$
(and
 $\{\tilde x_n\}$
) for which
 $x_n-\left \lfloor{x_n}\right \rfloor \rightarrow \frac{1}{2}$
, it may be the case that
 $m_n$
and
 $\tilde m_n$
, defined from
 $x_n$
and
 $\tilde x_n$
respectively, differ by one.
Without loss of generality, assume that along some subsequence  $m_n-x_n\rightarrow -\frac{1}{2}$
and
 $\tilde m_n-\tilde x_n\rightarrow \frac{1}{2}$
. In this case, combining (7) and (5), we obtain
 \begin{align*}p_n\sim {\rm e}^{-\frac{1}{\sqrt{\gamma}}}, \qquad \tilde p_n\sim {\rm e}^{-\sqrt{\gamma}}.\end{align*}
In particular, the use of the extension  $\mathcal {\tilde G}$
leads to the same asymptotic obtained by using
 $\mathcal G$
, since
 \begin{align*}\mathbb{P}(X_{(n)}\leq m_n+x)=\mathbb{P}(X_{(n)}\leq \tilde m_n-1+x)\sim {(\tilde p_n)}^{\gamma^{-1+x}}\sim {\rm e}^{-\gamma^{-\frac{1}{2}+x}}\sim p_n^{\gamma^x}.\end{align*}
Remark 3. The freedom in the choice of  $\mathcal G$
is not merely an abstract curiosity. As previously mentioned, there are cases (e.g. Poisson distribution) where a certain
 $\mathcal G$
can be obtained by appropriately replacing a sum with an integral (in the Poisson distribution case, an incomplete gamma function), and such
 $\mathcal G$
can be easily checked to be log-convex (for a classical discrete distribution, this often boils down to the log-convexity of the gamma function). In those cases, it is much easier to use such extensions in order to obtain numerical approximations for
 $m_n$
and
 $p_n$
, rather than using the artificial log-linear extension introduced by Anderson [Reference Anderson3].
2.1. Proofs of Theorems 1, 2, and 3
Proof of Theorem 1. Owing to the i.i.d. assumption, for all  $x\in\mathbb Z$
,
 \begin{align*}\mathbb{P}(X_{(n)}\leq x)&=\bigl(1-\mathcal F(x)\bigr)^n.\end{align*}
In the following, note that, for  $z>-1$
,
 \begin{equation}\frac{z}{1+z}\leq \ln(1+z)\leq z.\end{equation}
Thus, for every  $x\in \mathbb Z$
,
 \begin{multline}\mathbb{P}(X_{(n)}\leq x)=\bigl(1-\mathcal F(x)\bigr)^n=\biggl(1-\frac{\mathcal F(x)}{\mathcal G(x_n)}\frac{1}{n}\biggr)^n \in \biggl[\exp\bigg\{-\frac{\mathcal F(x)}{F(x)\mathcal G(x_n)}\bigg\}, \exp\bigg\{-\frac{\mathcal F(x)}{\mathcal G(x_n)}\bigg\}\biggr],\end{multline}
where the definition of  $\mathcal G(x_n)=\frac{1}{n}$
is used in the second equality, while the bounds are derived from (8) applied to
 $z=-\frac{\mathcal F(x)}{n\mathcal G(x_n)}$
(so that
 $1+z=F(x)$
).
It is convenient to split the proof into the two cases  $\gamma=0$
and
 $\gamma>0$
.
Case  $\gamma=0$
: The choice of
 $x=m_n-1$
leads to
 \begin{align*}\mathbb{P}(X_{(n)}\leq m_n-1)\leq \exp\bigg\{-\frac{\mathcal F(m_n-1)}{\mathcal G(x_n)}\bigg\} \leq \exp\bigg\{-\frac{\mathcal G\big(x_n-\frac{1}{2}\big)}{\mathcal G(x_n)}\bigg\}\rightarrow 0 ,\end{align*}
where the first inequality follows from the upper bound in (9) and the second follows from both the monotonicity of  $\mathcal G$
and that
 $m_n\in \big[x_n-\frac{1}{2}, x_n+\frac{1}{2}\big]$
. The last step is a consequence of the assumption
 $\gamma=0$
and equation (6). If
 $x=m_n+1$
, then the lower bound in (9) is attained and the very same argument leads to
 \begin{align*}\mathbb{P}(X_{(n)}\leq m_n+1)&\geq \exp\bigg\{-\frac{\mathcal G\big(x_n+\frac{1}{2}\big)}{\mathcal G(x_n)F(m_n+1)}\bigg\}\\&\rightarrow 1.\end{align*}
This result proves the clustering effect on the two values  $m_n$
,
 $m_n+1$
. In general, the same computations lead to
 \begin{align*}\mathbb{P}(X_{(n)}\leq m_n)\sim \exp\bigg\{-\frac{\mathcal G(m_n)}{\mathcal G(x_n)}\bigg\}=p_n,\end{align*}
from which the result
 \begin{align*}\mathbb{P}(X_{(n)}\leq m_n)\sim p_n, \qquad \mathbb{P}(X_{(n)}=m_n+1)\sim 1-p_n \end{align*}
follows. As for the last statement in the theorem, notice that, by the definition of  $x_n$
,
 \begin{align*}\frac{\mathcal G(x_{n+1})}{\mathcal G(x_{n})}=\frac{\frac{1}{n+1}}{\frac{1}{n}}\rightarrow 1.\end{align*}
Suppose, toward contradiction, that  $x_{n+1}-x_{n}\rightarrow \varepsilon>0$
along some subsequence. Owing to
 $(6)$
, the limit
 $\ell\,:\!=\lim_{n\rightarrow +\infty}\frac{\mathcal G(x_n+\varepsilon)}{\mathcal G(x_n)}$
exists, and it is equal to zero (thanks to the assumption
 $\gamma=0$
). Thus, necessarily,
 $x_{n+1}-x_{n}\rightarrow 0$
. By the continuity of
 $\mathcal G$
,
 \begin{align*}\mathcal G(x_n)-\mathcal G(x_{n+1})\rightarrow 0.\end{align*}
Define  $N_i$
as the increasing sequence of natural numbers for which
 $x_{N_i}\leq i+\frac{1}{2}$
,
 $x_{N_i+1}>i+\frac{1}{2}$
for all integers i. Consider
 $x_n$
for
 $n\not \in\{N_i\}_{i\in \mathbb N}$
, and recall that
 $m_n$
is the floor of
 $x_n+\frac{1}{2}$
. For such n, we have
 $m_n=m_{n+1}$
, and consequently
 $p_{n+1}\leq p_n$
(owing to the monotonicity of
 $\mathcal G$
and (7)), and
 $p_{n+1}-p_n\rightarrow 0$
(owing to the continuity of
 $\mathcal G$
). Finally, notice that
 $N_{i+1}-N_i\rightarrow \infty$
since
 $x_n\rightarrow +\infty$
,
 $x_{n+1}-x_n\rightarrow 0$
, which concludes the proof of this case.
Case  $\gamma>0$
: For all fixed
 $x\in \mathbb Z$
we have, owing to (9) and (2),
 \begin{align*}\frac{\mathcal F(m_n+x)}{\mathcal G(x_n)}\sim \frac{\mathcal F(m_n+x)}{\mathcal G(x_n)F(m_n+x)}\sim \frac{\mathcal G(m_n)\gamma^x}{\mathcal G(x_n)}.\end{align*}
Therefore, in this case
 \begin{align*}\mathbb{P}(X_{(n)}\leq m_n+x)&= \bigl(1-\mathcal F(m_n+x)\bigr)^n\\&\sim \exp\bigg\{-\frac{\mathcal G(m_n)}{\mathcal G(x_n)}\gamma^x\bigg\}\\&= p_n^{\gamma^x},\end{align*}
which concludes the proof (notice that if  $\gamma=1$
, we have
 $\gamma^x\equiv 1$
).
Proof of Theorem 2. First of all, notice that the assumption  $\gamma=0$
guarantees that
 $z_n\rightarrow +\infty$
. Moreover, since, by definition,
 $n\mathcal F(m_n-1)=z_n$
, and
 $m_n\rightarrow +\infty$
, it follows that
 $z_n=o(n)$
. Now, consider the binomial formula for the order statistics:
 \begin{equation}\mathbb{P}(X_{(n-k)}\leq x)=\sum_{j=0}^{k}{\left(\begin{array}{c}n\\j\end{array}\right)}[F(x)]^{n-j}[1-F(x)]^{\,j}.\end{equation}
If  $x=m_{n}-1$
, j is fixed, and
 $n\rightarrow +\infty$
, we have
 \begin{align*}{\left(\begin{array}{c}n\\j\end{array}\right)}\bigg(1-\frac{z_n}{n}\bigg)^{n-j}\bigg(\frac{z_n}{n}\bigg)^{j}\sim \frac{z_n^j}{j!}{\rm e}^{-z_n}\rightarrow 0.\end{align*}
When k is fixed, since there are only finitely many terms in (10) and each of these converges to 0, we conclude that
 \begin{equation*} \mathbb{P}(X_{(n-k)}\leq m_n-1)\rightarrow 0.\end{equation*}
Now fix  $p\in (0,1)$
, and look at a subsequence
 $p_{n}\rightarrow p$
(where for simplicity the
 $p_{n_k}$
subsequence was renamed
 $p_n$
). Then, since
 $\mathbb{P}(X_{(n)}>m_{n}+1)\rightarrow 0$
, along this subsequence,
 \begin{align*}\mathbb{P}(X_{(n-k)}=m_{n}+1)&\sim \mathbb{P}(X_{(n-k)}>m_{n})\\&=1-\sum_{j=0}^{k}{\left(\begin{array}{c}n\\j\end{array}\right)}\bigg(1-\frac{\theta_n}{n}\bigg)^{n-j}\bigg(\frac{\theta_n}{n}\bigg)^{j}\\&\rightarrow p\Bigg(\frac{1}{p}-\sum_{j=0}^{k} \frac{\ln^{\,j}\big(\frac{1}{p}\big)}{j!}\Bigg),\end{align*}
where we used that  $\mathcal F(m_n)=\frac{\mathcal F(m_n)}{\mathcal G(x_n)}\mathcal G(x_n)=\frac{\mathcal G(m_n)}{\mathcal G(x_n)}\Big(\frac{1}{n}\Big)=\frac{\theta_n}{n}$
.
Before moving on to the proof of Theorem 3, recall the incomplete gamma function
 \begin{align*}\Gamma(k,z)=\int_0^{z}t^{k-1}{\rm e}^t \, {\rm d} t.\end{align*}
Notice that for k an integer, integration by parts shows that
 \begin{equation}{\rm e}^{-z}\sum_{j=k}^{+\infty}\frac{z^{\,j}}{j!}=\frac{\Gamma(k+1,z)}{\Gamma(k+1)}.\end{equation}
To find asymptotics for  $\Gamma(k,z)$
, it is useful to recall the Laplace asymptotic formula (see, e.g., [Reference Anderson, Guionnet and Zeitouni4, Theorem 3.5.3]):
Theorem 7. (Laplace asymptotic formula.) Let S(x) be a smooth function on (a, b).
• If
$S'(x)<0$
for all
$x\in (a,b)$
, then
\begin{align*}\int_a^b{\rm e}^{-mS(x)}f(x) \, {\rm d} x=\frac{1}{m}\frac{1}{S'(b)}f(b){\rm e}^{-mS(b)}\bigg(1+O\bigg(\frac{1}{m}\bigg)\bigg),\qquad m \rightarrow +\infty.\end{align*}
• If S has a unique nondegenerate minimum
$x_0$
in (a, b), then
\begin{align*}\int_a^b{\rm e}^{-mS(x)}f(x) \, {\rm d} x=\sqrt{\frac{2\pi}{mS''(x_0)}}f(x_0){\rm e}^{-mS(x_0)}\bigg(1+O\bigg(\frac{1}{m}\bigg)\bigg),\qquad m\rightarrow +\infty.\end{align*}


Proof of Theorem 3. Using (10),
 \begin{align*}\mathbb{P}(X_{(n-cz_n+1)}>m_{n}-1)&=1-\sum_{j=0}^{cz_n-1}{\left(\begin{array}{c}n\\j\end{array}\right)}[F(m_n-1)]^{n-j}[1-F(m_n-1)]^{\,j}\\&=\sum_{j=cz_n}^{n}{\left(\begin{array}{c}n\\j\end{array}\right)}\bigg(1-\frac{z_n(1+o(1))}{n}\bigg)^{n-j}\bigg(\frac{z_n(1+o(1))}{n}\bigg)^j.\end{align*}
Now, given  $c\in (0,+\infty)$
, consider
 $m=m(c)$
large (to be fixed later). The sum above can be split into
 \begin{align*}\mathbb{P}(X_{(n-cz_n+1)}>m_{n}-1)&= \sum_{j=cz_n}^{mcz_n-1}{\left(\begin{array}{c}n\\j\end{array}\right)}\bigg(1-\frac{z_n(1+o(1))}{n}\bigg)^{n-j}\bigg(\frac{z_n(1+o(1))}{n}\bigg)^j\\&\quad+\sum_{j=mcz_n}^{n}{\left(\begin{array}{c}n\\j\end{array}\right)}\bigg(1-\frac{z_n(1+o(1))}{n}\bigg)^{n-j}\bigg(\frac{z_n(1+o(1))}{n}\bigg)^j\\&=\!:\, A+B .\end{align*}
First, consider the second summand: since  ${\left(\begin{array}{c}n\\j\end{array}\right)}\leq \frac{n^j}{j!}$
, each term can be bounded:
 \begin{align*}{\left(\begin{array}{c}n\\j\end{array}\right)}\bigg(1-\frac{z_n(1+o(1))}{n}\bigg)^{n-j}\bigg(\frac{z_n(1+o(1))}{n}\bigg)^j\leq \frac{z_n^j}{j!}\rightarrow 0.\end{align*}
By choosing m large enough that  $mc>{\rm e}$
, using
 \begin{align*}\frac{z_{n}^{j+1}}{(j+1)!}\leq \frac{z_n^{j}}{j!}\frac{z_n}{j}\leq \frac{z_n^j}{j!}\frac{1}{mc},\end{align*}
B can be bounded by a geometric series. Therefore, using crude bounds with Stirling’s approximation,
 \begin{align*}B\leq \sum_{j=mcz_n}^{n}\frac{z_n^j}{j!}\leq \frac{mc}{mc-1}\frac{z_n^{mcz_n}}{(mcz_n)!}\leq \frac{mc}{mc-1} \Big(\frac{{\rm e}}{mc}\Big)^{mcz_n}\rightarrow 0.\end{align*}
Going back to the first summand, to finish the proof it is enough to show that
 \begin{align*}A=\sum_{j=cz_n}^{mcz_n-1}{\left(\begin{array}{c}n\\j\end{array}\right)}\bigg(1-\frac{z_n(1+o(1))}{n}\bigg)^{n-j}\bigg(\frac{z_n(1+o(1))}{n}\bigg)^j\end{align*}
converges to 0 if  $c > 1$
and converges to 1 if
 $c < 1$
, regardless of m. In this regime,
 $j\rightarrow +\infty$
,
 $j=o(n)$
, so
 \begin{align*}A\sim \sum_{j=cz_n}^{mcz_n-1}\frac{{\rm e}^{-z_n}z_n^j}{j!}\sim \sum_{cz_n}^{+\infty}\frac{{\rm e}^{-z_n}z_n^{j}}{j!},\end{align*}
where the last step follows from the fact that  $B\rightarrow 0$
. Using (11),
 \begin{align*}A\sim \frac{\Gamma(cz_n+1,z_n)}{\Gamma(k_n(c))}=\frac{\int_0^{z_n}t^{cz_n}{\rm e}^{-t} \, {\rm d} t}{(cz_n)!}.\end{align*}
Changing the variable  $t=cz_ns$
and using Stirling’s approximation, we obtain
 \begin{align*}A&\sim \frac{1}{(cz_n)!}\int_0^{\frac{1}{c}}cz_n\exp\big(-scz_n+cz_n\ln(cz_n)+cz_n\ln s\big) \, {\rm d} s\\&\sim \frac{cz_n}{{\rm e}^{-cz_n}\sqrt{2\pi cz_n}\,}\int_0^{\frac{1}{c}}{\rm e}^{-cz_n[s-\ln s]} \, {\rm d} s.\end{align*}
Since the function  $S(s)=s-\ln s$
has a global minimum at
 $s=1$
, with
 $S(0)=1$
,
 $S''(1)=1$
, if
 $c>1$
then the first part of Theorem 7 gives
 \begin{align*}A\sim \frac{\sqrt{cz_n}}{{\rm e}^{-cz_n}\sqrt{2\pi}\,}\frac{1}{1-\frac{1}{c}}{\rm e}^{(-cz_n)\big(\frac{1}{c}+\ln c\big)}\rightarrow 0,\end{align*}
since  $1<\frac{1}{c}+\ln c$
. In the case
 $c>1$
, the second part of Theorem 7 leads to
 \begin{align*}A\sim \frac{\sqrt{cz_n}}{{\rm e}^{-cz_n}\sqrt{2\pi}\,}\frac{\sqrt{2\pi}}{\sqrt{cz_n}}{\rm e}^{-cz_n}=1,\end{align*}
which concludes the proof.
2.2. Some examples: Poisson, negative binomial, and discrete Cauchy
Consider the case where  $X_1 \sim \mathrm{Poi}(\lambda)$
. Anderson [Reference Anderson3] already proved the result
 \begin{align*}\mathbb{P}(X_{(n)}\in \{ m_n,m_{n}+1\})\rightarrow 1.\end{align*}
In the language of this paper, the Poisson distribution falls into the case  $\gamma=0$
of Theorem 1, since
 \begin{align*}\mathcal F(x)\rightarrow {\rm e}^{-\lambda}\frac{\lambda^{x+1}}{\Gamma(x+2)}.\end{align*}
Notice that the most natural choice for  $\mathcal G$
in this case is given by the incomplete gamma function, rather than the log-linear extension. Following the proof of Theorem 1, it is easy to see that
 \begin{align*}\mathbb{P}(X_{(n)}\not\in \{m_n,m_{n}+1\})\leq \bigg(\frac{\lambda}{x_n+1}\bigg)^{m_n-x_n}.\end{align*}
This bound is important, as it shows that the clustering may emerge even for small values of n, provided that  $\lambda$
is small. As for the value of
 $m_n$
, in [Reference Kimber17] it is shown that, to a first approximation,
 \begin{equation}x_n \sim \frac{\ln n}{\ln \ln n}.\end{equation}
However, this estimate is extremely poor, as is shown in [Reference Briggs, Song and Prellberg7]. In particular, if W(z) is the solution to  ${\rm e}^{W(z)}W(z)=z$
(known as the Lambert function, see [Reference Corless, Gonnet, Hare, Jeffrey and Knuth10]), then a much better approximation is given by
 \begin{align*}\tilde x_n= y_n+\frac{\ln \lambda-\lambda-\frac{1}{2}\ln(2\pi)-\frac{3}{2}\ln(y_n)}{\ln(y_n)-\ln \lambda}, \qquad y_n=\frac{\ln n}{W\big(\frac{\ln n}{\lambda {\rm e}}\big)}.\end{align*}
The negative binomial distribution N(r, p) falls into the second category of Theorem 1 with  $\gamma=p$
, since
 \begin{align*}\frac{\mathcal F(n+1)}{\mathcal F(n)}=\frac{\Gamma(n+2+r)}{\Gamma(n+1)\Gamma(r)}\frac{\Gamma(n+1)\Gamma(r)}{\Gamma(n+1+r)}\frac{\int_0^pt^{n+1}(1-t)^{r-1} \, {\rm d} t}{\int_0^pt^{n}(1-t)^{r-1} \, {\rm d} t} , \end{align*}
and, using 7 and the property of the gamma function, it is easy to obtain
 \begin{align*}\frac{\mathcal F(n+1)}{\mathcal F(n)}=\frac{n+1+r}{n+1}p\bigg(1+o\bigg(\frac{1}{n}\bigg)\bigg)\rightarrow p.\end{align*}
Finally, the discrete Cauchy distribution falls into the third regime, since in that case
 \begin{align*}\frac{\mathcal F(n+1)}{\mathcal F(n)}=\frac{\frac{1}{1+(n+1)^2}}{\frac{1}{1+n^2}}\rightarrow 1.\end{align*}
3. The dependent case
As explained in the introduction, it is possible to export the previous results to a certain class of allocation problems. The main ingredient is the local central limit theorem (see, e.g., [Reference Gnedenko and Kolmogorov15]).
Lemma 1. (Local central limit theorem.) Let  $X_1,\ldots,X_n$
be discrete i.i.d. random variables, with
 $\mathbb{E}(X_1)=\mu$
,
 $\mathrm{Var}(X_1)=\sigma^2$
, such that the values taken on by
 $X_1$
are not contained in some infinite progression
 $a + q \mathbb Z$
for integers a, q with
 $q > 1$
. Then, for every integer t,
 \begin{align*}\mathbb{P}\Bigg(\sum_{i=1}^n X_i=t\Bigg)=\frac{1}{\sqrt{2\pi n\sigma}\,}\exp\bigg(-\frac{(t-n\mu)^2}{2n\sigma^2}\bigg)+o\bigg(\frac{1}{\sqrt{n}\,}\bigg),\end{align*}
the error being uniform in t.
3.1. Multinomial allocations
First, consider the case of multinomial allocations, all boxes being equally likely.
Proof of Theorem 4. Let  $X_1,\ldots,X_n$
be i.i.d. with
 $X_1 \sim \mathrm{Poi}(\lambda)$
. By means of (4),
 \begin{align*}\mathbb{P}(Y_{(n)}\in A)&=\mathbb{P}(X_{(n)}\in A)\frac{\mathbb{P}\big(\skew2\sum X_i=k, X_{(n)}\in A\big)}{\mathbb{P}\big(\skew2\sum X_i=k\big)}.\end{align*}
Notice that
 \begin{align*}\mathbb{P}(X_{(n)}=m_n)\sim p_n, \qquad \mathbb{P}(X_{(n)}=m_{n+1})\sim 1-p_{n}\end{align*}
owing to Theorem 1. Moreover,  $\sum_{i=1}^n X_i\sim \text{Poi}(k)$
, so that
 \begin{equation*}\mathbb{P}\Bigg(\sum_{i=1}^n X_i=k\Bigg)={\rm e}^{-k}\frac{k^k}{k!}\sim \frac{1}{\sqrt{2\pi k}\,}.\end{equation*}
It remains to estimate the “tilded” version of the  $X_i$
. If
 $A=\tilde m_n$
, where
 $\tilde m_n=m_n$
or
 $\tilde m_n=m_n+1$
, then
 $\{\tilde X_i\}_{i=1}^{n-1}=\{X_i\}_{i=1}^n\setminus X_{(n)}$
are still independent and identically distributed according to
 \begin{align*}\mathbb{P}\big(\tilde X_1=t\big)=\frac{{\rm e}^{-\lambda }\frac{\lambda^t}{t!}}{F(\tilde m_n)}, \qquad t=0, \ldots, \tilde m_n,\end{align*}
F being the cumulative Poisson distribution as in Section 2.2. By symmetry, each  $X_i$
is equally likely to be the maximum, so that
 $\mathbb{P}(X_{(n)}=X_i)=\frac{1}{n}$
. Therefore,
 \begin{align*}\mathbb{P}\Bigg(\sum_{i=1}^n X_i=k \mid X_{(n)}=\tilde m_n \Bigg)=\mathbb{P}\Bigg(\sum_{i=1}^{n-1}\tilde X_i=n-\tilde m_n\Bigg),\end{align*}
which can now be estimated by means of Theorem 1 (notice that the condition that  $X_1$
does not belong to a subprogression is obviously satisfied). The first moment is
 \begin{align*}\mathbb{E}\big(\tilde X_1\big)=\frac{1}{F(\tilde m_n)}\sum_{j=0}^{\tilde m_n}{\rm e}^{-\lambda}\frac{j\lambda^j}{j!}=\lambda \frac{F(\tilde m_n-1)}{F(\tilde m_n)}=\lambda(1+o(1)).\end{align*}
Similarly, the variance is given by
 \begin{align*}\mathrm{Var} \big(\tilde X_1^2\big)&=\frac{\sum_{j=0}^{m_n} {\rm e}^{-\lambda}\frac{j^2\lambda^j}{j!}}{F(\tilde m_n)}-\lambda^2(1+o(1))\\[5pt]
&=\frac{\lambda^2 F(\tilde m_n-2)+\lambda F(\tilde m_n-1)}{F(\tilde m_n)}-\lambda^2(1+o(1))\\[5pt]
&=\lambda(1+o(1)).\end{align*}
Hence, the local central limit theorem leads to
 \begin{align*}\mathbb{P}\Bigg(\sum_{i=1}^{n-1}\tilde X_i= n-\tilde m_n\Bigg)&=\frac{1}{\sqrt{2\pi(n-1)\lambda}\,}\exp\bigg\{\frac{(k-\tilde m_n-(n-1)\lambda(1+o(1))}{2(n-1)\lambda }\bigg\}\\[5pt]
&\sim \frac{1}{\sqrt{2\pi k}\,}\exp\bigg\{\frac{(\lambda-\tilde m_n)^2}{2k} \bigg\}\\[5pt]
&\sim \frac{1}{\sqrt{2\pi k}\,},\end{align*}
where the last step follows from  $\tilde m_n^2=o(k)$
, a consequence of
 $\tilde m_n\sim \frac{\ln n}{\ln \ln n}$
and
 $k=\lambda n$
. Therefore, as desired,
 \begin{align*}\hspace*{49pt}\mathbb{P}(Y_{(n)}=m_n)\sim \mathbb{P}(X_{(n)}=m_n)\sim p_n, \qquad \mathbb{P}(Y_{(n)}=m_n+1)\sim 1-p_n. \hspace*{49pt}\square \end{align*}
For the proofs of Theorem 5, the very same argument can be applied. Indeed, the only difference is that the number of copies of  $\tilde X$
is now
 $n-t,n-t_n(c)$
respectively. However, this does not affect the central limit theorem, since t and
 $t_n(c)$
are much smaller than n (so that the asymptotic in the central limit theorem remains the same).
3.2. A Bayesian version
Consider now the Bayesian variant of the multinomial allocation problem. The idea is again the same, but a proof is sketched for the sake of completeness.
Proof of Theorem 6. Fix  $x\in \mathbb Z$
. By means of (4) and the conditional representation of a Dirichlet mixture of multinomials as negative binomials, it suffices to show that, for
 $X_1,\ldots,X_n$
i.i.d. with
 $X_i \sim \mathrm{NB}(r,p)$
and
 $\frac{rp}{1-p}=\frac{k}{n}$
,
 \begin{align*}\mathbb{P}\Bigg(\sum_{i=1}^n X_i=k\Bigg)\sim \mathbb{P}\Bigg(\sum_{i=1}^n X_i=k \mid X_{(n)}\leq m_n+x\Bigg) \end{align*}
as  $n, k\rightarrow +\infty$
. As before, the right-hand side can be rewritten as
 \begin{align*}\mathbb{P}\Bigg(\sum_{i=1}^n \tilde X_i=k\Bigg),\end{align*}
where  $\tilde X_i$
is the tilded version of
 $X_i$
given by
 \begin{align*}\mathbb{P}\big(\tilde X_i=s\big)=\frac{\mathbb{P}(X_1=s)}{\mathbb{P}(X_1\leq m_n+x)},\qquad s\leq m_n+x.\end{align*}
Since both the mean and the variance are asymptotically the same for  $X_i$
and
 $\tilde X_i$
(using that
 $m_n+x\rightarrow +\infty$
), the local central limit theorem can be applied to conclude the proof.
4. Numerical results and applications
While theoretically satisfactory, the question remains whether these asymptotic results are of any use in simulations or real models (or whether n has to be unreasonably large for the effect to be manifest). Here are the main conclusions from some simulations for i.i.d. discrete random variables and random allocation models:
• The merging of dependent and independent cases works well for reasonable values of k and n. If the theory gives good approximations in some regime for the independent random variables, it also works for the dependent ones.
• In order to detect the oscillations of the maxima (as well as the other features) in the Poisson case, the quantity
$\frac{\lambda}{x_n+1}$
has to be small. Since
$x_n$
grows sublogarithmically, n has to be extremely large compared to
$\lambda$
(in particular, it is necessary to have
$n\gg {\rm e}^{\lambda}$
). This explains why simulations essentially fail for
$\lambda \gg 1$
, why they work for
$\lambda=O(1)$
provided n is large (for
$\lambda=1$
, in order to obtain
$p_n$
within an error of
$\varepsilon$
, it is necessary to have at least
$n\geq {\rm e}^{\frac{1}{\varepsilon}}$
), and why they are excellent for
$\lambda\ll 1$
, even with relatively small n.


4.1. The role of the mean
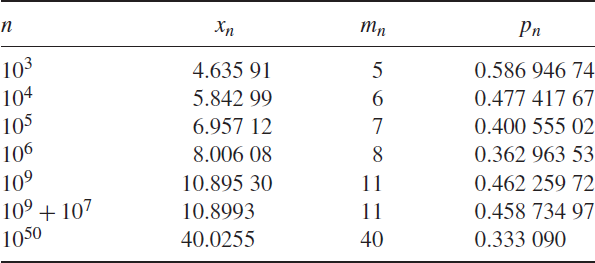
Table 1 presents some numerical values for  $m_n$
,
 $x_n$
, and
 $p_n$
depending on n. For now, we take
 $\lambda=1$
(but, as explained above, soon
 $\lambda$
will be small). Here are some observations from the table:
• The value
$x_n$
grows slowly. At first sight it seems logarithmic, as the factor
$\ln \ln n$
in the asymptotic (12) is hard to detect for reasonable values of n. Only the last entry gives an insight in this direction.• The absence of a law of large numbers, as well as the oscillations, are already emerging in this picture: the value of
$p_n$
does not exhibit any limiting behavior.• The period of the oscillations (i.e. the difference
$N_{i+1}-N_i$
in the language of Theorem 1) is increasing in n.
Table 1:Values of
$m_n$
,
$x_n$
, and
$p_n$
from Theorem 1 as functions of n (with
$\lambda=1$
). The value
$x_n$
can be obtained, e.g., by approximating the Lambert function as in [Reference Corless, Gonnet, Hare, Jeffrey and Knuth10], or by means of numerical methods.Table 2:Comparison between
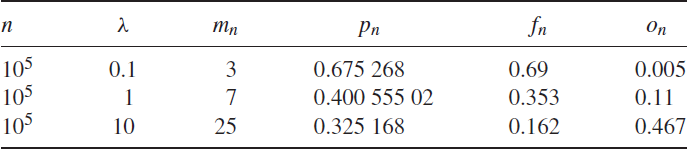
$p_n$
and the relative frequency
$f_n$
for
$m_n$
out of 1000 trials of the experiment ‘drop
$\lambda n$
balls into n boxes’. The last column represents the fraction
$o_n$
of maxima outside the cluster values
$m_n, m_n+1$
.


A thousand trials of the experiment ‘drop  $\lambda n$
balls into n boxes independently’ were simulated. Because of Theorem 4, the maximum box count should be
 $m_n$
or
 $m_n+1$
with probabilities
 $p_n$
or
 $1-p_n$
, respectively. The outcomes are presented in Table 2. Here are some observations:
• For large
$\lambda$
, the approximation is useless. This is not surprising since the quantity
$\frac{\lambda}{x_{n}+1}$
is far from being negligible.• For small
$\lambda$
, the approximation works well, and the theory can be fully appreciated for reasonable n, since the quantity
$\frac{\lambda}{x_n+1}$
is small.• If
$\lambda$
increases, the value of
$m_n$
also increases. However, the
$\lambda$
correction in
$x_n$
(and hence in
$m_n$
) is rather small. This is the reason why small
$\lambda$
is preferable in order to see the results from the theory.• Notice that since
$x_n$
grows sublogarithmically, for fixed
$\lambda$
we need to significantly increase n to see an improvement. On the other hand, once
$\lambda$
is small, the theory works even for n small (e.g.
$n=1000$
).


That being said, the focus will be now on the regime  $\lambda=0.01$
in order to even better capture the ‘oscillating behavior’ of
 $p_n$
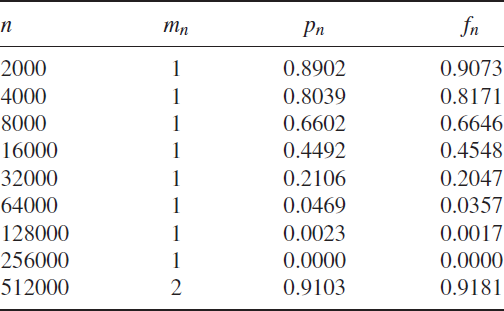
. Table 3 shows the results of an experiment of dropping
 $\lambda n$
balls into n boxes for various values of n. The oscillation is visible in the last step:
 $p_n$
‘refreshes’ at 1 after
 $x_n-m_n$
changes its sign, a phenomenon that happens on a long scale.
Oscillation of  $p_n$
for
 $n=1000 \times 2^m$
,
 $m\in \{1,\ldots,9\}$
, and
 $\lambda=0.01$
. For each n, the experiment of dropping
 $\lambda n$
balls into n boxes is simulated
 $10\,000$
times. As before,
 $f_n$
denotes the relative frequency of
 $m_n$
.

Moving to the number of ties, Theorem 2 implies that the probability of having t ties at the value of the maximal order statistic is given by
 \begin{align*}\mathbb{P}(\text{\textit{t} ties for the maximal order statistic})\sim\, p\frac{\ln^{t+1}\Big(\frac{1}{p}\Big)^{t+1}}{(t+1)!} .\end{align*}
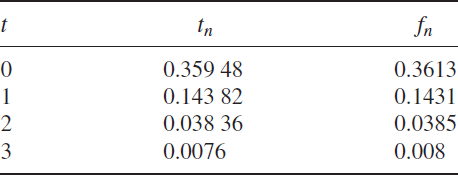
Table 4 shows a simulation of the process. The results are very accurate for small numbers of ties.
The results of  $10\,000$
simulations of dropping 160 balls into
 $16\,000$
boxes (
 $\lambda=0.01$
,
 $p_n=0.449\,241\,15$
) and counting the number of ties t. The relative frequencies
 $f_n$
are compared to the theoretical probabilities
 $t_n$
.

Finally, here are the simulation results for the cluster size on the top two spots for the same values of n and  $\lambda$
: the theoretical result is that about 156.65 boxes should have a count of 1 or 2 balls. The average of
 $10\,000$
experiments gives the result 159.21.
4.2. Coincidence for earthquakes
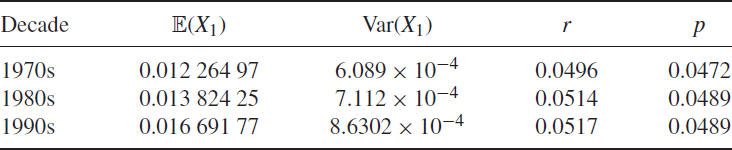
In the popular imagination, big earthquakes are one of the main instances of randomness in natural events. Heuristically, big earthquakes are not independent of each other (as everyone who lives in a seismic area knows), and they instead tend to clump together. As such, a reasonable model is that of inter-arrival times (forgetting about any geographic information) which are distributed according to a negative binomial (see [Reference Greenhough and Main16]), which is suitable for representing positively correlated events.
In the following, we adopt this model and use our theory to study the occurrence of multiple big earthquakes in a given window of time, using data from [Reference Geological Survey20]. For instance, can we explain the occurrence of multiple earthquakes in a given hour by purely statistical arguments, without any ‘cause–effect’ arguments?
In the language of the previous section,  $X_i$
is the number of earthquakes of magnitude above 6 which occurred in hour i of the day, with i running from 1 to 24. We consider realizations over three periods of time: the 1970s, the 1980s, and the 1990s, which correspond respectively to 3652, 3653, and 3652 instances of the
 $X_i$
; the data are shown in Table 5.
Occurrence of earthquakes in a given hour across three different decades, with corresponding estimators with a negative binomial model.

In Table 6 we compare the results given by our theory,  $10^6$
simulations of negative binomial random variables with the same parameter, and the empirical data. We expect the maximum number of earthquakes in a single hour within a day to be either 0, 1, or 2 (theoretically, numerically, and empirically it is almost impossible to observe more than 3 earthquakes in a given hour).
Maximum number of earthquakes in a single hour within a day. The notation a – b – c denotes the percentages of days with 0, 1, or 2 as a maximum.

Acknowledgement
The author wishes to thank Persi Diaconis for suggesting the problem, and for many helpful discussions on the subject. The author is also indebted to Daniel Dore and the two referees for their careful revision of the first drafts.