I. INTRODUCTION
High performance fibers are used in a variety of applications due to their light weight, high strength, and environmental stability. Reference Black1–Reference Xu and Farris3 The fibers are typically synthesized using a melt- or wet-spinning process followed by a hot drawing step. Reference Xu and Farris3,Reference Smook and Pennings4 The result is a highly oriented microfibrillar structure that leads to a highly anisotropic mechanical behavior, with excellent properties occurring along the fiber axis but properties up to two orders of magnitude lower in the radial direction. Reference Hudspeth, Nie and Chen5,Reference Liu and Yu6 While the structure of these materials are well known, Reference Xu and Farris3,Reference Schaefer, Schadt, Gardner, Gabara, Allen and English7,Reference Schadt, Cain, Gardner, Gabara, Allen and English8 the relationship between fiber microstructure and local/global mechanical properties is less understood.
Mechanical properties of fibers are typically studied through global measurement techniques, such as microtensile testing and microcompression tests. Reference Hudspeth, Nie and Chen5,Reference Cheng, Chen and Weerasooriya9 The bulk mechanical behavior is thought to be controlled by the size and number of structural defects that occur within the drawn material. Reference Magonov, Sheiko, Deblieck and Mueller10–Reference Cayer-Barrioz, Tonck, Mazuyer, Kapsa and Chateauminois12 Less studied are the local mechanical properties of the fibers which can be used to explain the hierarchical relationships that exist due to the micro-/nanoscale morphology and defects.
Instrumented indentation, commonly referred to as ‘nanoindentation,’ is an increasingly popular technique for probing local mechanical properties of a sample. Reference Golovin13,Reference Zhu, Ke and Espinosa14 During indentation, the force and displacement are continuously monitored with nanonewton and nanometer resolution, respectively, making the technique attractive for applications in which small volumes of materials need to be examined. To date, the restrictions in applying instrumented indentation techniques to characterize microfibers have included (i) challenges in rigidly securing fibers to a substrate without modifying the sample surface Reference Lonnroth, Muhlstein, Pantano and Yue15–Reference McAllister, Gillespie and VanLandingham18 and (ii) violations of traditional indentation theory due to the finite size of samples. Reference Jakes, Frihart, Beecher, Moon and Stone19,Reference Soifer, Verdyan, Kazakevich and Rabkin20
In this work, we present a straightforward experimental framework for prepping, characterizing, and analyzing single microfibers through instrumented indentation. A new fiber mounting technique is described which ensures fiber–substrate contact during testing without modifying the surface of the sample. The method is applied to four different microfibers: KM2 Plus, Twaron, AuTx, and Dyneema. The technique accounts for several corrections to the well-known and often used Oliver–Pharr analysis. The modified analysis accounts for variations in the projected tip area function due to sample and substrate curvature, as well as the fiber structural compliance, which arises from the loss in constraint due to sample geometry.
A. Background: Oliver–Pharr indentation theory
The standard Oliver–Pharr (O–P) indentation method uses load P versus displacement h data and a calibrated tip area function A(h) to determine the elastic modulus E and hardness H of a material. Reference Oliver and Pharr21,Reference Sneddon22 H is determined at the maximum load P max according to:
 $$H = {{P_{\max } } \over A}\quad .$$
Here, A is calculated from the contact depth h c, which accounts for the deformation that occurs in the surrounding material not directly in contact with the indenter:
 $$h_{\rm{c}} = h_{{\rm{max}}} - {\rm{\varepsilon }}{{P_{{\rm{max}}} } \over S}\quad .$$
ε is a tip geometric constant approximately equal to a value of 1 for a flat punch and 0.75 for a Berkovich tip. S is the stiffness of the tip–sample contact and is defined by the slope of the unloading curve at h max:
 $$S = {{{\mathop{\rm d}\nolimits} P} \over {{\mathop{\rm d}\nolimits} h}}\quad .$$
S is used to determine a reduced elastic modulus of the tip–sample contact through,
 $$E_{\rm{r}} = {S \over {2{\rm{\beta }}}}\sqrt {{{\rm{\pi }} \over {A\left( {h_{\rm{c}} } \right)}}}\quad .$$
where β is an additional constant related to the indenter geometry (a value of approximately 1 for spheroconical geometry). The elastic modulus of the sample can then be found through the following relationship which accounts for the deformation of both the tip and sample during indentation:
 $${1 \over {E_{\rm{r}} }} = {{1 - \nu _{\rm{i}}^2 } \over {E_{\rm{i}} }} + {{1 - \nu _{\rm{s}}^2 } \over {E_{\rm{s}} }}\quad ,$$
where E i, E s, νi, and νs are the elastic modulus and Poisson's ratio of the indenter and sample, respectively.
B. Background: Modified indentation theory
The Oliver–Pharr method relies on several assumptions, namely that the sample is a flat, semi-infinite, isotropic material. Corrections in the data analyses must be made for specimens that violate these assumptions. Previous efforts have included tests on substrate–film systems, Reference Saha and Nix23,Reference Forster, Michaels, Sung and Lucas24 samples with edges, Reference Soifer, Verdyan, Kazakevich and Rabkin20 materials that exhibit indentation-induced phase transformations, Reference Shaw, Stone, Johnson, Ellis and Crone25–Reference Gerbig, Michaels, Forster, Hettenhouser, Byrd, Morris and Cook27 graded materials, Reference Cole, Bruck and Roytburd28 and micro-/nanosized structures. Reference Li, Bhushan and McGinnis29–Reference Cao, Chen, Xu and Li31
Jakes et al. modified the standard indentation theory to account for the specimen structural compliance C
s, or the ability for the sample to flex due to long-range elastic stresses and displacements encountering an interface or free edge.
Reference Jakes, Frihart, Beecher, Moon and Stone19
The authors showed that C
s could be extracted by profiling mechanical properties at various depths and subsequently plotting
 $C_{\rm{t}} \sqrt {P_{{\rm{max}}} }$
as a function of
 $\sqrt {P_{{\rm{max}}} }$
:
 $$C_{\rm{t}} \sqrt {P_{{\rm{max}}} } = \left( {C_{\rm{s}} + C_{\rm{m}} } \right)\sqrt {P_{{\rm{max}}} } + {{\sqrt {\rm{\pi }} } \over {2{\rm{\beta }}}}\sqrt J\quad .$$
Here, C t is the total measured compliance (equal to S −1 from Eq. (3)), C m is the machine compliance, and J is the Joslin–Oliver parameter given by:
 $$J = {H \over {E_{\rm{r}}^2 }}\quad .$$
Assuming no indentation size effect
Reference Han and Nikolov32
and a homogeneous material, a linear fit of the steady state region of Eq. (6) yields a slope of
 $\left( {C_{\rm{s}} + C_{\rm{m}} } \right)$
and an intercept of
 ${{\sqrt {\rm{\pi }} } \over {2{\rm{\beta }}}}\sqrt J$
. If C
m is known, C
s can then be isolated to determine the corrected sample elastic modulus, assuming that the sample is flat.
McAllister et al. extended the structural compliance analysis to cylindrical fibers on a flat substrate by introducing an area function correction.
Reference McAllister, Gillespie and VanLandingham17
Using the standard O–P method, indentation of a cylinder will result in an overprediction of the contact area. Therefore, a modified contact depth h
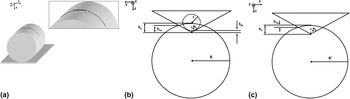
cx was found that accounts for the sample curvature (see Fig. 1). For a spheroconical probe (for
 $h_{\rm{c}} \ge r\left( {1 - {\rm{sin}}\,{\rm{\theta }}} \right)$
, see Ref. Reference McAllister, Gillespie and VanLandingham17 for more general case, as well as derivations) it can be shown that:
 $$h_{{\rm{cx}}} = \varphi h_{\rm{c}} + h_{\rm{d}} \left( {\varphi - 1} \right)\quad ,$$
where,
 $$\varphi = {\rm{cos}}^2 {\rm{\theta }}\left[ {1 - {R \over {h_{\rm{c}} + h_{\rm{d}} }} + \sqrt {\left( {{R \over {h_{\rm{c}} + h_{\rm{d}} }}} \right)^2 + {\rm{tan}}^2 {\rm{\theta }}\left( {{{2R} \over {h_{\rm{c}} + h_{\rm{d}} }} - 1} \right)} } \right]\quad ,$$
and h d is the contact depth difference between a spheroconical and ideal conical geometry, given by:
 $$h_{\rm{d}} = r\left( {\sin \,{\rm{\theta }} + \cos \,{\rm{\theta }}\cot \,{\rm{\theta }} - 1} \right)\quad .$$
(a) Schematic of mounting technique: Single microfibers suspended over curved substrate to ensure fiber–substrate contact. Adhesive applied to fiber centered around apex of substrate. Inset shows testing region of fiber as solid line; dotted line signifies portion of fiber removed after adhesive has cured. (b) Diagram of indentation process accounting for sample curvature. (c) Diagram of indentation process accounting for substrate curvature. Here, R′ represents the substrate.

Here, R is the fiber diameter, r is the indenter tip radius of curvature, and θ is the indenter half angle. Finally, the modified contact area due to fiber curvature A x can be found through the following relation:
 $${{A_x } \over {A_{{\rm{OP}}} }} = \sqrt {{{A_{{\rm{OP}}} (h_{{\rm{cx}}} )} \over {A_{{\rm{OP}}} (h_{\rm{c}} )}}}\quad ,$$
where, A OP is the calibrated area function commonly used in the Oliver–Pharr technique. Finally, the corrected elastic modulus of the fibers can be found by combining Eqs. (4), (5), and (11):
 $$E = {{1 - \nu ^2 } \over {2{\rm{\beta }}\left( {C_{\rm{t}} - C_{\rm{s}} } \right)\sqrt {{{A_{{\rm{OP}}} } \over {\rm{\pi }}}\left( {{{A_x } \over {A_{{\rm{OP}}} }}} \right)} - {{\left( {1 - \nu _{\rm{i}}^2 } \right)} \over {E_{\rm{i}} }}}}\quad ,$$
and Eqs. (4), (7), and (11) can be used to find the corrected hardness of the fibers:
 $$H = {J \over {{4 \over {\rm{\pi }}}{\rm{\beta }}^2 \left( {C_{\rm{t}} - C_{\rm{s}} } \right)^2 \left[ {A_{{\rm{OP}}} \left( {{{A_x } \over {A_{{\rm{OP}}} }}} \right)} \right]}}\quad .$$
II. EXPERIMENTAL METHODS
A. Materials
Four types of ballistic fibers were obtained from the U.S. Army Natick Soldier Research, Development and Engineering Center (Natick, MA). Individual fibers were teased from the tows and used as received. Two of these fiber types possessed the poly(p-phenylene terephthalamide) (PPTA) chemistry: KM2 Plus (600 denier) and Twaron OP25 (500 denier). The Russian copolymer, AuTx (265 denier), which has PPTA-poly (benzimidazole) chemistry, was also tested. In addition, ultrahigh molecular weight polyethylene (UHMWPE) fibers were tested: Dyneema SK76 (1350 denier). For the purposes of this work, the materials will be referred to as: KM2 Plus, Twaron, AuTx, and Dyneema.
B. Mounting of fibers
Previous single fiber mounting efforts for instrumented indentation have included fixing sample to flat substrates through adhesives or other cured polymer films Reference Yu, Tian, Wang, Fei and Wang16,Reference McAllister, Gillespie and VanLandingham17 or relying on frictional forces. Reference Stan, Krylyuk, Davydov, Vaudin, Bendersky and Cook33,Reference Tan and Lim34 In this study, a glass vial shell (2.0 mL, 1 cm diameter, Thomas Scientific) was fixed to a glass slide using double-sided tape. Approximately 1 g washers were anchored to the ends of a single fiber chosen at random from bundles. The fibers were suspended perpendicularly over the vial axis; the weights were allowed to hang freely which ensured good sample–substrate contact near the apex of the vial (see Fig. 1). Two small drops of adhesive (Loctite 416) were then placed approximately 5–7 mm apart, centered on the vial apex, using a tapered cotton swab. The adhesive was allowed to dry overnight and the excess fiber outside of the mounting area was removed. Notably, the technique succeeds in rigidly supporting even the UHMWPE fibers (Dyneema) which are notoriously difficult to bond to most materials. Reference Xu and Farris3
C. Optical microscopy
Three dimensional and profile measurements on single fibers were carried out using a Keyence VK-X200 Laser Microscope (Keyence Corp., Osaka, Japan). The fiber surface was located using the 20x objective lens. Using the 50x objective lens, an automated routine was performed to collect at least three overlapping frames which were then stitched together. Standard processing was performed including DCL/BCL pixel threshold, noise auto elimination, and tilt correction. The tilt correction was performed using the “sec curved surf.” function in the Keyence software which allows for the removal of a curved surface baseline. Therefore, by defining three points along the vial surface, the curvature of the substrate was removed so that the fiber appeared to be sitting on a flat plane. Multiline roughness analysis was then performed where a profile of the fiber was chosen such that the profile width straddled the fiber, having a typical length of 100 μm. The profile included 30 line profiles, typically separated by 30 lines such that the measurements were taken periodically, about every 10 μm, over the length of approximately 300 μm of fiber image. The value of R z (maximum z height with respect to the baseline plane) was taken to be the fiber height and assumed to be the diameter. The average and standard deviation of the 30 R z values were recorded.
D. Measured indentation
Instrumented indentation tests were performed using a Hysitron TI-950 TriboIndenter (Hysitron Corp., Minneapolis, MN) with a diamond Berkovich tip (radius of curvature approximately 100 nm). Indentation areas at least 50 μm from the fiber–adhesive interface were targeted using the optical microscope in the TriboIndenter. The load was tared and the fiber was approached using a 1 μN setpoint. Samples were imaged, repositioned, and ultimately centered under the tip using the scanning probe feature of the TriboIndenter. A position along the apex of the fiber cross section was then targeted for indentation. Measurements were performed in displacement control mode, with a maximum indent depth h f of approximately 200 nm. A drift correction was performed prior to indentation using a preload of 1 μN for 20 s. A triangular force profile was used, using a quasistatic loading rate of 25 nm s−1. For each fiber, a minimum of five measurements were made along the sample, spaced a minimum of 5 μm from subsequent indents. For each fiber type (KM2 Plus, Twaron, Dyneema, AuTx), three separate single fibers were tested, which provided a minimum of 15 measurements per sample type. To obtain sample properties, E i, νi, and νs were assumed to be 1140 GPa, 0.17, and 0.33, respectively.
E. Scanning probe microscopy
Scanning probe measurements were performed using an Asylum Research MFP3D atomic force microscope (AFM) with the ARC 2 controller and AR version 111111+1420 control software. The probes used in the study (AC200TS, Asylum Research) were Al-coated Si cantilevers with a nominal radius of curvature, stiffness, and natural frequency of 9 nm, 9.7 N/m, and 115 kHz, respectively. Standard topography and phase measurements were made in AC mode with typically 512 × 512 pixel resolution and a scan rate range between 0.65–1.0 Hz.
III. RESULTS AND DISCUSSION
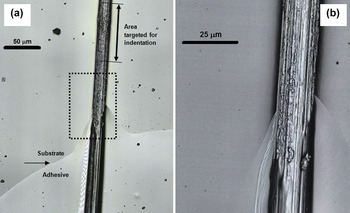
Figure 2 shows the results of optical microscopy on a single fiber mounted to a curved glass substrate. The images show the fiber in the vicinity of the adhesive used to mount the sample. The substrate–adhesive interface is apparent, as is the adhesive cone that separates from the glue droplet and wicks an additional portion of the fiber. The texture of the sample transitions from a relatively smooth surface near the adhesive droplet and cone to the relatively rough unmodified fiber surface away from the adhesive interface. As a result, indentation experiments were performed a minimum of 50 μm from the tip of the adhesive cone, as denoted in the figure. Optical microscopy was also used to confirm fiber/substrate contact, as well as to measure individual fiber diameters for the tip area function correction.
(a) Optical image of fiber mounted to substrate. Arrow indicates adhesive interface. Note that adhesive wicks approximately 50 μm of the fiber outside of the droplet region. Indentation experiments were performed at least an additional 50 μm from the wicked portion of the fiber. Boxed region shown in (b). Fibril bundles appear highly aligned along fiber axis. Note the difference in fiber surface texture in adhesive region and far away from adhesive interface.

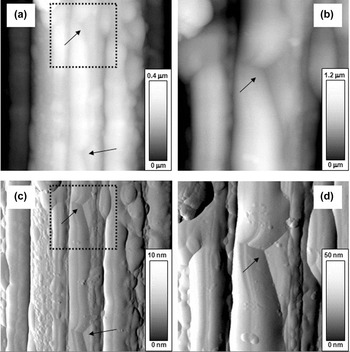
AFM was used to confirm that the indents were performed on the apex of the fiber, and to confirm that the indented surface was indeed free of adhesive. Figure 3 shows AFM images of indents on the apex of a mounted Dyneema fiber. In the images, the fiber is oriented vertically; note the highly aligned fibril bundles, which lead to the anisotropic global mechanical behavior of the fibers. The fiber morphology and surface defects could help to explain the variation in properties determined through indentation. Asymmetry in the residual indent can also be seen in the images, where the Berkovich axis that most closely aligned with the projected fibril bundle generated additional contact with the sample. This effect was most pronounced with Dyneema, which had the highest roughness of the fibers tested in this study, and was an expected discrepancy in the contact area calculation. The tip–sample asymmetry was not considered further, although an additional correction in the projected contact area due to fibril curvature was accounted for and is addressed at the end of section III.
Morphology of indented (∼200 nm) Dyneema fiber surface as determined by atomic force microscopy (AFM). The fiber is oriented vertically in the images, note highly aligned fibril bundles. (a) 10 μm height image of fiber surface; 4 μm boxed region magnified in (b). (c) 10 μm amplitude image of fiber surface; 4 μm boxed region shown in (d). Arrows indicate Berkovich indents from nanoindentation experiments.

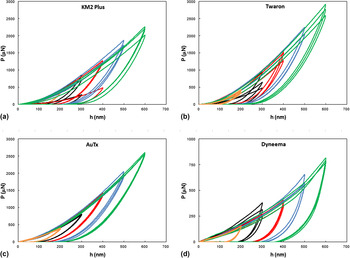
Figure 4 displays the typical load versus displacement curves for indentation tests performed along the apexes of the mounted fibers. Slight deviations in the loading curves can be attributed to variation in the local roughness, which arises due to the fibril morphology on the fiber surface. Variation in the loading curves could also be due to the indent being performed on or near local fibril defects. Mechanical properties determined through traditional indentation theory (e.g., through Eqs. (1)–(5)) assume that the sample is an anisotropic, semi-infinite half space. For the mounted microfibers in the present study, the samples possess curvature, are not rigidly supported, and have finite dimensions. Therefore, modifications for the structural compliance and the projected contact area were made to obtain true material properties.
Force P versus displacement h curves for mounted microfibers for (a) KM2 Plus, (b) Twaron, (c) AuTx, and (d) Dyneema. Each P versus h curve represents a test on a different position along the apex of the fiber. Note that the data in (d) are plotted over a lower force range.

As shown in Fig. 1, the sample surface possesses curvature about the x-axis due to the fiber geometry, and thus a correction for h c must be made for tip–sample contact (h cx) due to sample geometry. Corrections in the projected contact area due to h cx were made by applying Eqs. (8)–(11) and using fiber radii data as determined through optical microscopy. However, for the present case, the fiber mounted onto a curved substrate introduced an additional concern with respect to the calibrated area function. The sample also possesses curvature about the y-axis, and thus a correction for h c must be considered for tip–fiber contact (h cy). From Fig. 1(c), h cy can be approximated through the following relation:
 $$h_{{\rm{cy}}} = h_{\rm{c}} - {\rm{cos}}\,{\rm{\theta }}\left\{ {{{R\prime } \over {{\rm{sin}}\left( {{\rm{\pi }} - {\rm{\theta }}} \right)}}{\rm{sin}}\left( {{\rm{\theta }} - {\rm{sin}}^{ - 1} \left[ {{{{\rm{sin}}\left( {{\rm{\pi }} - {\rm{\theta }}} \right)\left( {R\prime - h_{\rm{c}} } \right)} \over {R\prime }}} \right]} \right)} \right\}\quad .$$
where R′ is the radius of curvature of the substrate. For h c << R′, h cy is vanishingly small and can be neglected (for the present study (h c < 500 nm, R′ = 5 mm), h cy was less than 1 nm). However, for relatively deeper contact depths and/or substrates with relatively high curvature, h cy becomes more significant and must be treated similar to h cx.
Previous attempts at calculating C s have relied on the continuous stiffness measurement (CSM), Reference McAllister, Gillespie and VanLandingham17 which profiles the mechanical properties at various contact depths by applying a small sinusoidally-varying load on top of a quasistatic load. CSM is a powerful technique that allows that properties of a material at a single position to be found as a function of depth. Reference Li and . Bhushan35 However, the set of measurements are performed at a particular location on the sample that is: (i) increasingly modified by previous load-unload cycles and (ii) potentially unrepresentative of the sample properties. In light of this, a varied-position depth profile was performed on each set of microfibers. The displacement control mode was used to vary the maximum contact depths from 200–600 nm. For each depth, a minimum of three measurements were performed at separate positions along the fiber. Equation (6) was then used to estimate and isolate the structural compliance for each set of microfibers. While additional indentation experiments were required to determine structural compliance with respect to the CSM technique, the current method has the potential to provide more representative depth-dependent material behavior.
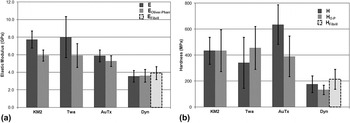
The elastic modulus and hardness of the fibers determined through indentation were found through Eqs. (12) and (13), respectively. Table I summarizes the results of the tests and Fig. 5 provides a graphical representation. The results agree reasonably well with previously reported bulk and local measurements on similar microfibers. As an example, transverse modulus values have been previously reported for single fiber Kevlar KM2 (1.34 GPa), Reference Cheng, Chen and Weerasooriya9 Kevlar 29 (2.45 GPa), Reference Singletary, Davis, Ramasubramanian, Knoff and Toney36 Twaron 1000 (1.70 GPa), Reference Singletary, Davis, Ramasubramanian, Knoff and Toney36 A265 (1.83 GPa), Reference Lim, Zheng, Masters and Chen2 and Dyneema (3 GPa), Reference Hearle37 whereas indentation modulus values have been reported for Kevlar KM2 and Kevlar 49 (6.2 GPa and 7.4 GPa, respectively). Reference McAllister, Gillespie and VanLandingham18 However, direct comparisons are challenging due to: (i) the variation in specific fiber chemistry and/or processing conditions (i.e., Kevlar KM2 versus Kevlar KM2 Plus), (ii) differences in testing methods (i.e., indentation versus transverse compression), and (iii) the fact that most previously reported indentation efforts are on sample surfaces that have been altered through various mounting techniques, whereas the present method allows for measurements on an unmodified sample surface.
Summary of mechanical properties measured through instrumented indentation. Note that an E Fibril and H Fibril are also reported for Dyneema, using an average fibril bundle radius (instead of fiber radius) in the contact area calculation.

(a) Elastic modulus and (b) hardness for fibers tested via instrumented indentation. Plots include mechanical properties found through standard Oliver–Pharr technique (E O–P, H O–P) as well as the corrected mechanical properties that account for sample geometry and structural compliance (E, H). An additional correction for the Dyneema fibers is included that measures contact area on fibril bundle radius instead of fiber radius (E Fibril, H Fibril).

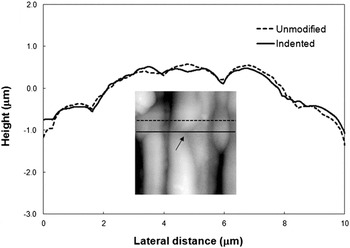
For comparison, the elastic modulus and hardness of the fibers found through the standard Oliver and Pharr analysis (E O–P, H O–P) are also listed. The modified analysis results in a range of modifications to the calculated E and H, with respect to the standard Oliver and Pharr analysis: as high as a 35% increase in the average elastic modulus (Twaron), and as high as a 60% increase in the average hardness (AuTx). The surface morphology of the fibers determined through scanning probe microscopy indicates that the overall geometry of the samples is well represented by a cylinder and thus the modified projected contact area is adequate for determining E and H. The Dyneema fibers are the exception due to the unique surface morphology that includes oriented fibril bundles that project off the surface (see Fig. 6). In this case, indentation measurements are instead made at the apex of a fibril bundle, which has higher curvature than the overall fiber and thus leads to an additional overestimation of the projected contact area. Therefore, the radii of curvature of several bundles were estimated through AFM and the average was used in Eq. (9), instead of the overall fiber radius, to calculate E Fibril and H Fibril. This modification in the contact area results in an increase in the elastic modulus and hardness over the standard analysis of approximately 10% and 60%, respectively. Interestingly, the Dyneema samples displayed the lowest structural compliance of the fibers tested in this study, which is reflected in the roughly equivalent elastic modulus found using the modified and standard Oliver–Pharr analyses. This result may be partially explained by the tested Dyneema fibril bundle being more rigidly supported by surrounding bundles and thus the samples are less susceptible to the structural compliance-related deformations seen in the other fibers. The relatively rough Dyneema fibers may also have a higher sample–substrate contact area compared with the other tested fibers, which may also reduce the structural compliance effect.
AFM surface profile of a Dyneema fiber. Line scans show profile over unmodified surface (dashed line) and over indented surface (solid line). Arrow points toward center of indent.

The variation in the properties for a given fiber is attributed to local roughness and fibril defects. It should be noted that the results found through this methodology are dependent on assumptions of tip/sample symmetry as well as tip/fibril size effects. In particular, the hardness is susceptible to the variation of the surface features because the fiber resistance to plastic deformation is particularly sensitive to the tip landing on or between fibrils, on or far from surface defects, etc. The local mechanical properties gleaned through this indentation study may aid in the understanding of global mechanical behavior of fibers found through bulk testing techniques, such as single fiber tensile and compression.
IV. CONCLUSIONS
In this work, we present a straightforward technique for determining the material properties of microfilaments through instrumented indentation. A mounting method was developed by suspending single fibers over a curved substrate to establish suitable sample–substrate contact for nanoindentation tests. The procedure was applied to various ballistic microfibers to evaluate local mechanical properties. Accounting for sample structural compliance and corrected tip–sample contact area, the modified analysis resulted in an increase in the elastic modulus and hardness of up to 35 and 60%, respectively, compared to the standard Oliver–Pharr analysis. The technique has the ability to be applied to more general indentation tests of microsized fibers since the testing area is not comprised by the sample mounting procedure.
ACKNOWLEDGMENTS
DPC is a contractor to the U.S. Army Research Laboratory under contract NNL09AA00A. The authors also wish to acknowledge Dr. Q.P. McAllister for helpful discussions during this work.