I. INTRODUCTION
Highly ordered TiO2 nanotube (TNT) arrays prepared by electrochemical anodization have been attracting attention from both fundamental research and applied perspectives, driven by their unique photoactivity in a broad range of applications, extending from photocatalytic degradation of organic materials and hydrogen production by water photoelectrolysis to gas sensors and solar cells.Reference Baram and Ein-Eli1, Reference Shankar, Paulose, Mor, Varghese and Grimes2 In contrast to random nanoparticle systems where slow carrier diffusion typically limits device performance,Reference Law, Greene, Johnson, Saykallyi and Yang3 the precisely oriented nature of the crystalline (after annealing) TNT arrays makes them excellent electron percolation pathways for charge transfer between interfaces.Reference Frank, Kopidakis and van de Lagenmaat4, Reference Mor, Shankar, Paulose, Varghese and Grimes5 Furthermore, the nanotube array architecture offers the ability to modify the absorption and propagation of light by precisely designing and controlling the architectural parameters including nanotube inner diameter, wall thickness, and tube length.Reference Paulose, Shankar, Yoriya, Prakasam, Varghese, Mor, Latempa, Fitzgerald and Grimes6 However, the poor spectral response of TNT arrays as well as the relatively low efficiency of light utilization is still the main obstacle that limits their applications using solar energy.Reference Allam, Poncher and El-Sayed7 Besides their wide band gap, both the geometric and crystal structures play key roles in determining the light absorption, charge transfer, and photocatalytic performance.
In general, electrochemical anodization of Ti metal is a relatively simple process to generate well-defined TiO2 nanotubular structure.Reference Macak, Tsuchiya, Ghicov, Yasuda, Hahn, Bauer and Schmuki8 Anodization variables, including electrolyte composition and pH values, anodization potential and duration, annealing ambient and temperature, can influence the TNT morphology and the photoelectrochemical performance.Reference Grimes9–Reference Gong, Grimes and Varghese11 It has been established that the inner diameter is primarily determined by the anodization potential, the crystalline phase by the annealing temperature, and the nanotube length significantly by the anodization duration. Recently, some literature reported that the properties of the TNT arrays strongly depended on their geometric structure.Reference Shankar, Mor, Prakasam, Yoriya, Paulose, Varghese and Grimes12–Reference Shankar, Mor, Paulose, Varghese and Grimes18 Sun et al.Reference Sun, Zhang, Sun and He14 reviewed the effect of geometry of TNT arrays, including wall thickness, length, pore diameter, and intertube spacing, on the performance of the dye-sensitized solar cells using the nanotube arrays as the photoanodes. Atyaoui et al.Reference Atyaoui, Bousselmi, Cachet, Pu and Sutter15 also displayed the influence of geometric characteristics by comparing the photocatalytic efficiencies of three types of TNT electrodes formed in three different kinds of electrolytes. Zhu et al.Reference Zhu, Liu, Liu, Tong, Yang and Peng16 mainly presented the formation mechanism and morphology of TNT arrays synthesized in the fresh and used electrolytes. The previously used electrolyte could greatly improve the adhesion and thus the photoelectrochemical properties of the resulting nanotubes. Tang et al.Reference Tang and Li17 fabricated a series of TNT array films with different thicknesses and investigated their effect on the mechanical properties. Shankar et al.Reference Shankar, Mor, Paulose, Varghese and Grimes18 demonstrated the fabrication of polymer double heterojunction solar cells by infiltrating a blend of P3HT-PCBM into TNT arrays. The photoelectrical performance was found to be dependent on the direction of illumination which was referred to as the frontside-geometry and backside-geometry illumination.
However, the influence of the geometric structure on the properties is complicated. The effects might be caused by the nanotube diameter, length, wall thickness, or all of them together. Despite the vast literature, few reports systematically and quantitatively deal with the relation between the structure and the photoelectrical properties. Such information, however, is important for both physical understanding and optimizations of photoelectrochemical devices based on TNT arrays. In this article, we quantitatively determined the photoconversion efficiency of the TNT arrays and investigated their dependence on the geometric structure. A geometric roughness factor has been applied to describe the combinative influence of the geometric characteristics. Furthermore, the effect of the crystal structure on the photoelectrical properties was also investigated. The TNT arrays with mixed crystalline phases have been found to possess better photoconversion efficiency than those with single phase. The influence of crystal structure including different ratios of anatase to rutile was discussed in detail.
II. EXPERIMENTAL
Titanium foils (0.2 mm thickness, 99.4% purity) were firstly polished by a chemical polishing solution with a volumetric ratio of HF:HNO3:H2O = 1:4:5. Then, all the foils were degreased by sonication in acetone, ethanol, and deionized (DI) water, respectively, and subsequently dried in ambient air. The anodization was performed in a two-electrode configuration with the titanium foil as the working electrode and a stainless steel foil as the counter electrode. The electrolyte containing 0.27 M NH4F consisted of mixtures of DI water and glycerol (1,2,3-propanetriol) prepared in a volumetric ratio of 50:50. To obtain TNT arrays with different lengths and diameters, the foils were anodized at different anodization potentials for various anodization durations. To produce different crystal structures, samples were annealed at different temperatures in the range from 350 to 750 °C for 3 h with a heating rate of 2 °C/min in ambient air.
The morphology and the crystalline phase of the TNT array samples were characterized using scanning electron microscopy (SEM; Hitachi S-3000N, Tokyo, Japan) and x-ray diffraction (XRD; D2 PHASER, Bruker-AXS, Karlsruhe, Germany) techniques, respectively. The photoelectrochemical measurements were performed with an electrochemical workstation (Zahner Zennium, Kronach, Germany) in a standard three-electrode configuration with a platinum foil as the counter electrode, a saturated calomel electrode (SCE) as the reference electrode, and the TNT array sample as the working electrode. The measurements were conducted in an electrochemical cell with quartz window at the scan rate of 5 mV/s. The electrolyte is 1 M KOH solution and the light source is ultraviolet (UV) light (370.8 nm, 0.3 mW/cm2 illumination on the photoanode).
III. RESULTS AND DISCUSSION
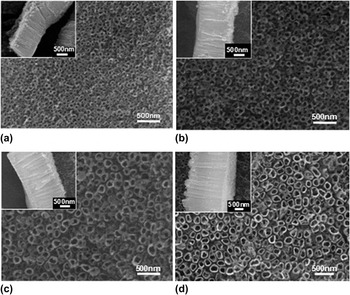
Figure 1 shows the SEM images of the as-prepared TNT arrays synthesized by chemical anodization at different potentials for 3 h. In the potential range from 15 to 30 V, well-defined nanotube arrays could be successfully achieved. The TNT diameter and length increase as the anodization potential increases. Our previous report has demonstrated that nanotube arrays could be obtained in the potential window between 10 and 35 V in the same anodization electrolyte and discussed the effects of synthesis parameters on controllable growth of highly ordered TNT arrays. However, the TNT arrays anodized at 10 V are not able to distinguish the tubular structure due to the confined chemical dissolution at low electric field. When the potential is 35 V or even higher, it is difficult to obtain a neat and clean surface morphology since the precipitators of the anodic reaction were left on the surface, and even breakdown of Ti foil might occasionally occur under the high electric field. Thus, in this work, the nanotube arrays were fabricated in the potential range between 15 and 30 V.
Scanning electron microscopy top images of the as-prepared TiO2 nanotube (TNT) arrays anodized for 3 h at (a) 15 V, (b) 20 V, (c) 25 V, and (d) 30 V. The insets show cross-sectional views of the corresponding nanotube layers.

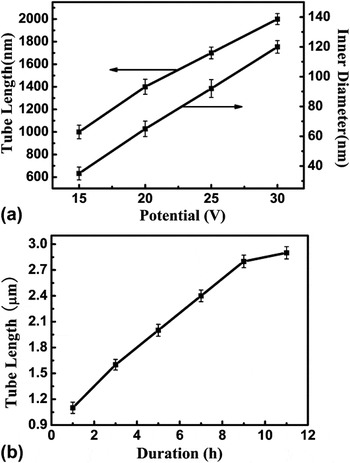
The key factors determining the nanotube diameter and length are anodization potentials and durations. To quantitatively determine the TNT geometric structure, one could perform a direct measurement in Fig. 1. Since the nanotube is irregularly round, the average of 15 nanotubes in different areas was taken to define the diameter for each anodization condition. For each nanotube, we measured the diameter in both horizontal and vertical directions and took an average value. To define the tube length, we adopted a similar method. Since this is a simple but direct method to define the geometric size, we added the error bars together with the average values as shown in Fig. 2. Figure 2(a) shows the TNT inner diameter and tube length as a function of the anodization potential for a fixed duration of 3 h. For the anodization potentials of 15, 20, 25, and 30 V, the resulting diameters were about 35, 65, 92, and 120 nm, respectively, and the tube lengths were about 1.0, 1.4, 1.7, and 2.0 μm, respectively. The wall thickness seems irrelevant to the anodization potential and keeps about 30 nm. Figure 2(b) represents the tube length as a function of anodization duration at a fixed potential of 25 V. The tube length increases linearly from 1.0 μm for 1 h to 2.8 μm for 9 h. With further increasing of anodization duration, the tube length increases slowly. After anodization for 11 h, even prolongated anodization duration does not increase the length any more.
(a) TNT inner diameter and length as a function of the anodization potential for a fixed duration of 3 h. (b) Tube length as a function of the anodization duration at a fixed potential of 25 V.

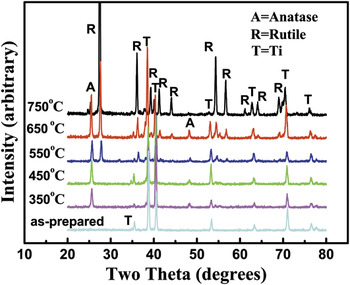
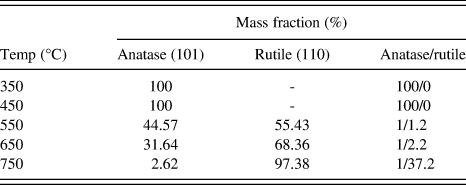
The XRD patterns of TNT arrays annealed at different temperatures are shown in Fig. 3. All the samples were fabricated at the potential of 30 V for 3 h. The diffraction pattern of the as-prepared sample shows only Ti signals, indicating that the as-prepared TNT arrays are amorphous.Reference Mor, Varghese, Paulose, Shankar and Grimes19, Reference Sun, Yan, Wang, Guo and Ma20 Anatase phase starts to occur at 350 °C. At 350 and 450 °C, there are only anatase diffraction peaks (JCPDS card No. 21-1272), and the peak intensities increase with increasing temperature. As the annealing temperature rose to 550 °C, the anatase phase started to convert to rutile phase (JCPDS Card No. 21-1276). At an even higher temperature like 650 °C, XRD peak intensities related to rutile phase increase while those related to anatase phase enhance up to the maximum. At the temperature up to 750 °C, the crystal structure almost completely converts to rutile phase as evidenced by the absence of the peaks related to anatase. Furthermore, the corresponding mass fractions of anatase phase and rutile phase at various annealing temperatures could be calculated by the following equation.Reference Sun, Yan, Wang, Guo and Ma20, Reference Zhang and Banfield21

X-ray diffraction patterns of the as-prepared TNT arrays and those annealed at 350, 450, 550, 650, and 750 °C. All the samples were prepared at 30 V for 3 h.

Here, χ is the mass fraction of rutile phase, I A is the diffraction peak intensity of anatase phase (101), and I R is the diffraction peak intensity of rutile phase (110). Hence, the relationship between the relative content of crystalline phases and annealing temperature was determined and shown in Table I. It can be seen that 97.38% anatase was transformed into rutile at 750 °C.
Mass fractions of anatase and rutile phases of TiO2 nanotube samples annealed at various temperatures.
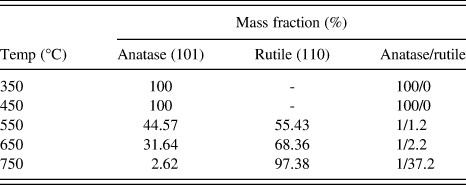
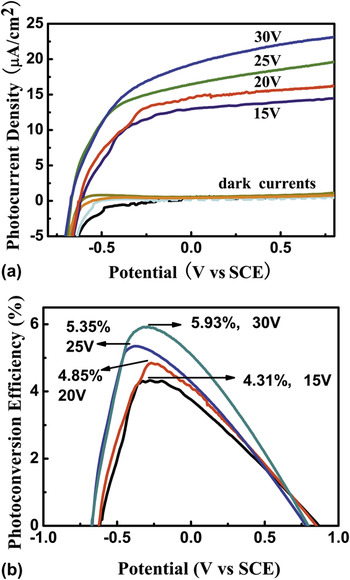
Figure 4(a) shows the photocurrent density of the TNT array samples fabricated at various anodization potentials for a fixed duration of 3 h, while Fig. 4(b) shows the corresponding photoconversion efficiency. Prior to photocurrent measurements, all the samples were annealed at 450 °C. As shown in Fig. 4(a), the current densities in dark (without illumination) are found to be negligible, while the photocurrent densities under UV illumination dramatically increase with the elevation of applied potentials. The photoresponse is apparent due to the n-type semiconductor nature of TiO2 that can generate electron–hole pairs under light illumination with energy greater than its band gap. Herein, the photocurrent densities are in microamp (μA) order of magnitude due to the weak intensity of our light source. The TNT arrays fabricated at higher anodization potentials possess larger photocurrent densities, and the maximal photocurrent density is 23 μA/cm2 obtained by the sample fabricated at 30 V.
(a) Photocurrent density and (b) corresponding photoconversion efficiency of the nanotube array samples fabricated for 3 h at the anodization potentials of 15, 20, 25, and 30 V. All the samples were annealed at 450 °C for 3 h. The samples were measured under 370.8 nm, 0.3 mW/cm2 illumination in a 1 M KOH solution at a scan rate = 5 mV/s.

The photoconversion efficiency (η), which is applied to quantitatively determine the photoelectrical properties of the TNT photoanode, could be calculated using the equation described below.Reference Allam and Grimes22, Reference Chen, Jaramillo, Deutsch, Kleiman-Shwarsctein, Forman, Gaillard, Garland, Takanabe, Heske, Sunkara, McFarland, Domen and Miller23
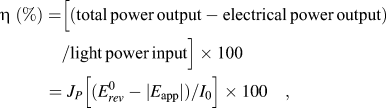
Here, J p is the photocurrent density (mA/cm2) and I 0 is the power density of incident light (mW/cm2).  is the standard reversible potential of 1.23 VNHE, and the applied potential E app = E meas – E ocp, where E meas is the electrode potential (versus SCE) of the working electrode in which photocurrent was measured under illumination. E ocp is the electrode potential at the open-circuit condition under the same illumination and in the same electrolyte. According to Eq. (2) and the experimental data of Fig. 4(a), the photoconversion efficiencies were quantitatively determined. The result created a series of bell-shaped plots of the photoconversion efficiency versus the applied potential as shown in Fig. 4(b). The TNT sample fabricated at 15 V shows the lowest η of 4.31%, while the sample fabricated at 30 V has the highest η of 5.93% which exhibits 38% improvement over the lowest one. Figure 4 thus demonstrates that the photocurrent density and corresponding photoconversion efficiency increase with the increasing anodization potential. According to Fig. 2(a), the TNT geometric structure strongly depends on the TNT formation conditions. The samples fabricated at higher potentials have larger inner diameters and longer tube lengths, which possess higher photocurrent densities and better photoconversion efficiencies as shown in Fig. 4.
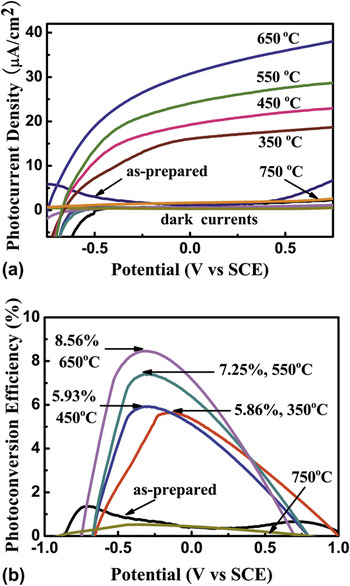
Figure 5(a) shows the photocurrent density versus applied potential for the as-prepared and annealed TNT array samples in dark and under UV illumination. The dark currents are found to be negligible. The photocurrent of the as-prepared sample is nearly the same as those dark currents due to its amorphous structure where the large number of defects led to a high carrier recombination rate.Reference Macak, Tsuchiya, Ghicov, Yasuda, Hahn, Bauer and Schmuki8 Thus, it is necessary to crystallize the samples by annealing prior to conducting photoelectrochemical measurements.Reference Run, Paulose, Vrghese and Grimes24 The photocurrent densities under UV illumination increase with the elevation of applied potential. The maximum photocurrent density of the sample annealed at 350 °C with 100% anatase phase reaches 18.7 μA/cm2 at the applied potential of 0.75 V. The samples annealed at higher temperatures show even larger photocurrent densities. At 650 °C, the maximum photocurrent density rises to 38.1 μA/cm2 at the applied potential of 0.75 V, which is about double of that obtained at 350 °C. However, as the annealing temperature rises to 750 °C, the photocurrent density apparently decreases. The reason might be that TNT arrays have already collapsed when the temperature increases up to 750 °C.
(a) Photocurrent density and (b) corresponding photoconversion efficiency of the nanotube array samples annealed at 350, 450, 550, 650, and 750 °C. All the samples were fabricated at the potential of 30 V for 3 h. The samples were measured under 370.8 nm, 0.3 mW/cm2 illumination in a 1 M KOH solution at a scan rate = 5 mV/s.

Figure 5(b) exhibits the corresponding photoconversion efficiency as a function of applied potential, and the results are well consistent with the photocurrent density. Among the samples which have different crystal structures as shown in Fig. 3 and Table I, the maximum η of 8.56% obtained for the sample annealed at 650 °C shows 46% higher than that annealed at 350 °C. As shown in Table I, the sample annealed at 350 °C contains 100% anatase phase, while the sample annealed at 650 °C possesses a mixed crystal structure consisting of both anatase (31.64%) and rutile (68.36%) phases. According to Fig. 5(b), the samples with the mixed crystalline phases possess a higher photoconversion efficiency than those with only anatase or rutile phase, and the optimum ratio of rutile to anatase is about twice. The results are in good agreement with the previous reports.Reference Mor, Varghese, Paulose, Shankar and Grimes19, Reference Chen, Shen, Guo and Mao25 The mixed crystal structure not only enhances the light absorption but also contributes to narrow the band gap and make more electrons jump from the valence band to the conduction band as the rutile nanotube array atop the anatase barrier layer could facilitate separation of the photogenerated electrons and holes.Reference Chen, Shen, Guo and Mao25–Reference Shankar, Basham, Allam, Varghese, Mor, Feng, Paulose, Seabold, Choi and Grimes27
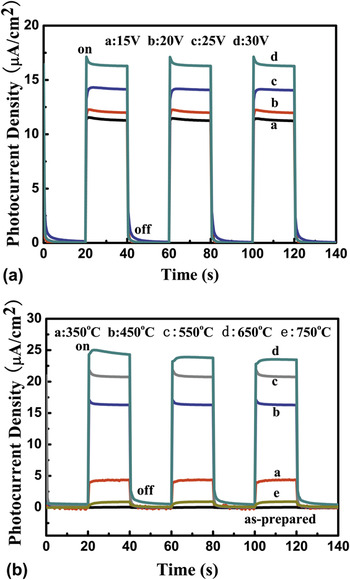
The transient photocurrent densities were measured under the pulsed illumination as shown in Fig. 6. When the illumination is on, the photocurrent density rapidly rises to a steady state. As the illumination is interrupted, the photocurrent density reverts back to the original value within a couple of seconds. These results indicate that the observed photocurrent density is due to the photo-induced charge separation in the TNT arrays, and the charge transportation process is very rapid. As shown in Fig. 6(a), the photocurrent density increases with the elevation of anodization potentials, which is well consistent with Fig. 4. In Fig. 6(b), the as-prepared nanotubes could not respond to the UV illumination, and the photocurrent density is nearly zero. For the annealed samples, the photocurrent density increases to the maximum value at 650 °C, but it sharply decreases at 750 °C, which is in line with the results in Fig. 5.
Photocurrent density versus time of the samples (a) anodized at different potentials of 15, 20, 25, and 30 V and (b) annealed at different temperatures of 350, 450, 550, 650, and 750 °C.

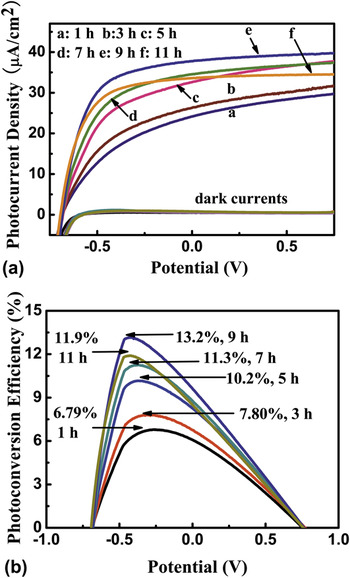
The measurements above in Fig. 4 have demonstrated that the photoelectrical properties of the TNT arrays are closely linked with their microstructures, like inner diameter, tube length, and so on. According to Fig. 2(a), the inner diameter and tube length increase simultaneously with the anodization potentials, where it is difficult to clarify their own contribution to the photoresponse. To further reveal the single effect of the nanotube length on the photoelectrical properties, TNT samples were prepared at a fixed anodization potential of 25 V for different durations. Under this condition, the nanotube length increases with the duration as shown in Fig. 2(b), while the inner diameter and the wall thickness keep almost the same. Prior to photocurrent measurement, the samples were annealed at 550 °C for 3 h. Figure 7 shows the photocurrent densities and the corresponding photoconversion efficiencies of the nanotube array samples. As the anodization duration increases from 1 to 9 h, resulting in the increase of the tube length from 1.1 to 2.8 μm, the photocurrent density and the corresponding photoconversion efficiency increase. However, when the duration further increases to 11 h and the tube length rises to 2.9 μm, the photoresponse becomes worse.
(a) Photocurrent density and (b) corresponding photoconversion efficiency of the nanotube array samples fabricated at 25 V for various durations. All the samples were annealed at 550 °C for 3 h prior to measurement. The samples were measured under 370.8 nm, 0.3 mW/cm2 illumination in a 1 M KOH solution at a scan rate = 5 mV/s.

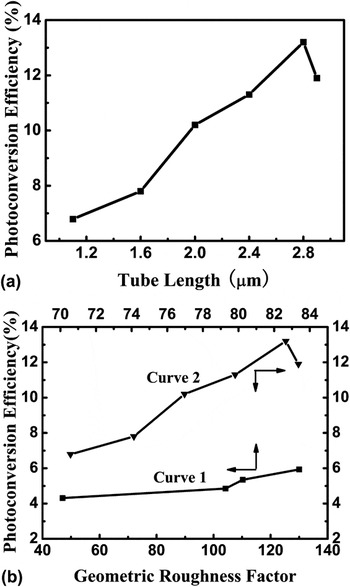
Figure 8(a) summarizes the photoconversion efficiency as a function of tube length, where the TNT array photoanodes were fabricated at 25 V for various durations. The TNT arrays anodized at 9 h represent the highest photoconversion efficiency of 13.2%. That is, the sample with the tube length of 2.8 μm shows a maximum photocurrent density and exhibits the optimal photoresponse performance among the samples investigated. This indicates that, with respect to the photoresponse, there might exist an optimal tube length, where the absorption of the incident light is balanced by recombination of the photogenerated electron–hole pairs. Nanotube arrays with short tube length could not fully absorb the incident light, while those with long tube length might have worse photoconversion efficiency suffering from recombination of the photogenerated electron–hole pairs.Reference Kar, Pando and Subramanian26, Reference Shankar, Basham, Allam, Varghese, Mor, Feng, Paulose, Seabold, Choi and Grimes27
(a) Photoconversion efficiency as a function of tube length using the TNT array photoanodes fabricated at 25 V for various durations. (b) Photoconversion efficiency as a function of the geometric roughness factor. Curve 1 refers to the samples fabricated at various anodization potentials for 3 h, while Curve 2 refers to those fabricated at 25 V for various durations.

In the previous report by Shankar et al.,Reference Shankar, Mor, Prakasam, Yoriya, Paulose, Varghese and Grimes12 a geometric roughness factor has been defined to describe the physical surface area of the TNT array film per unit of projected area. The factor represents the ratio of active surface area to geometric surface area, and thus is a dimensionless physical quantity. Thus, the factor can be used to describe the combinative effect of the TNT geometric characteristics on the properties. Assuming an idealized nanotubular structure with inner diameter D, wall thickness W, and tube length L, the geometric roughness factor can be calculated by the following equation.Reference Shankar, Mor, Prakasam, Yoriya, Paulose, Varghese and Grimes12, Reference Zhu, Neale, Miedaner and Frank28

This calculation assumes all surfaces of TNT arrays to be perfectly smooth. Figure 8(b) reveals the effects of geometric roughness factor on the photoconversion efficiency of the samples fabricated at various anodization potentials for 3 h (Curve 1) and those fabricated at 25 V for various durations (Curve 2). The general trend is that the photoconversion efficiency increases with increasing roughness factor since a larger geometric roughness factor entails the availability of a larger number of active reaction sites for chemical reactions to occur and allows photogenerated holes to access a large number of solution ions.Reference Shankar, Mor, Prakasam, Yoriya, Paulose, Varghese and Grimes12, Reference Kawakita, Kawakita, Sakka and Shinohara29 However, the photoconversion efficiency also depends on the separation processes of the photogenerated electron–hole pairs. Due to the high recombination possibility for longer nanotubes, Curve 2 presents a decline after the photoconversion efficiency reaches the maximal value of 13.2% with the geometric roughness factor of 125.32. Thus the photoresponse behavior of the nanotube array samples has been demonstrated to be strongly dependent on the microstructure. Besides the inner diameter and tube length, the photoelectrical properties might be also associated with the wall thickness of the nanotubes and the barrier-layer thickness, which are not easy to control by simply adjusting the anodization potentials and/or durations, and require further investigation to clarify their effects.
IV. CONCLUSION
This work demonstrates that the photoelectrical properties of the TNT array samples are strongly associated with the crystalline phases as well as the geometric structure, such as the inner diameter and tube length. The samples with the mixed crystalline phases of anatase and rutile possess higher photoconversion efficiency than those with the single anatase or rutile phase. The TNT arrays with larger inner diameters and longer tube lengths enable higher absorption of incident photons and offer a larger number of active reaction sites for chemical reactions to occur, leading to better photoelectrical properties. A geometric roughness factor has been applied to describe the combinative effect of the geometric characteristics. The TNT sample with the geometric roughness factor of 125.32 (anodized at 25 V for 9 h) shows the superior photoconversion efficiency of 13.2%. However, the tube length and/or roughness factor cannot infinitely increase to achieve higher photoconversion efficiency due to the worse recombination of the photogenerated electron–hole pairs in longer nanotubes. Such information is of great significance for realization and optimization of photocatalytic applications using the TNT arrays.
ACKNOWLEDGMENTS
We acknowledge Mr. Guizhen Wang for the analysis of scanning electron microscopy in the Analytical and Testing Center of Hainan University. This work was supported by Program for New Century Excellent Talents in University (NCET-09-0110), the Key Project of Chinese Ministry of Education (210171), and the National Nature Science Foundation of China (51162007).