Introduction
The extent of weight gain during pregnancy plays a major role in the health and future weight status of mothers and babies. Evidence supports that maternal pre-pregnancy weight status and excess weight gain are independent risk factors for gestational diabetes (GDM) as well as future maternal and child obesity.Reference Crane, White, Murphy, Burrage and Hutchens 1 – Reference Margerison Zilko, Rehkopf and Abrams 5 The development of accurate physical activity (PA) assessment methods for pregnant women is an underdeveloped yet emerging area of research. The use of validated instruments in this population can improve the ability to assess the relationship between maternal PA, gestational weight gain and infant health outcomes.
The American Congress of Obstetricians and Gynecologists’ guidelines recommend that all women with a normal pregnancy participate in 30 min of PA on most days of the week. 6 In a joint statement from the American Diabetes Association and the American College of Sports Medicine, it was stated that moderate levels of exercise can lower maternal blood glucose associated with GDM and higher levels of exercise may reduce the risk of developing GDM. 7 Despite these recommendations, very few pregnant women engage in regular PA.Reference Evenson, Savitz and Huston 8 – Reference DiNallo, Le Masurier, Williams and Downs 10
In the non-pregnant state, total energy expenditure (EE) is defined as the sum of energy expended at rest (60–75%), digesting and absorbing food (∼10%) and during activity (∼25–30%).Reference Forsum and Löf 11 Using this information, a system was developed where the energy of an activity was expressed as a multiple of the resting metabolic rate and is now commonly known as the metabolic equivalent of task (MET).Reference Ainsworth, Haskell and Whitt 12 A compendium of hundreds of activities was developed based on the resting oxygen consumption defined as 3.5 ml O2/kg/min.Reference Ainsworth, Haskell and Whitt 12 An updated version of the Compendium was published in June 2011Reference Ainsworth, Haskell and Herrmann 13 with additional MET values based on measured data. The MET system has been widely used to evaluate the effectiveness of PA programs and is currently the terminology used for public health recommendations in the first ever United States Physical Activity Guidelines for Americans. 14
The MET system is commonly used to quantify EE and categorize the intensity of PA in pregnant women; however, the MET system has not been shown to be valid in pregnancy. Chasan-Taber et al.Reference Chasan-Taber, Freedson, Roberts, Schmidt and Fragala 15 found a significant difference between the MET measured in pregnant women via indirect calorimetry (IC) compared with the 2000 compendium MET for four household tasks. Furthermore, researchers have speculated that a MET for a specific activity may be lowered as pregnancy advances due to increases in basal metabolic rate (BMR) associated with pregnancy.Reference Forsum and Löf 11 Despite these observations and the acknowledgment that the current MET system is not appropriate for use during pregnancy,Reference Forsum and Löf 11 , Reference Forsum, Löf and Schoeller 16 many pregnancy-related studies continue to utilize the MET system.Reference Schmidt, Freedson and Pekow 17 – Reference Borodulin, Evenson, Wen, Herring and Benson 20 The current study builds on this prior work by including rest, additional activities of daily living and walking. The purpose of this study was to assess the accuracy of the compendium MET from the 2000 and 2011 versions to predict EE in early pregnancy.
Methods and procedures
Subjects
Thirty-six healthy pregnant women were recruited in and around a mid-sized Midwestern American town. Primary recruitment methods included mass emails to faculty, staff and students at the local university, advertisements placed online, on-campus and in the community, including local obstetric clinics. Six subjects withdrew from the study after enrollment or were excluded due to pregnancy complications, therefore, 30 women were included in the analysis.
Participants were recruited between May 2010 and April 2011. Inclusion criteria consisted of maternal age between 18 and 45 years of age, a singleton pregnancy between 10 and 14 weeks gestation, and ability to walk on a treadmill at a light and moderate pace (maximum speed 3.0 mph with 3% incline) for ∼30 min consecutively. Participants were excluded if they smoked or had a history of chronic disease, including thyroid conditions. Permission to participate and confirmation of qualification criteria was received from each participant's obstetric medical provider. The study design was approved by the Institutional Review Board at the local university. All subjects provided written informed consent prior to participation.
Testing protocol
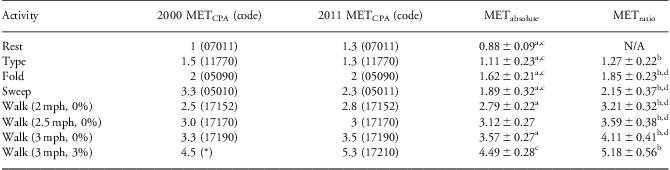
For all study appointments, participants reported to the clinical research center. Each subject completed two visits; the first visit included signing of the consent form and completion of a medical history questionnaire. The second visit included an assessment of EE at rest (EErest) and during activities of daily living (ADL) and treadmill walking using an IC (ParvoMedics, Salt Lake City, UT, USA); height and weight were also measured. Following an overnight fast, the procedure for the resting measurement required the subject to lie down quietly for 25 min to reach a metabolic steady state. After the assessment of EE at rest, a snack was offered to each woman providing ∼250 kcals. The total thermic effect of food for this snack would be ∼25 kcals and would have minimal impact on EE throughout the remainder of the appointment. The standardized daily activities were conducted for 7 min each with 2 min of rest between non-treadmill activities. The activities included computer typing (typing on a standard sized keyboard from a standard script while seated), folding laundry (folding the same basket of clothing while lab personnel unfolded items to sustain the activity for 7 min in length), sweeping (sweeping a pile of Lego® blocks back and forth between two marked spots 3 m apart on an uncarpeted floor at a self-selected pace) and walking on a calibrated treadmill (C956i, Precor Inc., Woodinville, WA, USA) at treadmill settings of 2.0, 2.5 and 3.0 mph at 0% incline and 3.0 mph at 3% incline. See Table 1 for the corresponding MET values for the activities evaluated.
Comparison of Compendium v. measured MET

MET, metabolic equivalent; CPA, Compendium of Physical Activities; EE, energy expenditure.
The METCPA is the MET published for the activity in the CPAReference Ainsworth, Haskell and Whitt 12 , Reference Ainsworth, Haskell and Herrmann 13 along with the compendium code unless *calculated from the MET equation for walking. 35 The METabsolute is the total oxygen consumption during an activity divided by 3.5 ml O2/kg/min. The METratio is the EE of the activity divided by the EE of rest.
Significance is denoted as follows: athe 2000 METCPA is significantly different from the METabsolute, P < 0.0001; bthe 2000 METCPA is significantly different from the METratio, P < 0.005; cthe 2011 METCPA is significantly different from the METabsolute, P < 0.0005;
dthe 2011 METCPA is significantly different from the METratio, P < 0.005. No letter listed indicates no significant difference.
Values are mean ± s.d.
Anthropometric and demographic data
Pre-pregnancy weight was obtained via self-report on the medical history questionnaire at the first visit. Current weight was measured at both visits (Detecto Model 6855 Cardinal Scale, Manufacturing Co., Webb City, MO, USA) to the nearest 0.1 kg. Height was measured (Ayrton 226 Hite-Rite Precision Mechanical Stadiometer, Quick Medical GS, Snoqualmie, WA, USA) to the nearest 0.1 cm. Subjects reported their age, education level, parity and number of pregnancies (including the current pregnancy) on the medical history questionnaire at the time of enrollment. Participants were also asked to classify their ethnicity as American Indian or Alaska Native, African American, Caucasian, Asian, Hispanic or other.
Data analysis
EE was measured by IC. This reference measure has been shown to correlate well with doubly labeled water.Reference Klein, James and Wong
21
–
Reference Roberts, Dietz, Sharp, Dallal and Hill
23
EE was predicted by examining the oxygen and carbon dioxide content of expired gases (O2 and CO2) and expired gas flow. The EE was calculated by the calorimeter as the average of a 15-second epoch. To analyze the EEREE data, the first 10 min were discarded to ensure that a steady resting state was achieved. Additionally, the last two epochs were discarded as many participants started to become restless near the very end of the testing period, thus 15 min of data were analyzed. For the EE data from the ADL and walking, the first 
and the last two epochs were discarded to ensure that the participant had achieved a steady state; therefore, 3 min of data were analyzed.
Statistical analysis
EE measured by the IC was converted to a MET value by two different methods. 24 , Reference Kozey, Lyden, Howe, Staudenmayer and Freedson 25 For the METabsolute, 1 MET was defined as 3.5 ml O2/kg/min, thus the MET of an activity was calculated by dividing the total oxygen consumption during an activity by 3.5 ml O2/kg/min. For the METratio, the MET was defined as the energy cost of the specific activity divided by the energy cost at rest. The difference between the measured MET (METabsolute and METratio) and the METCPA (2000 and 2011) was assessed using a one-sample t-test for each activity using the METCPA as the hypothesized mean. The MET values were also assessed using regression and Bland–Altman analysis to examine the goodness of fit between the measured MET and published MET (METCPA). Data are presented as mean ± s.d. Overall significance was assumed at P < 0.05. For multiple comparisons, a Bonferroni-corrected significance level was used to obtain an overall significance level at P < 0.05.
Results
Mean age of the participants was 28.5 ± 4.0 years and the mean pre-pregnancy body mass index (BMI) was 23.8 ± 3.3 kg/m2. The average length of gestation for the participants was 12.6 ± 1.4 weeks. Most of these women were educated (83% had at least a bachelor's degree, n = 25), predominantly Caucasian (93%, n = 28), and married (93%, n = 28). For 47% (n = 14), this was their first pregnancy.
Absolute definition
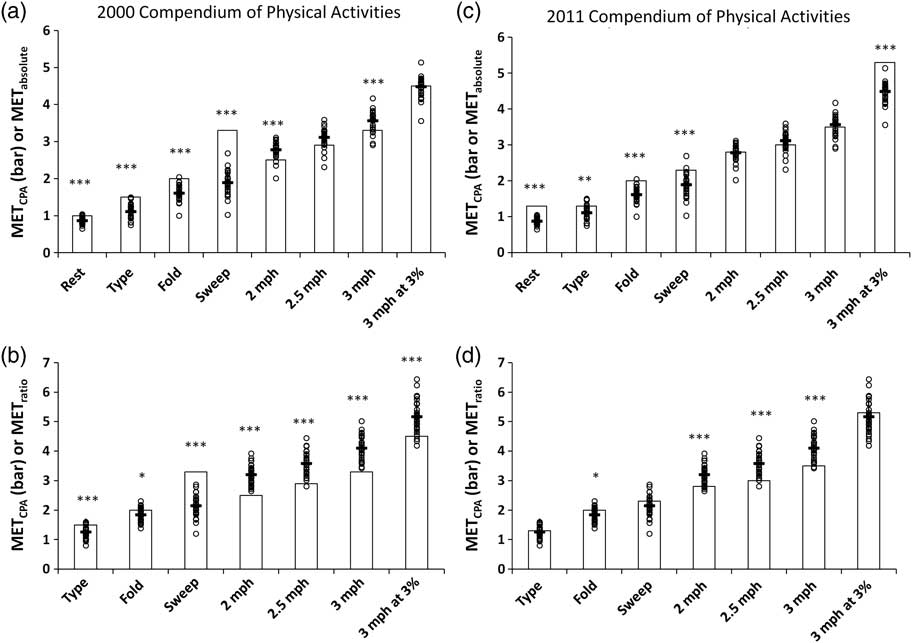
When one measured MET was defined as 3.5 ml O2/kg/min, METabsolute values were significantly different from the METCPA from the 2000 Compendium of Physical Activities (CPA) for all activities except walking at 2.5 mph, and 3.0 mph at a 3% incline (P < 0.0001). EE for ADL were overestimated (P < 0.0001), whereas walking was underestimated (P < 0.0001; see Fig. 1a). When the MET values from the 2011 CPA were compared with the METabsolute, level walking was not significantly different, however, ADL were significantly overestimated (P < 0.0005; see Fig. 1c).
Comparison of the published metabolic equivalents (MET) and energy expenditure (EE) measured by indirect calorimetry in pregnant women. METCPA is represented by the bar. The mean measured MET is represented by a horizontal line. Individual subject data points are shown for each activity as open circles. P-values are shown by asterisks above the graph where *P < 0.005, **P < 0.0005 and ***P < 0.0001. METCPA: Compendium MET; METabsolute: total oxygen consumption during an activity divided by 3.5 ml O2/kg/min; METratio: EE of the activity divided by the EE of rest; EEactivity: EE of the activity; EErest: EE at rest.

Ratio definition
When the measured MET was defined as the EE of an activity divided by EE at rest and compared with the corresponding MET values from the 2000 CPA, all ADL were significantly overestimated (P < 0.005) and walking at all speeds and inclines were significantly underestimated (P < 0.0001; see Fig. 1b). When the METratio was compared with the 2011 CPA values, typing and sweeping were not significantly different; yet, level walking remained significantly underestimated (P < 0.0001; see Fig. 1d).
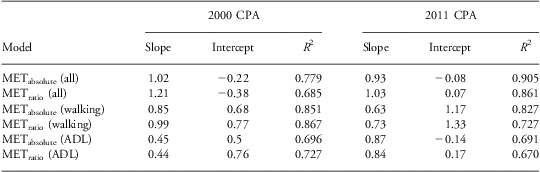
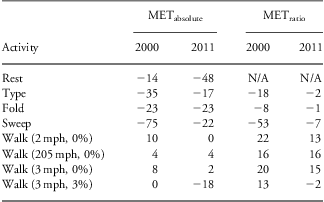
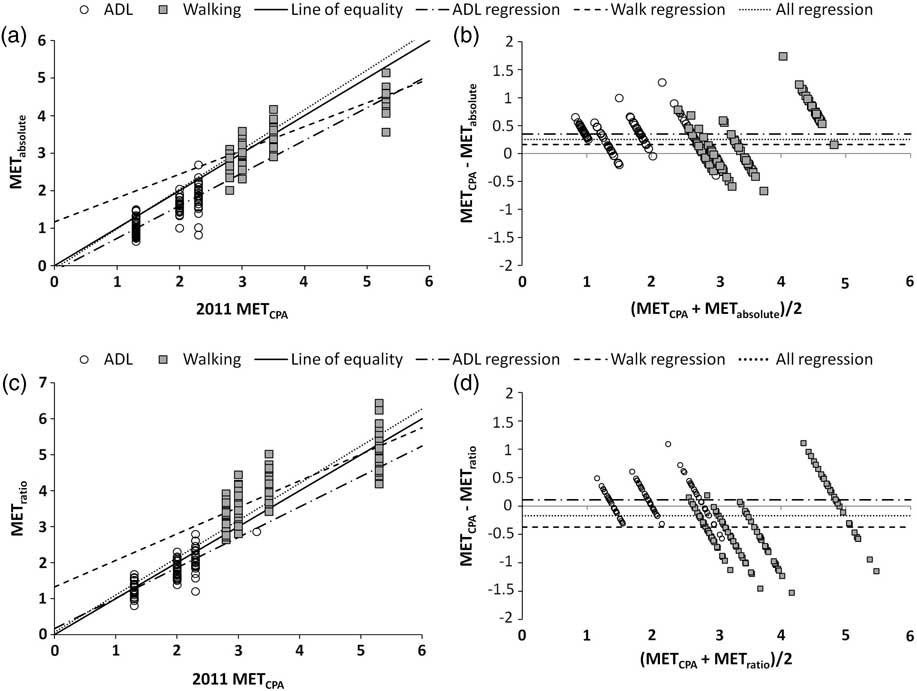
Regardless of how the MET was defined, the MET values from the 2000 and 2011 CPA correlated well with the measured EE (see Table 2). The differences between the METCPA and the measured MET values ranged from 22% underestimation to 75% overestimation (Table 3) and were non-linear for both definitions of the MET (METabsolute and METratio) for all activities (see Fig. 2a and 2c using 2011 CPA). Although the correlation between measured MET values and METCPA is strong (see Table 2), the residuals display the discrepancies between ADL and treadmill walking. The 2011 CPA values appear to overestimate for ADL when using the absolute definition (see Fig. 2b); yet, walking is underestimated with the ratio definition (see Fig. 2d; graphical representation of data compared with the 2000 CPA not shown). The differences in the regression equations (see Table 2) demonstrate that a single linear transform cannot correct compendium values to more accurately reflect measured IC values.
Regression parameters for Compendium v. IC

IC, indirect calorimetry; CPA, Compendium of Physical Activities; MET, metabolic equivalent; ADL, activities of daily living; EE, energy expenditure.
The METabsolute is the total oxygen consumption during an activity divided by 3.5 ml O2/kg/min. The METratio is the EE of the activity divided by the EE of rest. Slopes and intercepts of the regressions are the values required to transform a given Compendium MET (METCPA) to a measured EE by IC given by the equation: EEIC = METCPA × slope + intercept. The squared correlation coefficient (R 2) and the significance of the fits are also shown. All R 2 values are significant; P < 0.0001.
Magnitude of differences (%) between measured and Compendium MET

MET, metabolic equivalent; EE, energy expenditure.
The METabsolute is the total oxygen consumption during an activity divided by 3.5 ml O2/kg/min. The METratio is the EE of the activity divided by the EE of rest. The criterion was defined as the measured MET (METabsolute or METratio); therefore, negative values indicate overestimation.
Analysis of fit between the published metabolic equivalents (MET) and energy expenditure (EE) measured by indirect calorimetry for activities of daily living (ADL) and walking in pregnant women. Fig. 2a and 2b shows the regression and the Bland–Altman plot for the METCPA v. METabsolute using the 2011 CPA. Fig. 2c and 2d shows the regression and the Bland–Altman plot for the METCPA v. the METratio. Regressions (2a, 2c) are shown for all activities together (fine dotted line) as well as differentiated between ADL activities (open circles/dash-dot line) and treadmill walking (filled squares/dashed line) against the line of equality (solid line). Bland–Altman plots (2b, 2d) use the same representations except that the representative lines show average residual for all activities (fine dotted line), ADL activities (dash-dot line) and treadmill walking (dashed line). METCPA: Compendium MET; METabsolute: total oxygen consumption during an activity divided by 3.5 ml O2/kg/min; METratio: EE of the activity divided by the EE of rest; EEactivity: EE of the activity; EErest: EE at rest.

Discussion
The purpose of this study was to assess the accuracy of the CPA to predict EE in early pregnancy. Results of this study demonstrate that the MET published in either version of the CPA overestimates EE of the ADL tested and underestimates EE of treadmill walking at certain speeds in pregnant women. The estimation of EE is improved with the use of new codes published in the 2011 CPA. The intent of the CPA was not to estimate EE of all subjects irrespective of physical or metabolic conditions.Reference Ainsworth, Haskell and Whitt 12 Despite this fact, the METCPA is commonly used to predict and assess EEReference Schmidt, Freedson and Pekow 17 – Reference Borodulin, Evenson, Wen, Herring and Benson 20 and is a component of PA recommendations.Reference Zavorsky and Longo 26 , Reference Cohen, Plourde and Koski 27 To address these differences in relative EE across the life cycle, new compendia have been developed for other special populations, including children,Reference Ridley, Ainsworth and Olds 28 and the current study demonstrates that pregnant women may also require a separate compendium.
BMR has been shown to increase as pregnancy progresses.Reference Forsum, Löf and Schoeller 16 , Reference Butte, Wong, Treuth, Ellis and O'Brian Smith 29 , Reference Butte, Hopkinson, Mehta, Moon and Smith 30 In a review by Butte based on 261 women from eight studies, it was found that the average increase in BMR was 4%, 10% and 24% during the first, second and third trimesters, respectively.Reference Butte 31 However, this increase in BMR is not always predictable and it may even decrease during the first part of pregnancy and persist into the second half of pregnancy.Reference Butte 31 Using a one-size-fits-all approach to predict EE in pregnant women may be confounded by this change in BMR. For example, if resting EE increases but the cost of activities do not, the ratio of EE of an activity to rest would narrow, and a given activity would have a lower MET value.Reference Forsum and Löf 11 , Reference Prentice, Spaaj and Goldberg 32 If the energy cost of resting EE remains constant but the cost of PA increases, the MET in pregnancy would increase. Although this study was conducted at early pregnancy there are still differences between measured EE and published MET values.
This study demonstrates that while the METCPA appears to provide an overall good correlate to EE in pregnancy, it may not be accurate enough to use unmodified for PA assessment in pregnant women. These findings are in agreement with the work published by Chasan-Taber et al.Reference Chasan-Taber, Freedson, Roberts, Schmidt and Fragala 15 Differences in MET values were observed during pregnancy for four household tasks (window washing, dusting, vacuuming and laundry). Mean MET values differed from the respective METCPA values by as much as 43% higher than the METCPA for laundry and 23% lower than the METCPA for vacuuming. No significant differences in measured MET values were found across trimesters, further supporting our findings in early pregnancy.
Our study represents how the ambiguity regarding the definition of the MET (either an absolute measure of EE or a ratio of activity EE to rest) can provide different MET values for the same activity (see Table 1). Research has shown that the standard MET for rest (3.5 ml O2/kg/min) is generally inappropriate for most individuals.Reference Byrne, Hills, Hunter, Weinsier and Schutz 33 , Reference Kozey, Lyden, Staudenmayer and Freedson 34 Additionally, the resting MET value of the pregnant women evaluated in the current study was significantly different than the resting MET value reported in either CPA (see Table 1). Until more is known about the MET in pregnancy, it is important to approach MET levels using both definitions. 24 , Reference Kozey, Lyden, Howe, Staudenmayer and Freedson 25
The findings in this study illustrate distinct disparities between measured METs and those published in the CPA, and these disparities have important implications. The METCPA overestimates EE for the measured ADL yet underestimates the EE of walking. These differences are small, but since light intensity activities are engaged in for very large portions of the day, the difference could cause substantial overestimation of a woman's total daily EE. For example, using the 2011 METCPA to assess the daily EE of a 64 kg test subject (the average pre-pregnancy weight of our sample), for a typical 24-hour day including 8 h of sleep (1.0 kcal/kg/h × 64 kg × 8 h), 15 h of light intensity activities (2.0 kcal/kg/h × 64 kg × 15 h) and 1 h of moderate exercise (3.5 kcal/kg/h × 64 kg × 1 h), EE would equal 2656 kcals. Estimating EE with the measured MET (METabsolute) equates to 2231 kcals per day [(0.875 kcal/kg/h × 64 kg × 8 h) + (1.62 kcal/kg/h × 64 kg × 15 h) + (3.57 kcal/kg/h × 64 kg × 1 h)]. Overall, for our example, use of the METCPA results in an overestimation of ∼425 kcals. If the METCPA values were used in an epidemiological setting to assess associations between maternal exercise and chronic disease, this overestimation of EE could result in inappropriate conclusions concerning the effects of prenatal PA.
The non-linear nature of the fits between the measured MET values and METCPA presents a particular problem. If the fits were linear (i.e. if they overestimated across the entire spectrum of activity), a correction factor could be applied and the METCPA could be linearly transformed to give a representation of the MET during pregnancy. Our study showed that this is not the case. As there is an imbalance in the time spent in light activity v. more intense activity, these errors cannot be expected to ‘average each other out’. The pregnant women we tested expended different MET values than the CPA; however, it remains to be determined whether these differences are due to pregnancy or simply being female.Reference Forsum, Löf and Schoeller 16 Future studies will need to distinguish the role that these factors have on prediction of EE in pregnant and non-pregnant women.
This study had limitations. We chose relatively few activities for measurement, yet we selected a range of activities that reflected typical activities and MET levels that pregnant women would engage in throughout the day. Additional ADL as well as higher intensity tasks should be evaluated in future studies. The activities were conducted in a laboratory environment to provide a controlled setting to minimize additional variables that could increase measurement error. Finally, the participants were tested during early pregnancy and the sample population was limited in terms of race and BMI.
Prediction of EE in pregnant women is improved with the use of the 2011 CPA. The disparity that exists between the METCPA and measured EE is significant and non-linear; therefore the MET, as described in the CPA, may be inappropriate to quantify PA in pregnant women. Prenatal public health recommendations rely on an accurate assessment of PA. Considering the potential health ramifications of over- or underestimating EE during pregnancy and the association with future chronic disease, additional work is needed to more accurately assess prenatal PA. There is a need for pregnancy-specific MET values, or modified obstetric MET, MOM-E. The MOM-E could be utilized in research and clinical settings to evaluate and promote PA as a means to achieve appropriate weight gain, healthy babies and ultimately impact the obesity epidemic.
Acknowledgements
The authors thank all the subjects who participated in this study as well as the staff in Dr Christina Campbell's laboratory who assisted with data collection.