Mastitis in cows is defined as an inflammation of the udder usually caused by infection. It is of significant importance to farmers owing to the economic impact caused by reduced milk yields and costs associated with treatment (Seegers et al. Reference Seegers, Fourichon and Beaudeau2003). One of the commonly accepted indications of mastitis is the somatic cell count (SCC) in the milk. SCC is the level of both epithelial cells and white blood cells per millilitre of milk. With an infection or inflammation the white blood cell level rises, thus causing an elevated SCC (Whyte, Reference Whyte, Walmsley, Liew, Claycomb and Mein2005).
Farmers have significant incentive to manage their cows' SCC level. However, until recently farmers have been unable to directly measure SCC levels on the farm. In the last few years a few systems have been developed that give farm-based measurements of SCC; these include: DNA staining and epi-florescence (Lind & Markusson Reference Lind and Markusson2007); enzymic reactions on a dip stick (Rauch et al. Reference Rauch, Zadoks, Welcome and Schukken2007); and an automated and standardized California Mastitis Test (Whyte et al. Reference Whyte, Orchard, Cross, Wilson, Claycomb and Mein2004).
The California Mastitis Test (CMT) was developed in 1957 and is used throughout the world as a qualitative cow-side test for subclinical mastitis. The test involves mixing an anionic surfactant with milk after which the cells react with the surfactant to increase the viscosity of the mixture which is proportional to the SCC (Schalm & Noorlander, Reference Schalm and Noorlander1957). During the 1960s and early 1970s work was undertaken to investigate the biochemical (Nageswarao & Derbyshire, Reference Nageswarao and Derbyshire1969) and rheological (Whittlestone & Fell, Reference Whittlestone and Fell1965; Milne & Smyth, Reference Milne and Smyth1976) properties of the CMT gel. With the advent of inexpensive, simple and automated epi-florescence counting devices in the 1970s (Kelley, Reference Kelley1978), it became less important to understand the properties of the CMT gel. However, this has changed with the automation of the CMT test.
Understanding the rheological properties of the CMT gel is important in the design and operation of the automated CMT. The purpose of this paper was to further investigate the basic rheology of the CMT gel; firstly to determine whether the CMT gel is truly rheopectic and secondly to determine whether capillary tube viscometry could be used to study the viscosity of the CMT gel. Capillary viscometry was selected because it most closely resembles the actual sensor design, whereas rotational viscometry is a convenient way of studying time-dependent behaviour.
The viscosity of milk can be measured using a diversity of viscometers. The appropriate device (capillary, rolling ball, rotational viscometer) chosen depends on the range of viscosity to be measured. Normally, milk exhibits Newtonian behaviour. A Newtonian fluid exhibits a constant viscosity with respect to shear rate, whereas a non-Newtonian fluid's viscosity may be time and shear dependent.Non-Newtonian behaviour in raw milks and creams is seen under conditions that favour cold agglutination of fat globules (temperature <40°C) and low shear rates. Shear thinning is commonly observed under these conditions (Singh et al. Reference Singh, McCarthy, Lucey and Fox1997). In addition, non-Newtonian behaviour has also been observed when surfactants interact with somatic cells present in milk obtained from cows with mastitis (Whyte et al. Reference Whyte, Walmsley, Liew, Claycomb and Mein2005). Protein typically shows some interaction with sodium dodecal sulphate (SDS) as well as being denatured by it (Garrett & Grisham, Reference Garrett and Grisham2005). However, the protein/SDS complex only increases to a limited extent and does not contribute to the non-Newtonian fluid found in CMT gel. As a result, milk/surfactant solutions not containing somatic cells only exhibit Newtonian fluid behaviour.
When there are enough somatic cells in milk, cells can interact with the surfactant to form a gel, which might change the milk/surfactant solution from a Newtonian fluid to a non-Newtonian fluid. For instance, when an anionic surfactant (e.g. SDS) is introduced to milk with a high SCC, it forms a gel displaying a complex time- and shear-dependent rheology. Whyte et al. (Reference Whyte, Walmsley, Liew, Claycomb and Mein2005) confirmed that CMT gel exhibited non-Newtonian behaviour and more specifically, the non-Newtonian behaviour was shown to be viscoelastic, rheopectic as well as rheodestructive, when using Brookfield viscometry. A visoelastic fluid exhibits a time-dependent viscosity change under shear, i.e., strain changing with time, as well as elastic behaviour, i.e., linear change in strain upon the application of shear. Rheopecticity is a time-dependent change in viscosity under a constant shear rate, whereas a rheodestructive fluid shows a decrease in viscosity over time at constant shear rate.
Materials and Methods
California Mastitis Test
The reagent in the CMT was SDS supplied by Merck Schuchardt OHG, Germany. SDS was chosen as it is a readily available, standardized surfactant owing to its use in protein analysis in biochemistry. It was also the reagent used in previous studies (Whyte et al. Reference Whyte, Walmsley, Liew, Claycomb and Mein2005). SDS solutions were prepared using distilled water at concentrations of 1, 3, or 6% (w/w). Gelation was investigated using either rotational or capillary viscometry by monitoring viscosity change.
Milk samples
Milk was collected from a local pasture-based research farm (Greenfields, Dexcel Hamilton, New Zealand), either from bulk storage or individual cows. In the case of low-SCC milk, samples were taken from a continuously stirred vat. Samples were stored below 4°C until tested. In the case of medium- and high-SCC milk, samples were obtained by using an automatic milking system targeting just the infected udder-quarter. Subsamples for SCC analysis were taken immediately and the remaining milk was cooled to below 4°C until tested. SCC were obtained from a local herd testing agency (LIC, Hamilton, New Zealand) using epi-florescent flow cytometry using milk obtained directly from the vat and tested the same day of collection. These readings could then be used as calibration in relating viscosity to SCC.
Subsamples for viscosity measurement were taken from refrigerated milk and stabilized in a temperature-controlled room at 20°C. Prior to sampling, milk was mixed to ensure homogenization.
Capillary viscometry
Milk (6·5 ml) was mixed with the same volume of surfactant solution by separately introducing each to the Ubbelohde viscometer (model no. 1B M432). Thirty seconds were allowed for mixing and handling before the efflux time was measured. A viscosity relative to that of water at 25°C was reported as the ratio of the respective efflux times of milk and water, called the relative viscosity, which is a dimensionless number. All measurements were made at 20°C, in a temperature-controlled room and a minimum of two replicates at each time interval were taken. For each replicate, enough milk was taken to allow each measurement to be repeated ten times. In some of the experiments, measuring the efflux time was delayed for a predetermined time (called delay time) to characterize the time taken for sufficient gelation to occur. A similar approach was taken in rotational viscometry as a comparative study.
Rotational viscometry
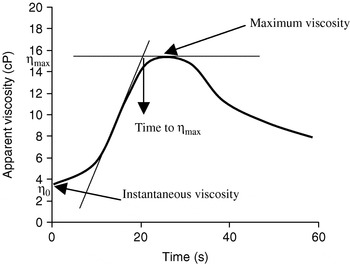
Milk (300 ml) was mixed with an equal volume of surfactant solution. A Brookfield digital viscometer (model DV-II, LV-1 spindle) was used at various rpm (12, 30 or 60 rpm) as appropriate for each individual experiment. All milk samples tested had a SCC of 79×103 cell/ml. For each experiment, enough milk was collected to allow two replicates from the same milk sample. Values reported are therefore an average of two tests, which do not allow calculation of sd. Apparent viscosity was logged every second for up to 6 min. Apparent viscosity v. time plots very closely resembled the mathematical relationship,  . The experimental data were fitted using the least squares method, by adjusting the constants a, b, c and n, but only the fitted curves are shown, for clarity. A maximum apparent viscosity was then determined as ηmax=b+c. The time to reach ηmax was estimated by linearly extrapolating time from the inflection point,
 , using the slope of the curve at that point to the time it took to reach ηmax, as shown in Fig. 1.
Apparent viscosity of a typical gel formed during the California Mastitis Test.

Results and Discussion
Rotational viscometry
It was previously established (Whyte et al. Reference Whyte, Walmsley, Liew, Claycomb and Mein2005) that when rotational viscometry is used to monitor the viscosity of the gel formed during the CMT, it takes a certain amount of time for the gel to reach a peak viscosity, whereafter the gel starts to break down again, resulting in a reduction in viscosity (see Fig. 1). In this paper, the viscosity was only measured until peak viscosity was reached and for a short time following the maximum. It was previously thought that the gel was a non-Newtonian fluid exhibiting rheopectic properties during the time leading to the maximum viscosity (Whyte et al. Reference Whyte, Walmsley, Liew, Claycomb and Mein2005). Rheopectic behaviour is a time-dependant increase in viscosity under a constant shear rate, i.e., formation of structure that leads to an increase in viscosity due to the influence of shear. However, it is the authors' view that the rise in viscosity is due to the gelation reaction during that time, giving rise to an increase in viscosity. The maximum viscosity and the time it takes to reach that viscosity may be dependent on mixing and gelation conditions. One way to test this is to vary the shear rate during gelation.
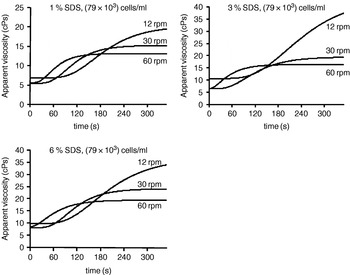
In Fig. 2 the effect of different spindle speeds (shear rate) on apparent viscosity was investigated at different SDS concentrations. From the figure two main observations are clear: an increase in shear rate (higher rpm) leads to a reduction in the maximum apparent viscosity (ηmax); and an increase in shear rate leads to a shorter time to reach ηmax.
Apparent viscosity at various SDS concentrations and spindle speeds with milk containing about (79×103) cells/ml. A, 1% SDS; B, 3% SDS; C, 6% SDS.

These results indicate that the gel formation is altered by measurement and/or mixing conditions. Therefore, any sensor device would need to hold these conditions constant. In a dairy-shed operation, where sample turn around time is important, it would seem to indicate that better mixing or a higher shear rate would give a faster result, but would sacrifice sensor resolution.
The results, however, do not clarify the question whether or not the viscosity of the gel during the formation stage is rheopectic, or whether the reaction is simply influenced by the improved mixing expected at higher shear rates. To clarify this further, a series of experiments was performed where the reagent was mixed with high-SCC milk and the viscosity measurement was delayed for a predetermined time to allow some gelation to occur without the mixing that occurs during testing. In other words, the chemical reaction that occurred would be amplified before the effect of shear was introduced during mixing.
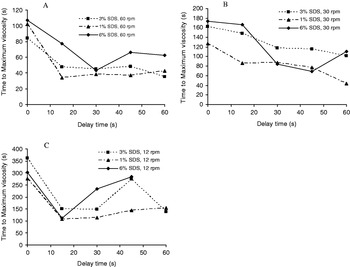
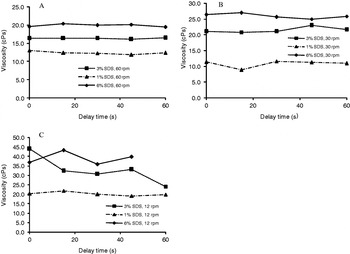
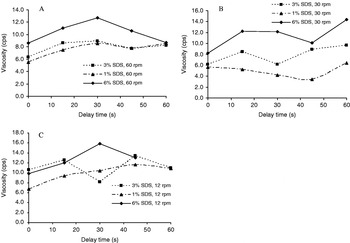
From Figs 3 and 4 the main observations are as follows. The maximum viscosity decreases with increasing shear, as in previous results. The time taken to reach the maximum apparent viscosity (ηmax) is affected by the delay time and shear rate. At high shear the time to reach ηmax reduces significantly, but levels off after about 15–30 s. At intermediate shear rate, the time to reach ηmax decreases with increasing delay time. At 12 rpm no clear trend is visible regarding the time to reach ηmax and that would indicate that delay time does not influence gel formation when very low shear rates are used, corresponding to the low spindle speed. The nature of the trends presented in Figs 3 and 4 vary slightly between the various SDS concentrations, but is without consequence because of variability between samples tested.
Effect of delay time on the gel's apparent viscosity at different of shear rates and SDS concentrations. A, 60 rpm; B, 30 rpm and C, 12 rpm.

Effect of delay time on the gel's maximum apparent viscosity, at different shear rates and SDS concentrations. A, 60 rpm; B, 30 rpm and C, 12 rpm.

Shear restricts gel formation as evident from the fact that a delay time of 30 s causes a reduction in time to reach ηmax of greater than 30 s. In other words, when milk and reagent are mixed and shear is applied immediately, the gel takes the longest to form. However, if the milk and reagent are left to react, without applying shear, gelation is shorter. It is interesting to note that, by applying a delay to the system, the total time to reach ηmax is decreased. Therefore, in order for a sensor to have a rapid turn-around time, milk and reagent should be mixed and left to stand before measurement and should not be mixed continuously.
The decrease in ηmax as a result of increasing shear rate (Fig. 4) therefore shows that the maximum apparent viscosity is shear thinning. In other words, at increasing shear rates, but constant over time, the apparent viscosity decreases.
Rheopecticity means a time-dependent increase in viscosity under the influence of shear. What was observed here is a time-dependent increase in viscosity due to a chemical reaction, which is influenced by mixing or shear rate.
For the time-dependence under shear to be rheopectic, one would expect the maximum viscosity to be influenced by delay time since the gel would be exposed to shear for a shorter time. However, from Fig. 4 it can be seen that ηmax is mostly unaffected by delay time, irrespective of shear rate. This would indicate that the CMT reaction is not rheopectic.
Lastly, the instantaneous viscosity (η0) can be considered. If gelation is occurring regardless of the presence of shear, one would expect to see an increase in instantaneous viscosity when a delay time is introduced because gel formation would be almost complete by the time viscosity measurement starts. Figure 5 shows that in most cases η0 increased slightly and was also independent of shear rate. Therefore, it is not the influence of shear that causes the viscosity increase, but rather the gelation reaction, showing that the gel is not rheopectic.
Effect of delay time of the gel's instantaneous viscosity, at different shear rates and SDS concentrations. A, 60 rpm; B, 30 rpm and C, 12 rpm.

To explore further the rheology of the CMT gel, rotational viscometry was compared with capillary viscometry.
Capillary viscometry
Using a Ubbelohde tube, the efflux time of a fluid, that is the time for the fluid to flow out of the capillary, is measured and the viscosity is reported relative to that of a solvent such as water. Conventionally, dilute capillary viscometry is used to determine the molecular mass of polymers given the proportionality between intrinsic viscosity (viscosity at zero concentration) and molecular mass. In the present study, however, the fluid was tested undiluted as it resembled the actual sensor device, for which the relationship between viscosity and SCC was used. Moreover, the shear rate in the capillary tube was much higher than can be achieved in the rotational viscometer, effectively giving additional information regarding the shear dependence of the CMT gel. Given the high shear, one can therefore expect a lower sensitivity, as shown by the generally lower viscosity values measured with rotational viscometry at high shear rates.
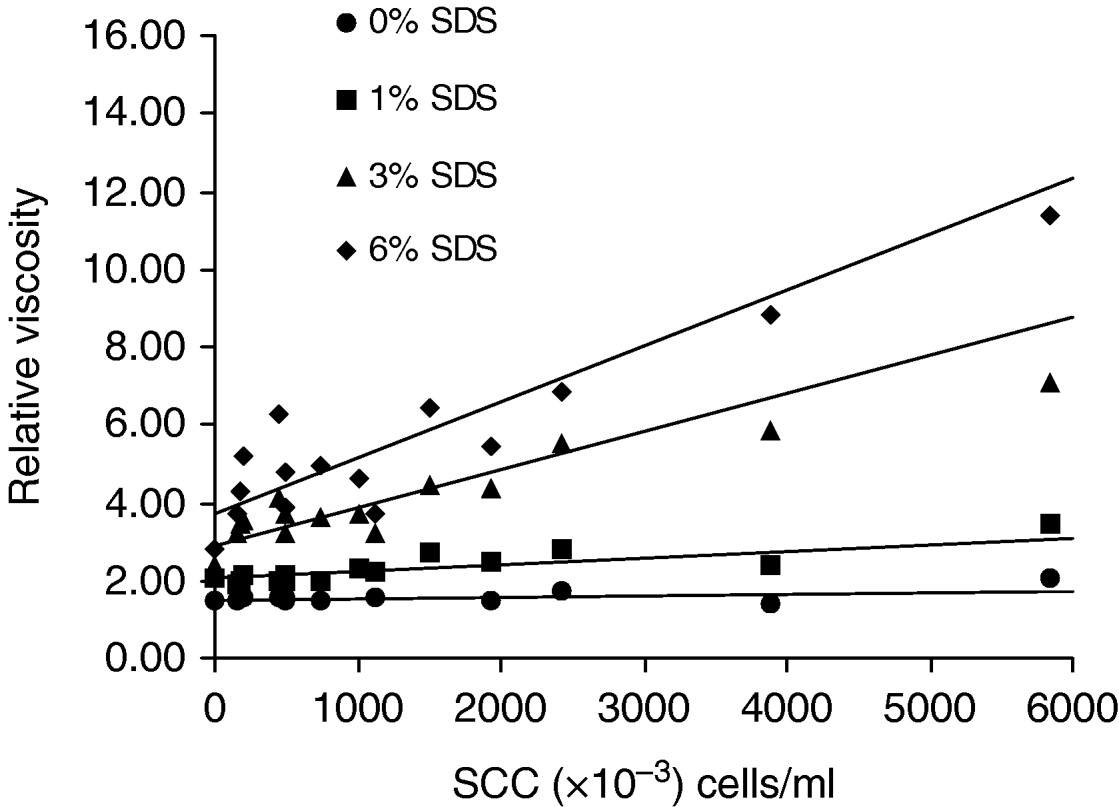
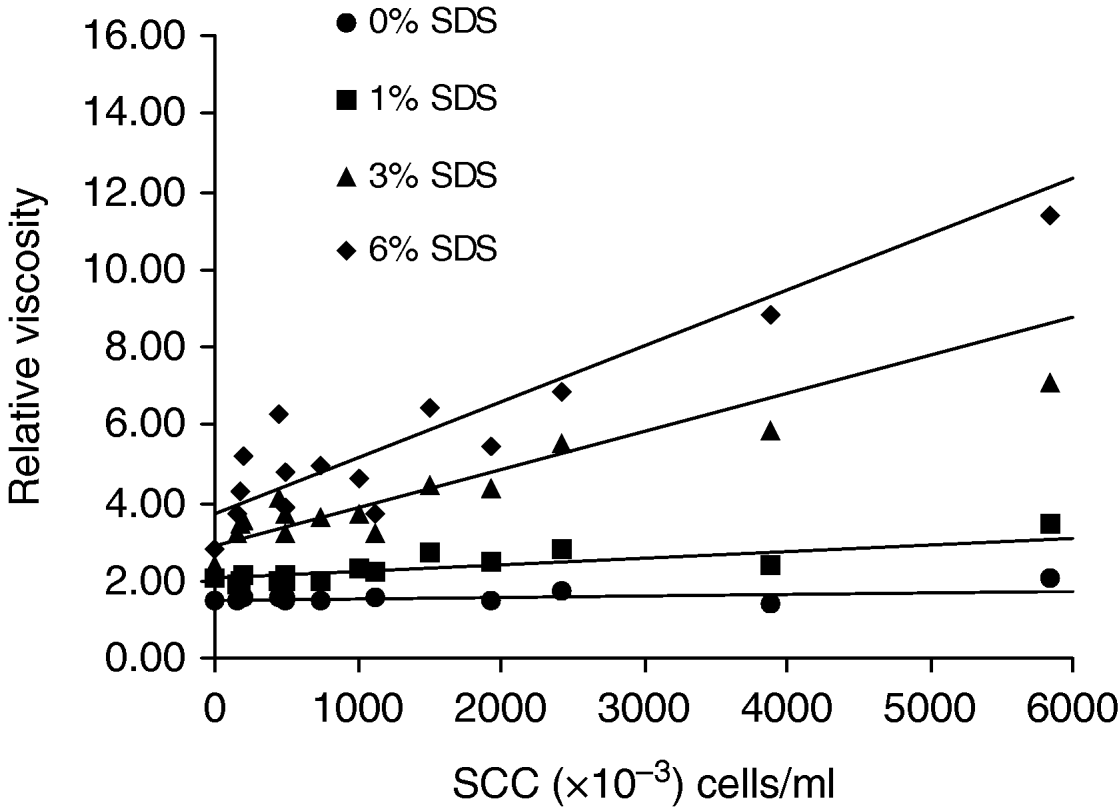
As an initial validation, the correlation between SCC and viscosity was confirmed using a Ubbelohde viscometer. Three levels of surfactant concentration were used with various levels of infected milk. All milk samples were tested independently using Foss analysis. From Fig. 6 it can be seen that SCC and relative viscosity correlates linearly over a wide range of SCC, but at cell counts of less that 105 cells/ml and SDS concentrations of less than 3%°(w/w), the correlation is less effective.
Correlation between Somatic cell count (SCC) and relative viscosity.
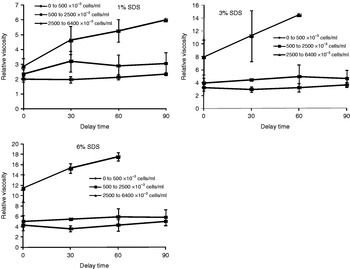
To compare capillary viscometry with rotational viscometry, the effect of a delay time before measuring efflux time was investigated. In Fig. 7 the effect of delay times of up to 90 s are shown, not including the 30 s it takes for preparation of the mix (effectively introducing an additional 30-s delay).
Effect of delay time on the relative viscosity.

From Fig 7 several points are clear. The relative viscosity is only affected by delay time above a threshold SSC of 2·5×106 cell/ml. At low SCC the extent of gelation is too low to cause a significant change in viscosity, even if additional time is allowed for the reaction to take place. This is most likely due to less DNA being available from the reduced amount of lysed cells present at lower SCC, suggesting that the resulting gel was destroyed by the high shear rate. This corresponds well with shear thinning behaviour, observed earlier in this paper. Above the threshold the relative viscosity increases with an increase in delay time. The increase in delay time supports the earlier observation that the instantaneous viscosity should increase with longer delay times, since gelation would have occurred to a larger extent.
Conclusions
By exploring the non-Newtonian behaviour of the gel using rotational viscometry, further insight was gained regarding the rheology of the CMT gel, especially during the gelation stage. The rheology during this stage is not rheopectic, as others had proposed, but it is simply developing a structure due to gelation.
The maximum apparent viscosity is shear-rate dependent, having implications for sensor operation during the gel formation and measurement stage.
The maximum apparent viscosity is independent of the time allowed for gelation without mixing caused by the measurement action. The time it takes to reach this maximum was found to be highly dependent on the delay time, thereby indicating that the milk sample and reagent should not be mixed continuously prior to viscosity measurement.
Of all the standard rheology measurement techniques, capillary viscometry is the most similar to the actual geometry of the first commercially available in-line SCC sensor (Sensortec Ltd, Hamilton, New Zealand). It can be concluded that capillary viscometry is indeed appropriate for correlating SCC with CMT-gel viscosity. The correlation was more accurate at cell counts above 105 cells/ml.
The reagent concentration strongly affects the correlation coefficient. A concentration of at least 3% SDS is required in the reagent.
The authors thank Sensortec Ltd and The Foundation for Science and Technology, New Zealand for funding the project as well as Dexcel, Hamilton for supplying milk samples.