Introduction
Dietary fat and its influence on pig fat depots have been studied for many years. First as an important energy source, second because of its implications in meat characteristics and more recently because its fatty acid (FA) composition has important implications in human health. Saturated fatty acids (SFAs) and type of SFAs are important, and also the n-6 : n-3 ratio (ratio between linoleic and linolenic acids ingested) is a risk factor in coronary diseases (Simopoulos, Reference Simopoulos2001) and cancer (Larsson et al., Reference Larsson, Kumlin, Ingelman-Sundberg and Wolk2004).
Pig fat is distributed mainly in four fat depots: visceral fat, subcutaneous fat, intermuscular fat and intramuscular fat. Several studies have shown that dietary fat modifies tissue fat composition, especially diets rich in polyunsaturated fatty acid (PUFA). Tissue FA composition is not modified to the same extent in the different locations and in different depots. It seems, as observed by different authors (Dean and Hilditch, Reference Dean and Hilditch1933; Monziols et al., Reference Monziols, Bonneau, Davenel and Kouba2007), that the increase in saturation of the backfat goes in parallel with the increase in body temperature. Different studies have focused on the effect of dietary FA composition on different fat depots (Brooks, Reference Brooks1971; Eder et al., Reference Eder, Nonn and Kluge2001), but an extensive study has not been performed using a wide range of dietary fat sources and fat depots. The objectives of the present study were to determine the effect of dietary fat source on the FA composition of different swine tissues and to study the differential tissue FA partitioning.
Material and methods
Animals and diets
Experimental procedures were approved by IRTA’s ethical committee. Crossbred female pigs (Duroc ♂ × Landrace ♀) were fed a barley-corn-soybean meal-based diet during a 4-week pre-experimental period. Five gilts were slaughtered at the beginning of the trial as an initial reference value for tissue FA composition. Seventy gilts (61.8 ± 5.2 kg BW) were assigned randomly by animal weight and litter to one of seven dietary treatments (10 animals per treatment). Gilts were divided in 10 animals per treatment in four separated periods/series of three, two, two, and three gilts per treatment. Pigs were penned individually and had ad libitum access to feed and water. Pigs were transported to the slaughter facilities approximately 14 h before slaughter and were held off-feed and had access to water during lairage. Gilts (99.8 ± 8.5 kg BW) were humanely harvested using CO2 stunning following standard procedures of an officially inspected facility. Intramuscular, intermuscular and subcutaneous fat samples from longissimus thoracis (LT) and semimembranosus (SM) muscles, and intermuscular and subcutaneous fat samples from the belly (B) were removed at 24 h post mortem, vacuum packaged and frozen at −20°C until analysis.
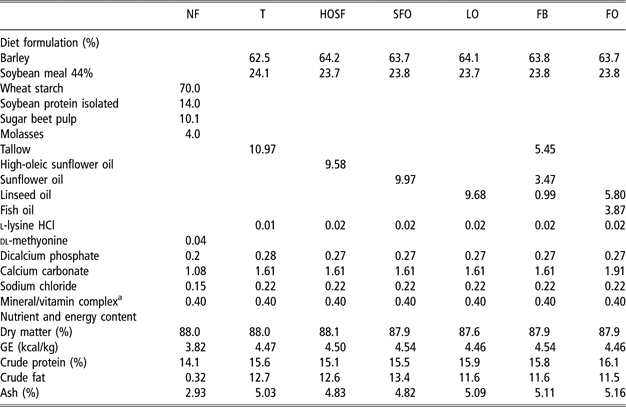
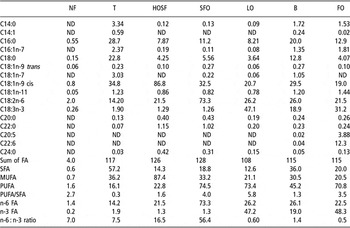
Diets were formulated to meet NRC (1998) requirements (Table 1). Six fat-supplemented diets (containing 10% to 11% fat in total) were based on barley and soybean meal. Additionally, a semi-synthetic diet was formulated using ‘purified’ ingredients to contain no fat (NF) because traditional diets with NF addition always contain around 2% of dietary fat. Different fat sources were selected to obtain different FA composition of the diets (Table 2): tallow (T), high-oleic sunflower oil (HOSF), sunflower oil (SFO), linseed oil (LO), fat blend (55% tallow, 35% SFO, 10% LO) (FB) and fish oil blend (40% fish oil, 60% LO) (FO). The NF diet was formulated to contain a very low fat level. The T diet was intended to have a high content in SFA, the HOSF diet was intended to have a high level in oleic acid, the SFO diet was intended to have a high content in linoleic acid and the LO was intended to have a high content in linolenic acid. The FB diet was intended to have a similar content in the main FA (palmitic, stearic, oleic, linoleic and linolenic acids). The FO diet was intended to have a high content in long PUFA. The amount of fat included in each diet was slightly different in order to supply equal amounts of digestible fat based on lipid digestibility results observed previously (Duran-Montgé et al., Reference Duran-Montgé, Lizardo, Torrallardona and Esteve-Garcia2007).
Diet composition and nutrient content
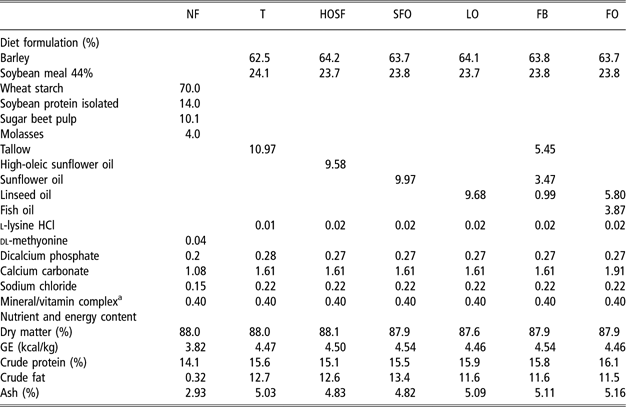
NF = no fat; T = tallow; HOSF = high-oleic sunflower oil; SFO = sunflower oil; LO = linseed oil; FB = fat blend (55% tallow, 35% sunflower oil and 15% linseed oil); FO = fish oil blend (40 fish oil and 60% linseed oil); GE = gross energy.
aOne kilogram of feed contains the following: vitamin A = 5000 IU; vitamin D3 = 1000 IU; vitamin E = 15 mg; vitamin B1 = 1.3 mg; vitamin B2 = 3.5 mg; vitamin B12 = 0.025 mg; vitamin B6 = 1.5 mg; calcium pantothenate = 10 mg; nicotinic acid = 15 mg; biotin = 0.1 mg; folic acid: 0,6 mg; vitamin K3 = 2 mg; Fe = 80 mg; Cu = 6 mg; Co = 0.75 mg; Zn = 60 mg; Mn = 30 mg; I = 0.75 mg; Se = 0.10 mg; ethoxiquin = 0.15 mg.
Fatty acid content of experimental diets (mg/g)

FA = fatty acids; SFA = saturated FA; MUFA = monounsaturated FA; PUFA = polyunsaturated FA.
Diets: NF = no fat; T = tallow; HOSF = high-oleic sunflower oil; SFO = sunflower oil; LO = linseed oil; FB = fat blend (55% tallow, 35% sunflower oil and 15% linseed oil); FO = fish oil blend (40 fish oil and 60% linseed oil); ND = not detected.
Analysis
Diets were analysed for dry matter (DM) content, crude protein (CP), energy, ash and FA. The DM content, ash and energy were determined according to AOAC (1990), and CP by Dumas (AOAC, 2000). For FA determination in tissues, lipids were extracted following the Folch method (Folch et al., Reference Folch, Lees and Stanley1957) and then transmethylated with BF3 and methanolic KOH (Morrison and Smith, Reference Morrison and Smith1964). FA contents were determined using an automated GC (Hewlett Packard 6890, USA) equipped with an automatic injector, using C19:0 as the internal standard.
Statistics
The following statistical model was applied for a preliminary examination of results:

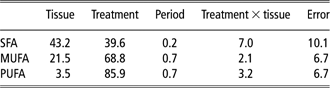
where X is the observation (FA profile) in the jth period from the kth tissue, μ the overall mean, αi the fixed dietary treatment effect, βj the fixed effect of period, γk the fixed tissue effect and χik the treatment × tissue interaction effect. This model with 10 (tissues) and seven (treatments) gave 2415 comparisons for each FA, which was considered impractical, but it was interesting to observe the contribution of each parameter to the final observation and evaluate the treatment × tissue interaction. The specific weight of each factor was calculated (Table 3) as described by Little (Reference Little1981).
Source and contribution (%) to variability of the studied effects on FA profile
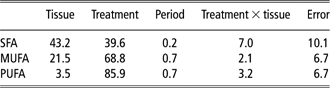
FA=fatty acids; SFA = saturated fatty acids; MUFA = monounsaturated fatty acids; PUFA = polyunsaturated fatty acids.
Interactions between dietary fat source and fat tissue were small, and data were further analysed and discussed as main effects using the following models:

where Y is the observation (FA profile), μ the overall mean, αi the fixed treatment effect and ε the residual errors:

where Z is the observation (FA profile), μ the overall mean, γk the fixed tissue effect and ε the residual errors. Individual comparisons with the Duncan test were performed when P value < 0.05. Root mean square error (RMSE) was not calculated in n-3 series FA as comparisons were done on arcsine values because of the great difference that existed between treatments.
Results and discussion
Tissue fat content
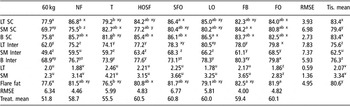
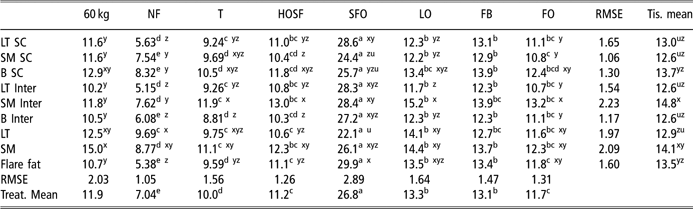
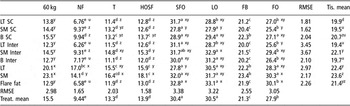
Results are shown in Table 4. In tissues with a high fat content (LT subcutaneous fat, SM subcutaneous fat, belly subcutaneous fat and flare fat), there were treatment differences. In LT subcutaneous fat, belly subcutaneous fat and flare fat, T-fed pigs had a lower fat content (P < 0.05). Interestingly, in other tissues (LT intramuscular fat, SM intramuscular fat and SM subcutaneous fat) T tended to have higher fat content, suggesting a different partitioning of fat in tissues due to dietary fat composition. Comparing between tissues, fat content showed clear differences; subcutaneous and flare fat had the highest fat content, next was intermuscular fat and finally it was intramuscular fat.
Tissue fat content (wt%)

Diets: NF = no fat; T = tallow; HOSF = high-oleic sunflower oil; SFO = sunflower oil; LO = linseed oil; FB = fat blend (55% tallow, 35% sunflower oil and 15% linseed oil); FO = fish oil blend (40 fish oil and 60% linseed oil).
Tissues: LT SC = longissimus thoracis subcutaneous fat; SM SC = semimembranosus subcutaneous fat; B SC = belly subcutaneous fat, LT Inter = longissimus thoracis intermuscular fat; SM Inter = semimembranosus intermuscular fat; B Inter = belly intermuscular fat; LT = longissimus thoracis intramuscular fat; SM = semimembranosus intramuscular fat.
Treat. mean = treatment mean; Tis. mean = tissue mean.
Diets with different letters in rows (a, b, c, d, etc.) and tissues with different letters in columns (x, y, z, u, etc.) were significantly different (P < 0.05).
RMSE = root mean square error.
Effect of tissue
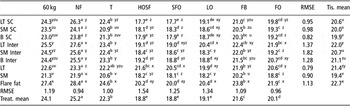
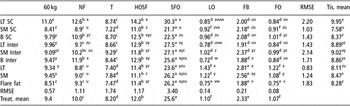
Palmitic acid (Table 5) did not show important differences between tissues; the main differences were observed in flare fat, showing higher contents compared with other tissues except for HOSF- and SFO-fed animals that showed high contents of palmitic acid in LT, and LO-fed animals that had high palmitic content in LT intermuscular fat.

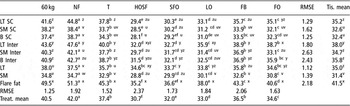
Stearic acid (Table 6) showed greater differences between tissues; it was especially high in flare fat and tended to be low in subcutaneous fat compared with intramuscular and intermuscular fat depots. Stearic acid content tended (P < 0.1) to be higher in LT subcutaneous and intermuscular fat tissues compared with belly and SM subcutaneous and intermuscular fat depots, respectively.

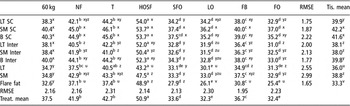
SFAs, including palmitic and stearic acids, showed the highest contents in flare fat, followed by intermuscular fat, with subcutaneous and intramuscular fat showing the lowest values (Table 7). This observation is in line with the hypothesis of Dean and Hilditch (Reference Dean and Hilditch1933) and Monziols et al. (Reference Monziols, Bonneau, Davenel and Kouba2007) that the increase in saturation of the backfat goes in parallel with the increase in body temperature. The SFA were high in flare fat and low in other analysed tissues with the exception of LT intermuscular fat, which also showed high levels. In general, differences between subcutaneous fat and intramuscular fat were observed. This result is in agreement with the findings of Marchello et al. (Reference Marchello, Cook, Slanger, Johnson, Fischer and Dinusson1983), but is in contrast to the results of Miller et al. (Reference Miller, Shackelford, Hayden and Reagan1990) where no differences between subcutaneous and intramuscular fat were detected.

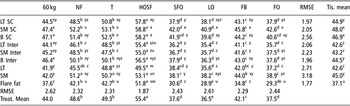
Monounsaturated fatty acids (MUFAs) (Table 9) corresponded mainly to oleic acid (Table 8) and were high in subcutaneous fat and belly intermuscular fat. Except in HOSF-fed animals that showed the lowest value in the LT intramuscular fat, the lowest contents were observed in flare fat. Monounsaturated FAs tissue distribution showed the opposite pattern to that observed in SFA: subcutaneous fat showed the highest contents, intermuscular fat showed intermediate contents and flare fat the lowest contents. As in SFA, intramuscular fat showed a narrower range of variability compared with other fat depots and therefore was less susceptible to treatment modification.


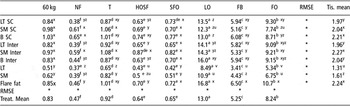
Linoleic acid (Table 10) was high in intramuscular fat in the 60 kg animals, NF-, T- and LO-fed animals, and was also high in SM intermuscular fat in T-, HOSF-, SFO-, LO- and FO-fed animals. Apparently, no tissue pattern was observed in linoleic content. In contrast to the results of Villegas et al. (Reference Villegas, Hedrick, Veum, McFate and Bailey1973), when given a specific fat-added diet, linoleic acid was not preferentially deposited in backfat rather than in flare fat. Linolenic values (Table 11) varied mainly depending on treatment, but when diets were rich in linolenic acid (LO, FB and FO) the lowest values were observed in intramuscular fat and the highest in flare fat. Apparently, there was no FA pattern distribution for linolenic acid.
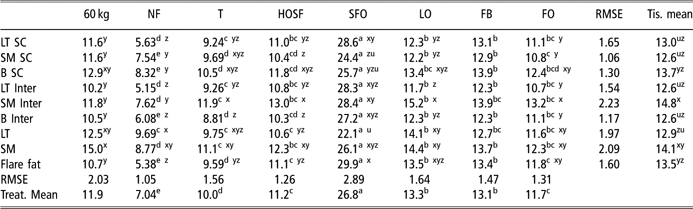
Linolenic acid (C18:3n-3) profile (% of detected fatty acids)

See Table 4 footnotes.
*RMSE was not calculated as comparisons were done on arcsine values because of the great difference that existed between treatments.
Arachidonic acid (Table 12) showed a clear differential tissue distribution as it was high in intramuscular fat and low and not significantly different among all other analysed adipose tissues.

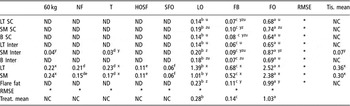
Eicosapentaenoic acid (EPA) (Table 13) was present in all tissues of animals fed, LO, FB or FO. In the rest of treatments, it was only detected in intramuscular fat. EPA present in LT and SM intramuscular fat is probably from endogenous synthesis (elongation of linolenic acid) as it was only present in LO and FO diets.
Eicosapentaenoic acid (C20:5n-3) profile (% of detected fatty acids)

See Table 4 footnotes.
ND = not detected; NC = not considered.
*RMSE was not calculated as comparisons were done on arcsine values because of the great difference that existed between treatments.
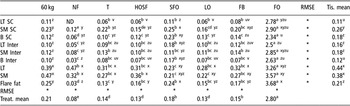
Similar to EPA, docosahexaenoic acid (DHA) (Table 14) was high in intramuscular fat, compared with other fat depots. The lowest contents were found in belly intermuscular fat and LT subcutaneous fat. DHA content was in general greater than for EPA in all studied tissues. In addition, DHA was detected in all tissues and treatments except in LT subcutaneous fat of NF-fed animals.
Docosahexaenoic acid (C22:6n-3) profile (% of detected fatty acids)

See Table 4 footnotes.
ND = not detected.
*RMSE was not calculated as comparisons were done on arcsine values because of the great difference that existed between treatments.
Polyunsaturated FA content was similar among flare fat, intermuscular fat and subcutaneous fat depots (Table 15). In diets with a relatively high content in linolenic acid (LO, FB and FO diets), the n6/n3 ratio (Table 16) was high in LT intramuscular fat compared with diets poor in linolenic acid, whereas in animals fed with other diets the highest values were observed in LT subcutaneous fat, where the wider fat depot layers are observed.


Effect of fat source
Fat source had a higher influence in modifying FA composition than tissue. Palmitic acid was high in NF-fed pigs and low in HOSF-, SFO- and LO-fed animals (diets with the lowest palmitic contents). Similar to palmitic acid, stearic acid was high in NF-fed animals and low in HOSF-fed animals. Palmitic and stearic acids could be either from dietary or endogenous origin. In NF-fed animals, palmitic and stearic were largely synthesized de novo and they were not diluted with PUFA from dietary origin as NF was added in this diet. The SFA showed similar trends to palmitic and stearic acids, being high in NF-fed animals and low in HOSF- and SFO-fed animals. In contrast to previous studies (Koch et al., Reference Koch, Pearson, Magee, Hoefer and Schweigert1968), SFA showed important variations in their contents probably due to extreme FA compositions used in the present experiment as in the work of Brooks (Reference Brooks1971). Intramuscular SFA content was less sensitive to dietary modifications compared with other fatty tissues, suggesting that it does not follow the same pattern in dietary FA deposition. Intramuscular fat may also have different proportions of phospholipids and triglycerides than other separable fat depots. The FA composition of the polar and neutral lipids of muscle is far less susceptible to the type of dietary fat than that of the triglycerides of adipose tissue (Warnants et al., Reference Warnants, Van Oeckel and Boucque1996; Eder et al., Reference Eder, Nonn and Kluge2001).
Oleic acid was high in HOSF-fed animals (diet with the highest oleic acid content) and low in SFO-, LO- and FO-fed animals. Interestingly, although the FB diet had lower oleic acid content than SFO, FB-fed animals had a higher oleic acid tissue content than SFO. Probably, this higher oleic acid content is linked to a higher SFA dietary content in FB-fed animals, which could be desaturated to oleic acid (Bloomfield and Bloch, Reference Bloomfield and Bloch1960). MUFA contents were parallel to those observed in oleic acid contents; therefore, MUFA were high in HOSF-fed animals and low in SFO-, LO- and FO-fed animals.
Linoleic acid was high in SFO-fed animals (diet rich in linolenic acid) and low in NF-fed animals (diet with no added fat), while other diets showed intermediate values depending on their dietary linoleic content. Different authors have found that if fats with a high proportion of linoleic acid as in SFO, soy oil or corn oil are replaced with fats containing high levels of MUFA or SFA such as tallow, olive oil or rapeseed oil, the concentration of linoleic acid in tissue declines in favour of oleic acid, whereas the other FA remain more or less constant (Koch et al., Reference Koch, Pearson, Magee, Hoefer and Schweigert1968; Brooks, Reference Brooks1971; Wiseman and Agunbiade, Reference Wiseman and Agunbiade1998). In addition to these observations, Eder et al. (Reference Eder, Nonn and Kluge2001) pointed out that the concentration of linoleic acid in the triglycerides is apparently determined only by the dietary linoleic acid intake. It is interesting to observe that when pigs are fed the same level of dietary linoleic acid, its deposition can differ; the different linoleic acid accretion observed in pigs fed FO and T suggested that some variations in the linoleic acid deposition could be affected by the presence of other dietary FA since these animals received the same levels of linoleic acid. Another influence on linoleic acid deposition would be the overall dietary fat content. In the work of Warnants et al. (Reference Warnants, Van Oeckel and Boucqué1999), similar levels of dietary linoleic acid were used during the finishing phase (6 weeks before slaughter) to those of the present experiment (diets HOSF, LO, FB and FO), but linoleic acid was a minor constituent compared with other FA in the present work. In the work of Warnants et al. (Reference Warnants, Van Oeckel and Boucqué1999), linoleic acid was more efficiently deposited, reaching levels of 17% in carcass backfat, whereas in the present work linoleic acid reached the maximum level in belly subcutaneous fat (13.9%). In the present work, when linoleic and linolenic acid increased, oleic acid was mainly replaced by these FA followed by SFA, meaning that SFA are less susceptible to modification. Linolenic acid was high in LO-fed animals (diet rich in linolenic acid) and low in NF-fed animals (diet with no added fat), while other diets showed intermediate values depending on its dietary linolenic content. Linolenic acid levels in meat samples (LT and SM muscles) in pigs fed FO (5.3% and 6.8%) and LO (8.5% and 10.9) would probably exceed levels (1.4% to 2.9%) that would affect the sensory properties of meat (Van Oeckel et al., Reference Van Oeckel, Casteels, Warnants, Van Damme and Boucque1996). In general, arachidonic acid was high in SFO-fed animals compared with other diets (not statistically when compared with HOSF and NF). Animals fed LO and FB (diets rich in linolenic acid) showed lower numerical values in arachidonic acid levels compared with other fat-added diets in some of the studied tissues. Nuernberg et al. (Reference Nuernberg, Fischer, Nuernberg, Kuechenmeister, Klosowska, Eliminowska-Wenda, Fiedler and Ender2005) suggested that this decrease could be a result of the competition for the same enzymes in their elongation and desaturation metabolism.
EPA was high in FO-fed animals (diet rich in EPA) followed by LO and FB, while concentrations of this FA in the other diets were not detected with the exception of 60 kg animals and T intermuscular SM. DHA was high in FO-fed animals compared with other fat sources. Except in FO-fed animals, EPA and DHA present in tissues would originate from the elongation of linolenic acid. Pigs fed LO and FB showed detectable levels of EPA, which seemed to depend on its linolenic dietary content (linolenic content in LO doubled FB linolenic content, consequently EPA content in LO-fed animals tissues doubled FB-fed animals tissues). Although DHA is at the end of the same synthesis pathway as EPA, the only effective way to increase tissue DHA contents was to add DHA in the diet as shown in the results of FO-fed animals. Different studies reported an increase in docosapentaenoic acid and EPA, but not in DHA contents due to linolenic acid dietary supplementation (Kouba et al., Reference Kouba, Enser, Whittington, Nute and Wood2003; Nuernberg et al., Reference Nuernberg, Fischer, Nuernberg, Kuechenmeister, Klosowska, Eliminowska-Wenda, Fiedler and Ender2005). The effects of dietary fat source on PUFA content in intramuscular fat were less evident than those found in subcutaneous fat. This difference may be related to the lower deposition rate in the intramuscular fat tissue (Nguyen et al., Reference Nguyen, Nuijens, Everts, Salden and Beynen2003), and to the presence of more structural lipids in intramuscular fat (containing normally elevated amounts of PUFA not susceptible to be easily modified) compared with other fat depots (Warnants et al., Reference Warnants, Van Oeckel and Boucqué1999). Also according to other studies, the intramuscular fat of the LT muscle is less sensitive to PUFA incorporation than belly (Leszczynski et al., Reference Leszczynski, Pikul, Easter, McKeith, McLaren, Novakofski, Bechtel and Jewell1992) and subcutaneous fat of the LT muscle (Koch et al., Reference Koch, Pearson, Magee, Hoefer and Schweigert1968). PUFA were high in SFO- and LO-fed animals and low in NF-fed animals. Interestingly, FO-fed animals showed in some of the tissues a significantly lower content than in pigs fed SFO although the diet only differed in PUFA by a 3.7 mg/kg diet. This differential PUFA deposition may be due to the greater oxidation of PUFA from FO-fed animals than PUFA from SFO-fed animals. A whole-animal FA balance performed in this trial (data not shown) showed that EPA and DHA from FO diet are more oxidized than linoleic or linolenic acids from other PUFA diets, and this would explain the differences in PUFA deposition depending on dietary treatment. The n6/n3 is a parameter that evaluates the nutritional quality of fat in terms of human health (Simopoulos, Reference Simopoulos2001). This ratio was particularly high in SFO-fed animals, which would not make it interesting according to current recommendations for a healthy diet. Fat blend, FO- and LO-fed animals showed n-6 : n-3 ratios within dietary recommendations in accordance with values reported by Hoz et al. (Reference Hoz, Lopez-Bote, Cambero, D’Arrigo, Pin, Santos and Ordonez2003) and Nuernberg et al. (Reference Nuernberg, Fischer, Nuernberg, Kuechenmeister, Klosowska, Eliminowska-Wenda, Fiedler and Ender2005). Other dietary treatments (NF, T, HOSF and SFO) showed intermediate n-6 : n-3 ratios above the recommended levels from a human health standpoint.
Conclusions
A pattern in tissue FA distribution was confirmed as SFA were preferentially deposited in inner fat depots compared with more external fat depots. Intramuscular fat was less susceptible to dietary treatment modification relative to other fat depots, and the main tissue FA differences were achieved due to differential levels of dietary PUFA. Ingestion of LO increases EPA tissue contents, whereas the only effective way to increase tissue DHA contents was to add DHA in the diet through FO feeding. As DHA, arachidonic acid was detected in all studied tissues; and similar to EPA, arachidonic acid tended to be high when its precursor was added in the diet. Arachidonic acid, EPA and DHA were high in intramuscular fat compared with other fat depots. The FA deposition depended on dietary fat content and FA composition, as their deposition differed between diets, even at a similar level of intake of each FA. The NF diet resulted in the greatest proportion of SFA (palmitic and stearic) of all treatments tested. SFAs were less susceptible to modification than MUFA in response to the different PUFA levels supplemented in the diet. T resulted in less fat deposition in LT subcutaneous, SM subcutaneous, belly and flare fat, and more in SM subcutaneous, LT intramuscular and SM intramuscular fat (not statistically in intramuscular fats), suggesting that T could partition fat deposition differently among fat depots.