Reproductive efficiency has the greatest impact on the productivity and profitability of a dairy herd (dos Santos et al., Reference Santos, Freitas, Obando, Oliveira, Penitente-filho, Moreira, Lobato and Guimarães2025), indicating that reproductive traits often carry greater economic weight than milk yield. Behavioural indicators are important tools for detecting oestrus and deciding when to breed dairy animals. Poor and less intense expression of oestrous behaviour leads to lower detection rates, which causes lower reproductive success. Buffaloes have particularly poor reproductive efficiency in view of discernible fluctuations in reproductive endocrine activity, i.e. silent heat (Singh et al., Reference Singh, Nanda and Adams2000; Roy and Prakash, Reference Roy and Prakash2009). Oestrus detection in buffaloes is difficult since these animals do not show overt signs of behavioural oestrus even when the physiological processes associated with oestrus are present. Silent oestrus is considered one of the major obstacles to understanding reproductive parameters and assisted reproduction in buffaloes (Mondal et al., Reference Mondal, Prakash and Palta2008). In India, organised dairy buffalo herds cannot detect approximately 50% of the heifers in oestrus and about 20% of the buffaloes are inseminated at incorrect times (Kumaresan et al., Reference Kumaresan, Ansari and Sanwal2001). In comparison to dairy cattle, buffaloes have lower circulating levels of 17-oestradiol, which might explain their lower oestrous behavioural intensity (Seren et al., Reference Seren, Parmeggiani and Campanile1995). Buffaloes display several reproductive abnormalities, including delayed start of puberty, poor oestrus expression and greater range in oestrous cycle length with a higher prevalence of both unusually short and lengthy cycles (Gordon, Reference Gordon1999).
Environmental, management and social signals also influence oestrous behaviour in dairy animals (Orihuela, Reference Orihuela2000). There is a general decline in oestrous behaviour expression and intensity. This is thought to be a result of current intensive systems of management and a lack of social enrichment. The behavioural signs of oestrus, such as licking/sniffing the genital region, tail raising, chin resting, bellowing/vocalisation, micturition and standing for mounting during oestrus, are even more poorly expressed in heifers than in multiparous buffaloes and more focused attention is needed to detect buffalo heifers in oestrus (Verma et al., Reference Verma, Prasad, Mohanty, Kumaresan, Layek, Patbandha and Kantwa2014). The practise of guiding a teaser (vasectomised) bull throughout buffalo herds once or twice daily has thus been commonly employed in organised herds in India and Pakistan to improve oestrous detection rates in riverine buffaloes.
Mat (Reference Mat2014) reported that providing social signals in the form of bio-stimulation is an effective way to improve oestrous behavioural expression along with the reproductive capability of dairy cattle. Bio-stimulation (a form of clean, green and ethical technology) is the male’s stimulatory effect on female cyclic activity, eliciting both behavioural and endocrine reactions in conspecifics through external olfactory, visual, auditory and tactile stimuli (Chenoweth, Reference Chenoweth1983). Exposure to a male has previously been reported to increase the expression and intensity of oestrous behaviours in a variety of species: pigs (Langendijk et al., Reference Langendijk, Van den Brand, Soede and Kemp2000), sheep (Rekwot et al., Reference Rekwot, Ogwu, Oyedipe and Sekoni2001), post-partum beef cattle (Mat, Reference Mat2014), Sahiwal heifers (Choudhary et al., Reference Choudhary, Kamboj, Raheja, Singh, Kumar, Barman and Bhakat2019) and post-partum anoestrus Nili-Ravi buffaloes (Zaidi and Anwar, Reference Zaidi and Anwar2018). However, there is a lack of scientific reports on behavioural indicators of oestrus at the time of pubertal oestrus (first oestrus) and in successive oestrous cycle stages of pro-oestrus, oestrus and met-oestrus in dairy buffalo heifers in the presence of a bull as a bio-stimulant.
To test the hypothesis that bio-stimulation will promote oestrous behaviour in dairy pubertal Murrah heifers and consequently will play an important role in timely oestrus detection, the present study aimed to investigate the effects of bio-stimulation via direct and fenceline bull contact on oestrous behaviours in Murrah buffalo heifers during both first and second oestrous cycles.
Materials and methods
Animals and management
This research was conducted at the dairy farm of the Indian Council of Agricultural Research-National Dairy Research Institute in Karnal, Haryana, India (Online Supplementary Fig. S1). The experiment lasted 10 months (i.e. May–February). The Murrah heifers were kept under a loose housing arrangement which had a covered area of 3.5 m2/individual and an adjacent open paddock area of 7 m2/individual. All heifers assigned to the experiment were fed the same ration (as per ICAR, 2013 guidelines) comprised of a concentrate mixture and seasonal green fodders in a 30:70 ratio, and fresh water was available to all animals for drinking round the clock. (Further details are provided in the Online Supplementary File – materials and methods, Tables S4 and S5 and Fig. S5). For the study, 24 apparently healthy pre-pubertal heifers born between November 2017 and May 2018 were selected from the institute herd based on their reproductive soundness (as determined by ultrasonography using a real-time, B-mode, diagnostic scanner equipped with a transrectal 7.5 MHz, linear array transducer [Aloka, Pro-sound 2, Japan]), age and body weight. All 24 heifers were distributed into three groups (T0, T1 and T2) at the same time such that the average age of each group was about 15 months with an average body weight of about 200 kg (Online Supplementary Tables S1–S3). Heifers in the T1 group had continuous exposure to an intact bull (aged 28 months) via fenceline interactions from the beginning of the experiment. A 5-foot-high fence composed of 1.5-inch-diameter galvanised iron pipe railings separated the heifers and the bull. The pipe railings of the fence were 24, 18 and 18 inches apart from ground level, allowing adequate contact via four sensory cues (visual, auditory, olfactory and some tactile engagement) between the heifers and bull across the fenceline barrier, which extended throughout the whole length of the shed (Online Supplementary Fig. S2). Heifers of T2 group had direct exposure to a bull inside the paddock for a total duration of 6 hours each day, 3 hours in the morning (6:00–9:00) and 3 hours in the evening (16:00–19:00) from the beginning of the experiment. The bull was fitted with an apron to prevent intromission and chance insemination when mounting the heifers (Online Supplementary Fig. S3). Heifers in the T0 group (control) were not exposed to a bull. To reduce any effect of airborne pheromones, heifers of all the 3 groups were housed at a minimum distance of 0.5 km from each other (Online Supplementary Fig. S4).
Recording of oestrous behaviours
The number of times oestrous behaviours occurred (sniffing/licking by bull or other herdmates, tail raising and micturition in response to sniffing/licking, chin resting by bull or other herdmates, mounting attempts by bull or other herdmates and standing to be mounted) was digitally video recorded continuously for one week; pro-oestrus stage (on day −3, day −2 and day −1), on oestrus day (day 0) and met-oestrus period (day +1, day +2 and day +3) by using 12 total digital cameras. The cameras were equipped with a night vision feature, 8× zooming capability and strategically placed to capture footage of the whole shed area (Online Supplementary Table S6). Heifers were numbered twice a week using white water-paint on the flank and back area to aid in individual identification. Furthermore, the occurrence of oestrus was not only confirmed by digital camera recordings (whole videography recordings were watched later to observe the oestrous symptoms and counted according to the format which is produced in the Online Supplementary File Table S6) and manual observation, but also by presence of thin and transparent mucus discharge (mucus discharge was collected in Artificial Insemination Sheath by inserting it into reproductive tract of heifers through Artificial Insemination Gun) and progesterone (P4) level in blood plasma.
Analysis of progesterone (P4) profile
Blood samples (5 ml) were taken twice during both first and second oestrous cycles to measure progesterone concentrations on days 7 and 9. This was done for further confirmation of oestrus occurrence. Progesterone (P4) concentrations in blood plasma samples were measured using radioimmunoassay (RIA) at the ICAR-IVRI Referral Laboratory in India. Progesterone concentrations over 1 ng/ml are considered to reflect luteal function for evaluating cyclic ovarian activity and confirming oestrus occurrence (Perera, Reference Perera2011). Further details are provided in the Online Supplementary File-materials and methods.
Statistical analyses
Data were analysed using SPSS software (Version 21.0) using descriptive statistics, one-way ANOVA (Analysis of Variance) and a general linear model (GLM) univariate method for analysis of variance. The data plots were created with GraphPad Prism (Version 5.0). The difference in average frequencies of oestrous behaviours of three different groups was evaluated using DMRT (Duncan’s Multiple Range Test) during both the first and second oestrous cycles. The level of statistical significance was taken as P < 0.05. These evaluations were made using the general linear model (GLM) below:
 \begin{equation*}{Y_{ij}} = \mu + {T_i} + {e_{ij}}\end{equation*}
where Y = observation of frequency of oestrous behaviours of the jth heifer in the ith treatment, μ = Overall mean, Ti = effect of the ith treatment, eij = error.
Results
Most oestrous behaviours (sniffing or licking behaviour followed by raising of tail and micturition; chin resting; and subsequent mounting attempts) were first observed during pro-oestrus (on day −3 or day −2). Subsequently, the frequencies of these behaviours progressively increased until peaking on the day of oestrus (day 0). Following that, they declined until the behaviours completely waned by day +2 to day +3.
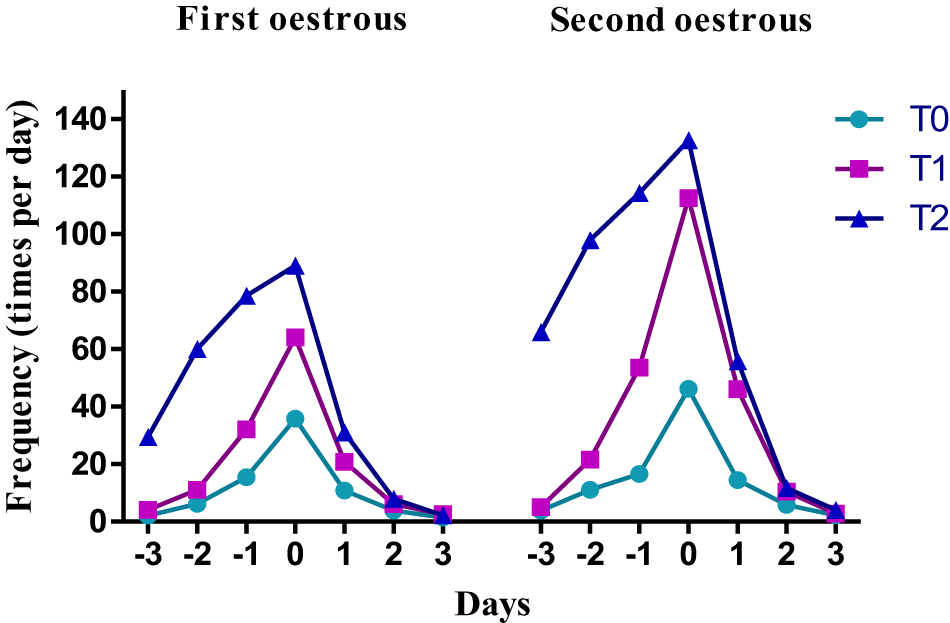
The mean frequencies of sniffing or licking the heifer’s external genitalia by the bull and other herdmates during the first oestrous cycle significantly differed (P < 0.05) between the three groups from day −2 to day +1. The highest values (mean ± standard error) were observed in the heifers of T2 (60.00 ± 0.89, 78.50 ± 0.33, 89.00 ± 0.63 and 31.00 ± 0.46) group, followed by T1 (11.00 ± 0.78, 32.00 ± 0.95, 64.00 ± 0.63 and 20.80 ± 0.37) and T0 (6.20 ± 0.37, 15.40 ± 0.51, 35.80 ± 0.66 and 10.80 ± 0.37), respectively. The frequencies on day −3 before oestrus and on day +2 after oestrus were significantly (P < 0.05) higher in T2 as compared to T0. During the second oestrous, the mean frequencies of sniffing/licking were also significantly (P < 0.05) different among the three groups from day −2 to day +1, with the highest values in the heifers of T2 (97.88 ± 0.77, 114.25 ± 0.37, 132.63 ± 0.96 and 55.75 ± 0.37), followed by T1 (21.60 ± 0.68, 53.60 ± 0.68, 112.60 ± 0.87 and 46.00 ± 0.55) and T0 (11.00 ± 0.45, 16.60 ± 0.51, 46.20 ± 1.07 and 14.40 ± 1.33), respectively. The value on day −3 was significantly (P < 0.05) highest in T2 as compared to T1 and T0, and the value on day +2 was higher (P < 0.05) for heifers of both T1 and T2 groups as compared to the T0 group. During the second oestrous, the frequencies of sniffing or licking in T1 and T2 were much higher (1.5–2 times) than those recorded in both these groups during the first oestrous. However, in T0, these frequencies were virtually identical during both the second and first oestrous (Fig. 1).
Sniffing or licking frequency by bull and other herdmates in T0, T1 and T2 groups of Murrah buffalo heifers during peri-oestrus period (−3, −2, −1, 0, 1, 2 and 3 days) of both first (n = 18) and second (n = 18) oestrous cycles.
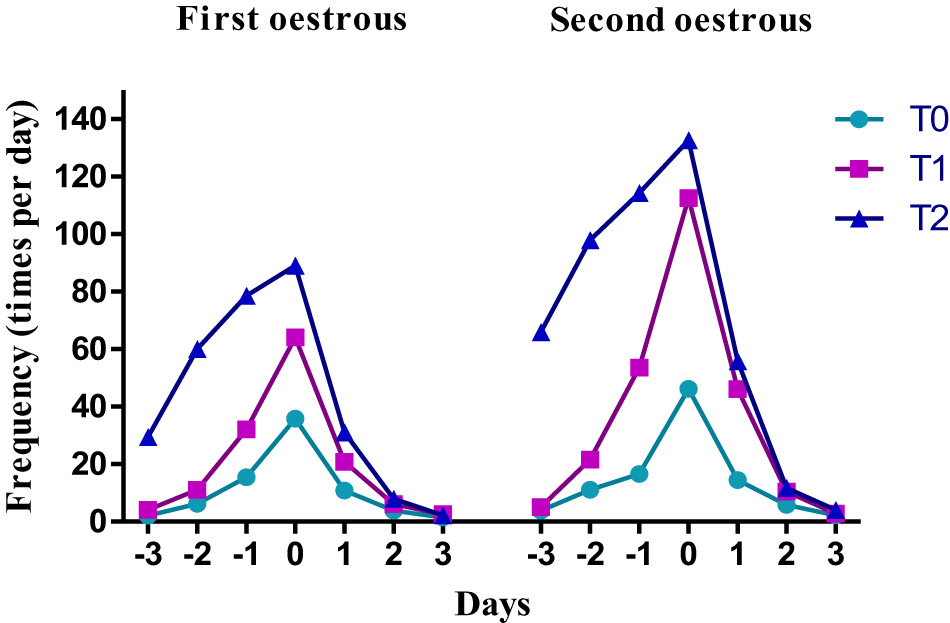
Figure 1 Long description
First oestrous Title text: First oestrous. Legend labels: T0, T1, T2. Series markers: T0 uses circle markers, T1 uses square markers, T2 uses triangle markers. Horizontal axis label: Days. Range: negative 3 to 3. Vertical axis label: Frequency (times per day). Range: 0 to 140. Data points as coordinate pairs. T0: (negative 3, 0), (negative 2, 6.20), (negative 1, 15.40), (0, 35.80), (1, 10.80) T1: (negative 3, 0), (negative 2, 11.00), (negative 1, 32.00), (0, 64.00), (1, 20.80) T2: (negative 3, 0), (negative 2, 60.00), (negative 1, 78.50), (0, 89.00), (1, 31.00) Peak values among the listed points. T0 peak at day 0: 35.80. T1 peak at day 0: 64.00. T2 peak at day 0: 89.00. Second oestrous Title text: Second oestrous. Legend labels: T0, T1, T2. Series markers: T0 uses circle markers, T1 uses square markers, T2 uses triangle markers. Horizontal axis label: Days. Range: negative 3 to 3. Vertical axis label: Frequency (times per day). Range: 0 to 140. Data points as coordinate pairs. T0: (negative 3, 0), (negative 2, 11.00), (negative 1, 16.60), (0, 46.20), (1, 14.40) T1: (negative 3, 0), (negative 2, 21.60), (negative 1, 53.60), (0, 112.60), (1, 46.00) T2: (negative 3, 0), (negative 2, 97.88), (negative 1, 114.25), (0, 132.63), (1, 55.75) Peak values among the listed points. T0 peak at day 0: 46.20. T1 peak at day 0: 112.60. T2 peak at day 0: 132.63. Comparison statements based on the listed points. Across the listed days in both plots, T2 values are higher than T1 and T1 values are higher than T0. Across the listed days in both plots, values rise from day negative 3 toward day 0 and then drop by day 1. At day 0, the second oestrous plot has higher values than the first oestrous plot for T0, T1 and T2.
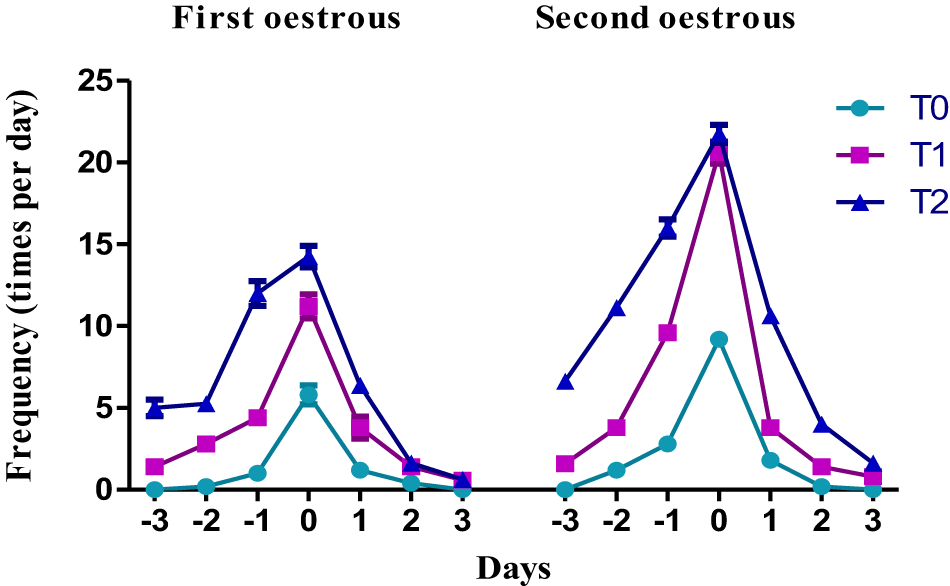
The mean frequency of tail raising behaviour during first oestrous cycle in reaction to the bull and other herd mates sniffing or licking external genitalia was significantly different from day −3 to day 0 (P < 0.05); being 5.00 ± 0.50, 5.25 ± 0.41, 12.00 ± 0.76 and 14.25 ± 0.65 in T2; 1.40 ± 0.25, 2.80 ± 0.37, 4.40 ± 0.25 and 11.20 ± 0.74 in T1; and 0.00 ± 0.00, 0.20 ± 0.20, 1.00 ± 0.00 and 5.80 ± 0.58 in T0 group of heifers. The tail-raising frequency on day +1 was higher (P < 0.05) for T2 group heifers than for T1 group heifers and T0 group heifers. During the second oestrous, mean frequencies of tail raising during day −3, day −1 and day +1 were the highest (P < 0.05) for T2 (6.63 ± 0.42, 16.00 ± 0.54 and 10.63 ± 0.46) group, followed by T1 (1.60 ± 0.40, 9.60 ± 0.25 and 3.80 ± 0.37) and T0 (0.00 ± 0.00, 2.80 ± 0.37 and 1.80 ± 0.20) group. On day 0, these were significantly (P < 0.05) greater in T2 and T1 (21.75 ± 0.56 and 20.60 ± 0.68) than in T0 (9.20 ± 0.37). During the second oestrous, on day −2, day −1 and day 0, the number of tail raisings was almost 1.5–2.0 times more frequent than that during the first oestrus (Fig. 2) in all three groups of heifers.
Tail-raising frequency in response to sniffing or licking behaviour by bull and other herdmates in T0, T1 and T2 groups of Murrah buffalo heifers during peri-oestrus period (−3, −2, −1, 0, 1, 2 and 3 days) of both first (n = 18) and second (n = 18) oestrous cycles.
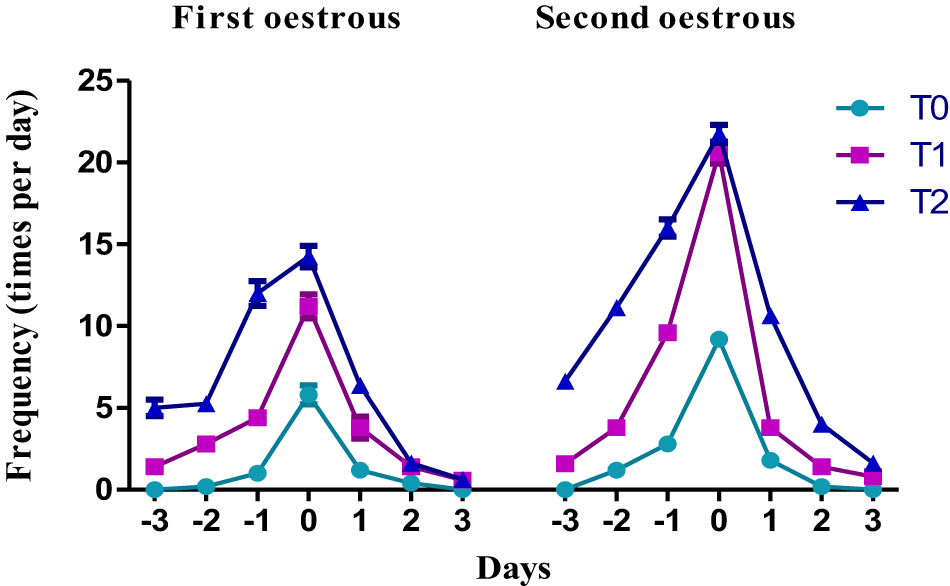
Figure 2 Long description
First oestrous Title text: First oestrous. Legend text: T0, T1, T2. Horizontal axis label: Days. Horizontal axis values: minus 3, minus 2, minus 1, 0, 1, 2, 3. Vertical axis label: Frequency (times per day). Vertical axis range and ticks: 0 to 25, with ticks at 0, 5, 10, 15, 20, 25. T0 series coordinate pairs: (minus 3, 0), (minus 2, 0), (minus 1, 1), (0, 6), (1, 1), (2, 0), (3, 0) T1 series coordinate pairs: (minus 3, 1), (minus 2, 3), (minus 1, 4), (0, 11), (1, 4), (2, 1), (3, 0) T2 series coordinate pairs: (minus 3, 5), (minus 2, 5), (minus 1, 12), (0, 14), (1, 6), (2, 1), (3, 0) Second oestrous Title text: Second oestrous. Legend text: T0, T1, T2. Horizontal axis label: Days. Horizontal axis values: minus 3, minus 2, minus 1, 0, 1, 2, 3. Vertical axis label: Frequency (times per day). Vertical axis range and ticks: 0 to 25, with ticks at 0, 5, 10, 15, 20, 25. T0 series coordinate pairs: (minus 3, 0), (minus 2, 1), (minus 1, 3), (0, 9), (1, 2), (2, 0), (3, 0) T1 series coordinate pairs: (minus 3, 2), (minus 2, 4), (minus 1, 10), (0, 20), (1, 4), (2, 1), (3, 1) T2 series coordinate pairs: (minus 3, 7), (minus 2, 11), (minus 1, 16), (0, 22), (1, 11), (2, 4), (3, 2).
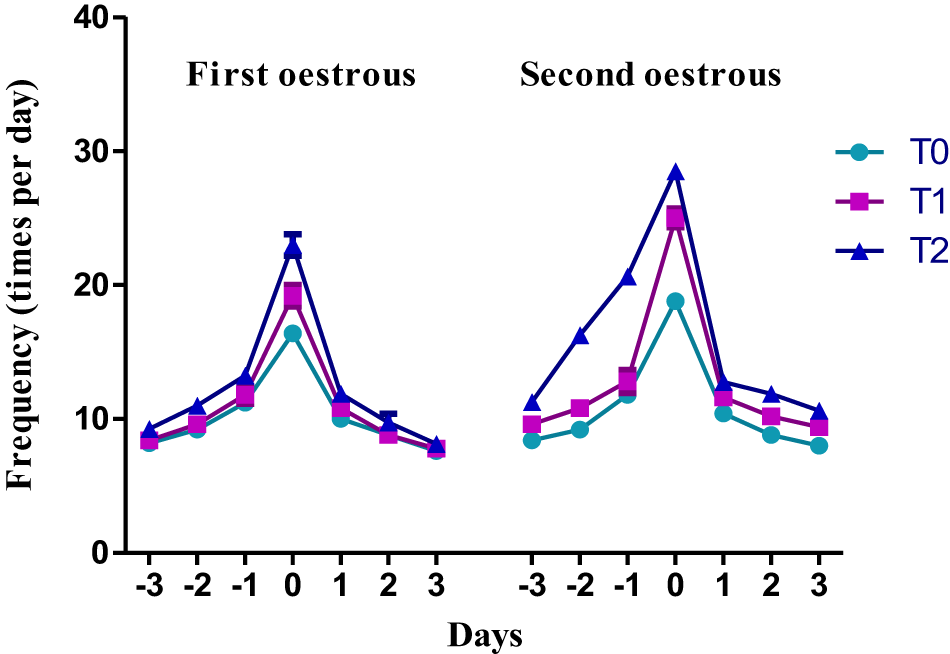
The average frequency of micturition behaviour at the time of first oestrus was significantly (P < 0.05) greater from day −2 to day +1 in T2 (11.00 ± 0.42 and 13.25 ± 0.41) than in T0 heifers (9.20 ± 0.58 and 11.20 ± 0.58, respectively). However, it was significantly (P < 0.05) different between the three groups of heifers on day 0, with the highest in the T2 (23.00 ± 0.80) group, subsequently in T1 (19.20 ± 0.80) and T0 (16.40 ± 0.5) groups of heifers. During the second oestrous, however, micturition frequencies from day −2 to day 0 were significantly (P < 0.05) greater in T2 (16.25 ± 0.3, 20.63 ± 0.18 and 28.50 ± 0.27) than those in T1 (10.80 ± 0.37, 12.80 ± 0.86 and 25.00 ± 0.71) and T0 (9.20 ± 0.20, 11.80 ± 0.20 and 18.80 ± 0.58, respectively). More frequent micturition on day 0 was noticed, in general, when second oestrus was present than during first oestrus in all three groups of heifers (Fig. 3).
Micturition frequency in T0, T1 and T2 groups of Murrah buffalo heifers during peri-oestrous period (−3, −2, −1, 0, 1, 2 and 3 days) of both first (n = 18) and second (n = 18) oestrous cycles.
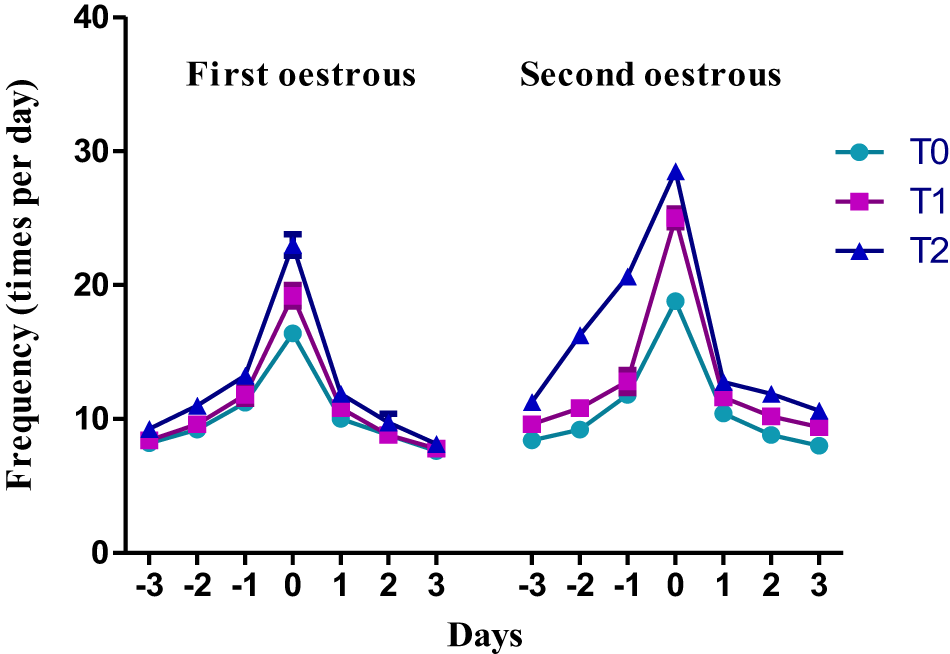
Figure 3 Long description
First oestrous. Second oestrous. Legend labels: T0, T1, T2. Line markers: T0 uses circle markers, T1 uses square markers, T2 uses triangle markers. Axes. Horizontal axis label: Days. Tick labels: negative 3, negative 2, negative 1, 0, 1, 2, 3. Vertical axis label: Frequency (times per day). Range: 0 to 40. Data values as coordinate pairs. First oestrous, T0: (negative 3, 8), (negative 2, 9), (negative 1, 11), (0, 16), (1, 10), (2, 9), (3, 8). First oestrous, T1: (negative 3, 8), (negative 2, 9), (negative 1, 12), (0, 19), (1, 11), (2, 9), (3, 8). First oestrous, T2: (negative 3, 9), (negative 2, 11), (negative 1, 13), (0, 23), (1, 12), (2, 10), (3, 8). Second oestrous, T0: (negative 3, 8), (negative 2, 9), (negative 1, 12), (0, 19), (1, 10), (2, 9), (3, 8). Second oestrous, T1: (negative 3, 10), (negative 2, 11), (negative 1, 13), (0, 25), (1, 11), (2, 10), (3, 9). Second oestrous, T2: (negative 3, 11), (negative 2, 16), (negative 1, 20), (0, 28), (1, 12), (2, 12), (3, 11). Peaks and lows from the listed points. First oestrous peak values at day 0: T0 (0, 16), T1 (0, 19), T2 (0, 23). First oestrous lowest listed values: T0 (negative 3, 8) and (3, 8); T1 (negative 3, 8) and (3, 8); T2 (3, 8). Second oestrous peak values at day 0: T0 (0, 19), T1 (0, 25), T2 (0, 28). Second oestrous lowest listed values: T0 (negative 3, 8) and (3, 8); T1 (3, 9); T2 (negative 3, 11). Comparisons stated using the listed points. At day 0, T2 is higher than T1 and T0 in both first oestrous and second oestrous. At day 0, second oestrous values are higher than first oestrous values for T0, T1 and T2.
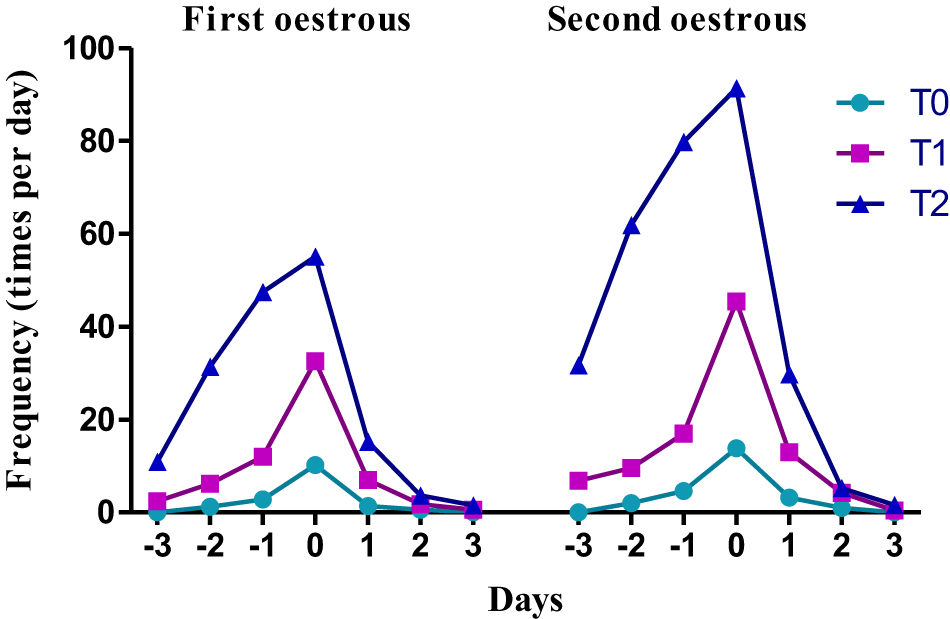
The willingness of Murrah heifers to accept chin-resting behaviour by the bull and other herdmates on the sacral area was seen on day −3 and lasted until day +3 in both bull-exposed heifer groups during both cycles. In contrast, this behaviour was seen on day −2 and lasted until day +2 in heifers not exposed to a bull. The average frequencies of accepting chin resting during first oestrous from day −3 to day +1 was significantly (P < 0.05) different between all three groups, being highest for T2 (10.88 ± 0.52, 31.38 ± 0.50, 47.50 ± 1.18, 55.13 ± 0.13 and 15.25 ± 0.45), followed by T1 (2.40 ± 0.25, 6.20 ± 0.58, 12.00 ± 0.55, 32.60 ± 1.08 and 7.00 ± 0.45) and T0 (00 ± 00, 1.20 ± 0.37, 2.80 ± 0.20, 10.20 ± 0.66 and 1.40 ± 0.25), respectively, whereas on day +2, it was higher (P < 0.05) in T2 (3.63 ± 0.26) as compared to T0 (0.60 ± 0.25), but there was no difference between T1 and T0. During second oestrus, chin resting frequency showed a similar trend to that observed during the first cycle except on day +2, when chin resting frequency was higher (P < 0.05) in the heifers of T2 (5.25 ± 0.16) and T1 (4.20 ± 0.37) as compared to the T0 (1.00 ± 0.00) group, with no difference between T1 and T2 (Fig. 4).
Chin resting frequency by bull and other herdmates in T0, T1 and T2 groups of Murrah buffalo heifers during peri-oestrous period (−3, −2, −1, 0, 1, 2 and 3 days) of both first (n = 18) and second (n = 18) oestrous cycles.
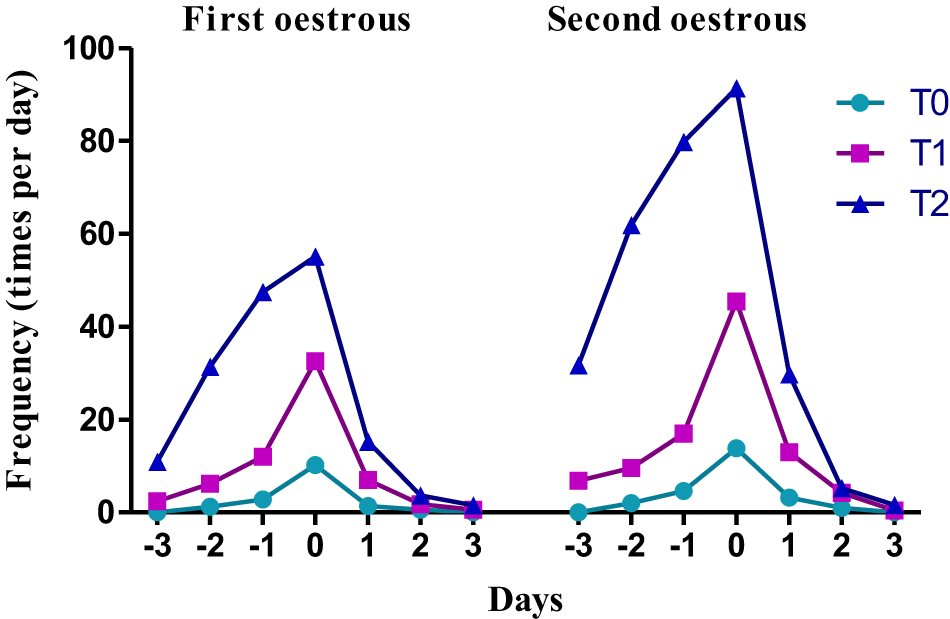
Figure 4 Long description
First oestrous Second oestrous Line graph with two sections labeled “First oestrous” and “Second oestrous”. Horizontal axis label: Days. Tick labels: minus 3, minus 2, minus 1, 0, 1, 2, 3. Vertical axis label: Frequency (times per day). Range: 0 to 100. Legend labels: T0, T1, T2. First oestrous data points T0: (minus 3, 0), (minus 2, 1), (minus 1, 3), (0, 10), (1, 1), (2, 0), (3, 0) T1: (minus 3, 2), (minus 2, 6), (minus 1, 12), (0, 32), (1, 7), (2, 1), (3, 0) T2: (minus 3, 10), (minus 2, 31), (minus 1, 47), (0, 55), (1, 15), (2, 3), (3, 1) Second oestrous data points T0: (minus 3, 0), (minus 2, 2), (minus 1, 5), (0, 14), (1, 4), (2, 1), (3, 0) T1: (minus 3, 7), (minus 2, 10), (minus 1, 17), (0, 45), (1, 13), (2, 4), (3, 0) T2: (minus 3, 31), (minus 2, 62), (minus 1, 80), (0, 90), (1, 30), (2, 5), (3, 1).
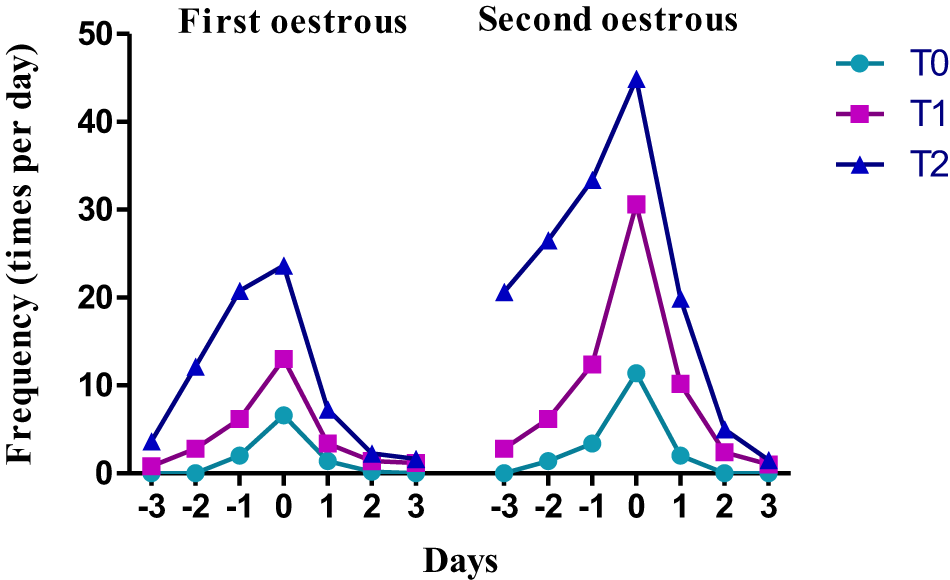
The initiation of mounting attempts by the bull and other herdmates during the first oestrous was witnessed on day −3 and persisted until day +3 in T1 and T2. In comparison, it was seen for the first time on day −1 and lasted until day +2 in T0. The average mounting attempt frequencies during first oestrous were different (P < 0.05) from day −3 to day +1 between the three groups, being highest in T2 (3.63 ± 0.32, 12.13 ± 0.40, 20.75 ± 0.70, 23.63 ± 0.94 and 7.25 ± 0.25) followed by T1 (0.80 ± 0.20, 2.80 ± 0.37, 6.20 ± 0.37, 13.00 ± 0.71 and 3.40 ± 0.68) and T0 (0.00 ± 0.00, 0.00 ± 0.00, 2.00 ± 0.32, 6.60 ± 0.40 and 1.40 ± 0.25) respectively; whereas on day +2, this frequency was higher (P < 0.05) in T2 (2.25 ± 0.25) as compared to T0 (0.20 ± 0.20) but frequencies did not differ significantly between T1 and T0. Mounting efforts during the second cycle showed a similar pattern to that seen during the first cycle, with significant (P < 0.05) differences across all three groups from day −3 to day +2; being the greatest in T2 (20.63 ± 0.26, 26.50 ± 0.33, 33.38 ± 0.38, 44.88 ± 0.35, 19.88 ± 0.55 and 5.00 ± 0.42) followed by T1 (2.80 ± 0.37, 6.20 ± 0.49, 12.40 ± 0.51, 30.60 ± 0.68, 10.20 ± 0.37 and 2.40 ± 0.51) and T0 (0.00 ± 0.00, 1.40 ± 0.25, 3.40 ± 0.25, 11.40 ± 0.60, 2.00 ± 0.32 and 0.00 ± 0.00). Mounting attempt frequencies during the second oestrous were almost 2.0–2.5 times higher on almost all days of recording as compared to the mean frequencies during the first oestrous in all groups (Fig. 5).
Mounting attempts by the bull and other herdmates in T0, T1 and T2 groups of Murrah buffalo heifers during peri-oestrous period (−3, −2, −1, 0, 1, 2 and 3 days) of both first (n = 18) and second (n = 18) oestrous cycles.
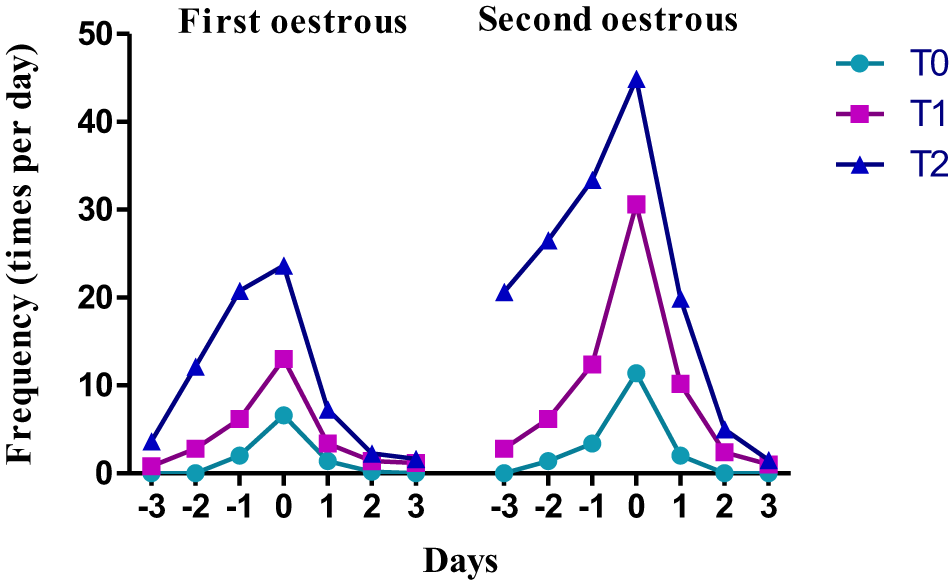
Figure 5 Long description
First oestrous. Second oestrous. Legend labels: T0, T1, T2. Line markers: T0 uses circle markers, T1 uses square markers, T2 uses triangle markers. Horizontal axis label: Days. Tick labels: minus 3, minus 2, minus 1, 0, 1, 2, 3. Range: minus 3 to 3. Vertical axis label: Frequency (times per day). Tick labels: 0, 10, 20, 30, 40, 50. Range: 0 to 50. First oestrous data. T0 coordinate pairs: (minus 3, 0), (minus 2, 0), (minus 1, 2), (0, 6.6), (1, 1.4), (2, 0.2), (3, 0). T1 coordinate pairs: (minus 3, 0.8), (minus 2, 2.8), (minus 1, 6.2), (0, 13.0), (1, 3.4), (2, 0), (3, 0). T2 coordinate pairs: (minus 3, 3.63), (minus 2, 12.13), (minus 1, 20.75), (0, 23.63), (1, 7.25), (2, 2.25), (3, 0). First oestrous peaks and lows. T0 peak: (0, 6.6). T0 lows: (minus 3, 0), (minus 2, 0), (3, 0). T1 peak: (0, 13.0). T1 lows: (2, 0), (3, 0). T2 peak: (0, 23.63). T2 lows: (3, 0). First oestrous comparison. At each day from minus 3 to 3, T2 values are higher than T1 values and T1 values are higher than T0 values. All three series rise from earlier days toward day 0, then drop from day 1 to day 3. Second oestrous data. T0 coordinate pairs: (minus 3, 0), (minus 2, 1.4), (minus 1, 3.4), (0, 11.4), (1, 2.0), (2, 0), (3, 0). T1 coordinate pairs: (minus 3, 2.8), (minus 2, 6.2), (minus 1, 12.4), (0, 30.6), (1, 10.2), (2, 2.4), (3, 0). T2 coordinate pairs: (minus 3, 20.63), (minus 2, 26.50), (minus 1, 33.38), (0, 44.88), (1, 19.88), (2, 5.00), (3, 0). Second oestrous peaks and lows. T0 peak: (0, 11.4). T0 lows: (minus 3, 0), (2, 0), (3, 0). T1 peak: (0, 30.6). T1 low: (3, 0). T2 peak: (0, 44.88). T2 low: (3, 0). Second oestrous comparison. At each day from minus 3 to 3, T2 values are higher than T1 values and T1 values are higher than T0 values. All three series rise toward day 0, then drop from day 1 to day 3. First oestrous versus second oestrous at day 0. T0: first oestrous (0, 6.6); second oestrous (0, 11.4). T1: first oestrous (0, 13.0); second oestrous (0, 30.6). T2: first oestrous (0, 23.63); second oestrous (0, 44.88).
Throughout the first cycle, not a single heifer was willing to stand for mounting by the bull and other herdmates. This behaviour was only observed during the second cycle on day 0. The duration was most prevalent in the heifers of T2 (41.5 ± 0.91 times), followed by T1 (27.2 ± 0.70 times) and T0 (8.5 ± 0.3 times) groups (P < 0.05).
The concentration of P4 (ng/ml) in T0, T1 and T2 groups of heifers was 1.69, 2.88 and 2.97 on the 7th day and 1.53, 3.28 and 3.30 on the 9th day of the first cycle, respectively. During the second cycle, the concentration of P4 (ng/ml) in T0, T1 and T2 groups of heifers was 2.23, 3.62 and 3.67 on the 7th day and 2.28, 3.36 and 3.93 on the 9th day of the oestrous cycle, respectively.
For better clarity and understanding of the study, the details regarding animals that came into heat, their mean age for coming into heat and duration of first oestrus for each group have been presented in Table 1. All the heifers attained puberty in the T2 group, whereas only 62.5% of heifers reached puberty in both the T1 and T0 groups by the end of the experiment. The data in respect of age at first oestrus differed significantly among the three groups, with the lowest in the T2 group, followed by the T1 group and the highest in the T0 group. The total duration of oestrus (hours) at the time of first oestrus was significantly more in both the bull-exposed groups of heifers as compared to the no-bull-exposure group.
Number of heifers, average age (months) and duration of oestrus (hours) during the first oestrous cycle

Table 1 Long description
The table compares three groups of eight experimental heifers (T0, T1, T2) on puberty attainment, age at first oestrus in months, and oestrus duration in hours during the first cycle. Puberty was reached by 5 of 8 heifers in T0 and 5 of 8 in T1, versus 8 of 8 in T2. Average age at first oestrus decreased across groups: 25.61 months in T0, 23.55 months in T1, and 21.50 months in T2, with each group differing from the others. Average oestrus duration increased from 5.34 hours in T0 to 10.18 hours in T1 and 12.45 hours in T2. The duration values for T1 and T2 are not different from each other, while both are longer than T0. Values are reported as means with variability, and letter markers indicate statistically meaningful differences within each row.
Note: Values with different superscripts in the same row are significantly different (P < 0.05).
Discussion
Decreased expression of oestrous behaviour and the resulting undetected oestrous events in dairy buffalo heifers are well-recognised problems in the industry. However, a detailed study to improve these problems through bull bio-stimulation has not been reported to the best of our knowledge. The hypothesis that bull bio-stimulation could help remedy lower oestrous behavioural expression and lead to more timely oestrus detection was confirmed in our study. The motivation to sniff and/or lick external genitalia (vulva and clitoris) by the bull and/or other animals in the pen is one of the preliminary markers of imminent oestrus in cows and buffaloes. By doing this, odorous oestrous molecules (pheromones) produced by the females are detected in the bull’s vomeronasal organ. These molecules are responsible for attracting bulls and promoting their sexual behaviour. Sniffing or licking external genitalia was observed at a higher frequency in T2 group heifers since the bull had a direct opportunity to perform these behaviours while it was present in the same shed as the heifers. The bull in the T1 group had limited opportunity to perform sniffing or licking since there was a fence barrier between it and the heifers. There are no previous studies on buffalo heifers reporting this behaviour. However, in cows, it was reported that at the pro-oestrus stage of the second cycle, other cows would sniff or lick the pro-oestrous cows considerably more commonly. The frequency of this behaviour remained low during the first cycle due to low levels of oestrogen, which elicits oestrous behavioural signs (Sveberg et al., Reference Sveberg, Refsdal, Erhard, Kommisrud, Aldrin, Tvete and Ropstad2011). The females’ physical activity was increased with direct bull exposure (López-gatius et al., Reference López-gatius, Santolaria, Mundet and Yaniz2005; Vyas et al., Reference Vyas, Briant, Chemineau, Le Danvic and Nagnan-le Meillour2012), which might explain why T2 heifers were more active and allowed more sniffing/licking than T1 heifers. In T0, the frequency of sniffing/licking was lower since there was only one heifer in oestrus at any particular moment. During the second cycle, the mean sniffing/licking frequency of T1 and T2 group heifers was higher because oestrous heifers and the bull visited each other more often through the fenceline and direct exposure. Previously, sniffing/licking of oestrous females’ external genitalia by a bull was observed to a greater extent when a teaser bull was introduced into a herd of buffaloes four times a day for 20–30 minutes each for oestrous detection (Joshi, Reference Joshi2016). The outcomes of current research are similar to those of Roelofs et al. (Reference Roelofs, Soede, Voskamp-harkema and Kemp2008) and Choudhary et al. (Reference Choudhary, Kamboj, Raheja, Singh, Kumar, Barman and Bhakat2019) in dairy cattle.
When the external vulva is sniffed or licked by a bull or other penmates, females will generally respond by raising their tails, especially if the female being inspected is in oestrus (Silper, Reference Silper2010). Consequently, females in the T1 and T2 groups displayed higher frequencies of tail raising during the pro-oestrus and oestrus phases of both cycles compared to the control group in the present study. This is likely due to sniffing or licking performed by the male in both bull-exposed groups. Verma et al. (Reference Verma, Prasad, Mohanty, Kumaresan, Layek, Patbandha and Kantwa2014) also observed that buffalo heifers in oestrous increased their tail raising when sniffed or licked by a teaser male on the day of oestrus (day 0). During the first cycle, the incidence of tail lifting was higher on day 0 in T2 heifers than in T1 heifers. This may be due to the bull having direct contact with the heifers and therefore more opportunities for sniffing and licking. The T1 heifers were attracted to the bull on the other side of the fenceline barrier, but they performed less tail-raising behaviour. This suggests that direct exposure to a male is more important for better exhibition of tail-raising behaviour. The current findings are consistent with López-Gatius et al. (Reference López-gatius, Santolaria, Mundet and Yaniz2005). During both first and second oestrous, tail raising was significantly reduced in all treatment groups on day +1, likely because of a corresponding decline in sniffing or licking on days following oestrous day.
In response to being sniffed/licked, heifers also responded with micturition behaviour. Hence, comparable patterns for these two behaviours were found. Micturition was more common in T2 heifers than in T1 heifers. It was also more common in T1 heifers than in T0 heifers. This might also be attributed to the bull being able to have direct contact for sniffing or licking behaviour. The current findings are consistent with Houpt et al. (Reference Houpt, Rivera and Glickstein1989) in dairy cattle and Verma et al. (Reference Verma, Prasad, Mohanty, Kumaresan, Layek, Patbandha and Kantwa2014) in buffaloes. The latter reported that most buffaloes displayed frequent micturition during oestrus in response to being sniffed or licked by a vasectomised male used for oestrous detection.
Bulls and heifers frequently rub or rest their chins on a cow’s or buffalo’s rear/rump prior to mounting. The cow/buffalo’s response to chin pressing gives a cue to the bull about their receptivity and readiness to be mounted. In the present study, average frequencies of chin resting, as expected, were greater in both groups of heifers exposed to a bull than in the control group. This indicated enhanced receptivity and willingness to accept courtship and copulatory attempts in heifers exposed to a bull compared to lower willingness to be mounted by the pen mates in control heifers. Kumar et al. (Reference Kumar, Singh, Singh and Phogat2006), Verma et al. (Reference Verma, Prasad, Mohanty, Kumaresan, Layek, Patbandha and Kantwa2014) and Joshi (Reference Joshi2016) had also reported that most buffaloes in oestrous allowed teaser bulls to perform chin resting behaviour as a method of oestrous detection. The current findings for this behaviour were observed to be similar to those of Roelofs et al. (Reference Roelofs, van Eerdenburg, Soede and Kemp2005) in Holstein-Friesian cows. This was consistent across both observed oestrous cycles.
When bulls are attracted to oestrous heifers’ pheromones, they evaluate the heifers’ receptiveness by attempting to mount them. This is reflected by higher frequencies of bull mounting attempts in both heifer groups exposed to a male in the current study. The results of Orihuela et al. (Reference Orihuela, Galina, Escobar and Riquelme1983) in cows were consistent with the present study. In contrast, Roelofs et al. (Reference Roelofs, Soede, Voskamp-harkema and Kemp2008) discovered that exposing dairy cows to fenceline bulls did not result in increased mounting attempts. This may be because the cows had to travel through one of the fence openings to observe and interact with the bull. On the other hand, the bull in the current study was maintained through a fenceline partition that allowed him to attempt to mount the females. This resulted in a higher frequency of mounting attempts. In both the first and second cycles, the frequency of mounting was lower in T0 heifers since they were mounted by other non-oestrous females of the same group. These findings confirm those of Hurnik (Reference Hurnik1987), who determined that mounting events had a longer duration when more than one female was in oestrus at the same time compared to when just one animal was responsive. The mounting attempts were almost doubled on day 0 during the second cycle than on day 0 during the first cycle, which could be due to longer oestrus duration during the second cycle.
During the first oestrous, none of the heifers displayed receptive standing behaviour in response to mounting by the male or herdmates. There is no progesterone priming before the first ovulation, which consequently lowers the concentration of oestradiol. This results in a lack of a stationary female stimulation to a male to mount during the first oestrous. Allrich (Reference Allrich1994) and Senger (Reference Senger1994) also found that post-partum cattle did not stand for mounting in their first oestrous without a male present. During the second cycle, higher oestradiol may have caused the females to stand adjacent to the male inside the shed, which prompted the males to mount T2 heifers. This is reflected by the highest frequency of standing for mounting in these heifers on day 0. Earlier, Gunasekaran et al. (Reference Gunasekaran, Singh and Gupta2007) and Verma et al. (Reference Verma, Prasad, Mohanty, Kumaresan, Layek, Patbandha and Kantwa2014) had reported that more than 90% of buffalo heifers showed this behaviour on the day of oestrus when a teaser bull was paraded in the animal pen. The results of Orihuela et al. (Reference Orihuela, Galina and Duchateau1988) in oestrus-synchronised zebu cows and Mat (Reference Mat2014) in Holstein Friesian heifers directly exposed to a bull also confirmed this pattern. Standing for mounting was performed less in the T1 group than the T2 group in the present study. This is likely due to the lack of opportunity for females in the T1 group to be mounted by a male as the fenceline partition is an obstacle, and there is less homosexual behaviour in buffaloes (Vale et al., Reference Vale, Ohashi, Sousay and Ribeiro1990). There are also few evidences that homosexual mounting behaviour in Indo-Brazilian cows (Orihuela et al., Reference Orihuela, Galina and Duchateau1988) and in Angus cows (Landaeta-Hernandez et al., Reference Landaeta-Hernandez, Meléndez, Bartolomé, Rae and Archbald2006) was suppressed in the presence of males in the sheds.
The concentration of P4 hormone more than 1 ng/ml of blood between the 7th and 15th days of the oestrous cycle further confirmed that all the heifers were in oestrus in the recent period.
In conclusion, bio-stimulation of buffalo heifers by direct or fenceline bull contact elicited clearer displays of oestrous behaviours that were performed in advance of oestrus (day 0) compared to heifers who did not have any bull exposure. This was consistent during both the first and second oestrous cycles. Furthermore, direct bull exposure improved oestrous behavioural expression in pubertal Murrah buffalo heifers more than fenceline exposure. It can be concluded that direct or fenceline bull bio-stimulation could be used as an important management tool that stimulates heifers to better express oestrous signs. This will lead to more timely detection of oestrus in Murrah buffalo heifers. However, direct bull exposure is preferable. An interesting observation was that during the first cycle, none of the heifers was willing to stand in position to be mounted. Moving forward, the ideal age of growing Murrah heifers for bio-stimulation and daily bull exposure period duration needs to be further investigated.
Supplementary material
The supplementary material for this article can be found at https://doi.org/10.1017/S0022029926102453.
Acknowledgements
The authors would like to express their gratitude to the Director of the ICAR-National Dairy Research Institute, Karnal, India, for providing the necessary funding and facilities to conduct this research. The authors also thank Amanda Barabas for assisting with manuscript editing through the International Society for Applied Ethology English Language Help Service.