1 Introduction
When a corrugated interface separating two fluids of different properties is impulsively accelerated by a shock wave, perturbations initially present on the interface grow first linearly, then nonlinearly, and finally induce a flow transition to turbulent mixing. This hydrodynamic instability is usually referred to as the Richtmyer–Meshkov instability (RMI) after the pioneering work of Richtmyer (Reference Richtmyer1960) and Meshkov (Reference Meshkov1969). A primary mechanism for such an instability is the baroclinic vorticity generation along the interface caused by the misalignment of the pressure and density gradients. Over the past few decades, the RMI has been the subject of intensive research due to its fundamental significance in academic research (e.g. compressible turbulence) as well as its crucial role in practical applications such as inertial confinement fusion (ICF) (Lindl et al. Reference Lindl, Landen, Edwards, Moses and Team2014).
Previous experiments on RMI mainly focused on the planar shock-induced case (Ranjan et al.
Reference Ranjan, Niederhaus, Oakley, Anderson, Bonazza and Greenough2008; Jacobs, Krivets & Tsiklashvili Reference Jacobs, Krivets and Tsiklashvili2013; Tomkins et al.
Reference Tomkins, Balakumar, Orlicz, Prestridge and Ristorcelli2013), and only few exceptions were dedicated to the convergent counterpart. Experiments on a cylindrical shock impacting a concentric gas cylinder were performed in a coaxial shock tube and the results indicated a quicker growth of the turbulent mixing zone in a convergent geometry than in the planar counterpart (Hosseini & Takayama Reference Hosseini and Takayama2005). Based on the shock dynamics theory, a special wall profile was designed to gradually transform a planar shock into a cylindrical one (Zhai et al.
Reference Zhai, Liu, Qin, Yang and Luo2010), and then experiments on gas interfaces subjected to a cylindrical shock were successfully performed (Luo et al.
Reference Luo, Zhang, Ding, Si, Yang, Zhai and Wen2018). A gas-lens technique was developed to generate cylindrical shocks in an ordinary shock tube, and the first experiments exhibited the great potential of the experimental method for studying convergent RMI (Vandenboomgaerde et al.
Reference Vandenboomgaerde, Rouzier, Souffland, Biamino, Jourdan, Houas and Mariani2018). Recently, quantitative measurements of sinusoidal
 $\text{air}/\text{SF}_{6}$
interfaces subjected to a cylindrical shock were achieved in a novel semi-annular shock tube (Ding et al.
Reference Ding, Si, Yang, Lu, Zhai and Luo2017), and influences of the convergence effects such as the Bell–Plesset (BP) and Rayleigh–Taylor (RT) effects on the instability growth were quantified for the first time.
However, experiments on the convergent RMI are limited to the single-interface case. For the convergent RMI in situations such as ICF, there exist two interfaces separating three material shells, i.e. the outer ablator, the middle solid deuterium–tritium (DT) shell and the inner gaseous DT fuel. When the capsule is irradiated by X-rays or a laser, perturbations develop on both the imploding inner and outer interfaces. The co-evolution of two interfaces of a layer is much more complicated than that of the single-interface case. First, complex wave patterns are generated and then reverberate between the two interfaces as an incident shock that refracts successively on the first and second surfaces, which considerably affects the pressure distribution and vorticity deposition (Henry de Frahan, Movahed & Johnsen Reference Henry de Frahan, Movahed and Johnsen2015). Secondly, the BP and RT effects may behave differently for the inner and outer interfaces with distinct radial trajectories (Ding et al. Reference Ding, Si, Yang, Lu, Zhai and Luo2017). Thirdly, there exists an evident coupling effect between two evolving interfaces with a short distance between them such that the development of each interface is strongly affected (Budzinski, Benjamin & Jacobs Reference Budzinski, Benjamin and Jacobs1994; Mikaelian Reference Mikaelian1995). Therefore, elaborate experiments on a perturbed layer interacting with a converging shock are highly desirable to understand this complex hydrodynamic phenomenon, which motivates the current study.
In this study, we shall perform experiments on a cylindrical shock accelerating a heavy gas shell in a semi-annular converging shock tube. As a first step, we only consider a heavy gas layer with a sinusoidal outer surface and a circular inner surface. The layer thickness is varied to highlight the interface–coupling effect. Also, influences of the outer perturbation amplitude and wavelength on the inner interface development are examined.
2 Experimental method
The overall structure of the semi-annular shock tube has been detailed in our previous work (Luo et al.
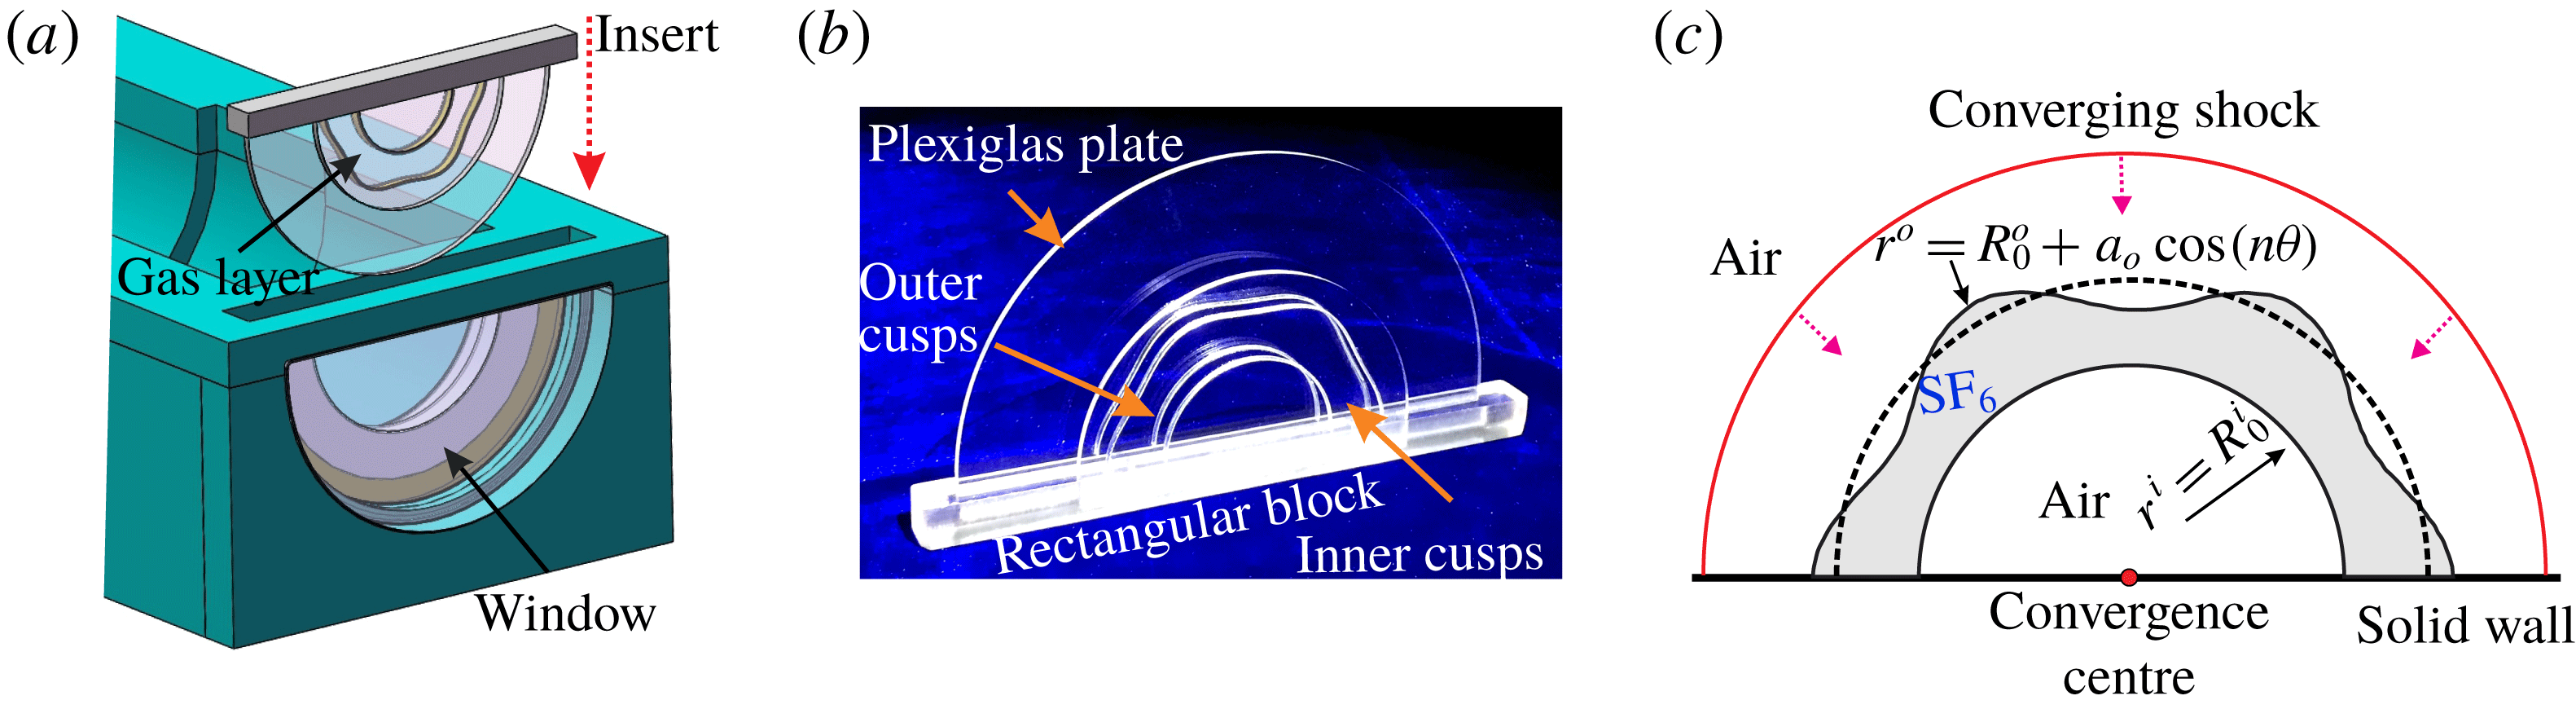
Reference Luo, Ding, Wang, Zhai and Si2015) and is not presented here. Benefitting from the semi-cylindrical configuration, a removable interface-formation device can be easily realized (figure 1
a). In this work, the soap-film technique (Ding et al.
Reference Ding, Si, Yang, Lu, Zhai and Luo2017) is further extended for generating a gas layer with controllable inner and outer interfaces. Figure 1(b) displays the actual model of the interface-formation device which consists of two parallel circular Plexiglas plates (120 mm and 80 mm in radius) fixed on a rectangular block. Two pairs of cusps with a designed shape (sinusoidal or circular) are, respectively, mounted on the inner surfaces of two parallel Plexiglas plates to produce a specific constraint. The cusps have a height of 0.15 mm, much smaller than that of the test section (5 mm), and thus have a negligible influence on the interface development (Ding et al.
Reference Ding, Si, Yang, Lu, Zhai and Luo2017). The region bounded by the inner and outer cusps on each plate is first wetted uniformly by some alcohol. A thin pipe with its leading end having been dipped into a little soap solution (made of 78 % distilled water, 2 % sodium oleate and 20 % glycerine in mass fraction) and trailing end connected to a gas balloon, is inserted into the device. As the test gas (
 $\text{SF}_{6}$
) is supplied by the gas balloon, an
 $\text{SF}_{6}$
bubble is blown through the leading end. The soap bubble first emerges as a gas cylinder bounded by the two parallel plates and then expands slowly along the cusp boundary. When the gas cylinder is completely in contact with the cusp, the gas tube is removed and an
 $\text{SF}_{6}$
layer is formed. Then, the whole device is immediately inserted into the test section and in tight contact with the optical windows on both sides of the test section.
Drawing of the interface-formation device and the open test section (a), an actual model of the interface formation device (b) and a schematic of a cylindrical shock impacting an
 $\text{SF}_{6}$
layer surrounded by air (c). Outer interface:
 $r^{o}=R_{0}^{o}+a_{0}\cos (n\unicode[STIX]{x1D703})$
, inner interface:
 $r^{i}=R_{0}^{i}$
, where
 $R_{0}$
: position of initial interface,
 $a_{0}$
: initial amplitude,
 $n$
: azimuthal mode number. Superscripts
 $o$
and
 $i$
denote the outer and inner interfaces, respectively.

In the present study, we only consider one type of perturbed gas layer with a sinusoidal outer surface and a circular inner surface. In a cylindrical coordinate system, the single-mode outer interface can be described as
 $r^{o}=R_{0}^{o}+a_{0}\cos (n\unicode[STIX]{x1D703})$
and the cylindrical inner surface as
 $r^{i}=R_{0}^{i}$
(figure 1
c). Here, the superscripts
 $o$
and
 $i$
correspond to the outer and inner surfaces of the gas layer, respectively,
 $R_{0}$
is the mean radius of the initial interface,
 $a_{0}$
is the initial amplitude and
 $n$
is the azimuthal mode number. Due to the wide-open inner core, a Z-fold high-speed schlieren system can be readily adapted to the shock tube facility, which much reduces the difficulty of flow diagnostics. The frame rate of the high-speed video camera (FASTCAM SA5, Photron Limited) is set as 50 000 f.p.s. with a shutter time of
 $1~\unicode[STIX]{x03BC}\text{s}$
. Spatial resolution of the schlieren images is approximately
 $3.2~\text{pixel}~\text{mm}^{-1}$
. The ambient pressure and temperature are 101.3 kPa and 298.0 K, respectively.
3 Results and discussion
3.1 Unperturbed gas shell
To provide a background flow, the interaction between a semi-cylindrical
 $\text{SF}_{6}$
layer (
 $r^{o}=55.0~\text{mm}$
,
 $r^{i}=30.0~\text{mm}$
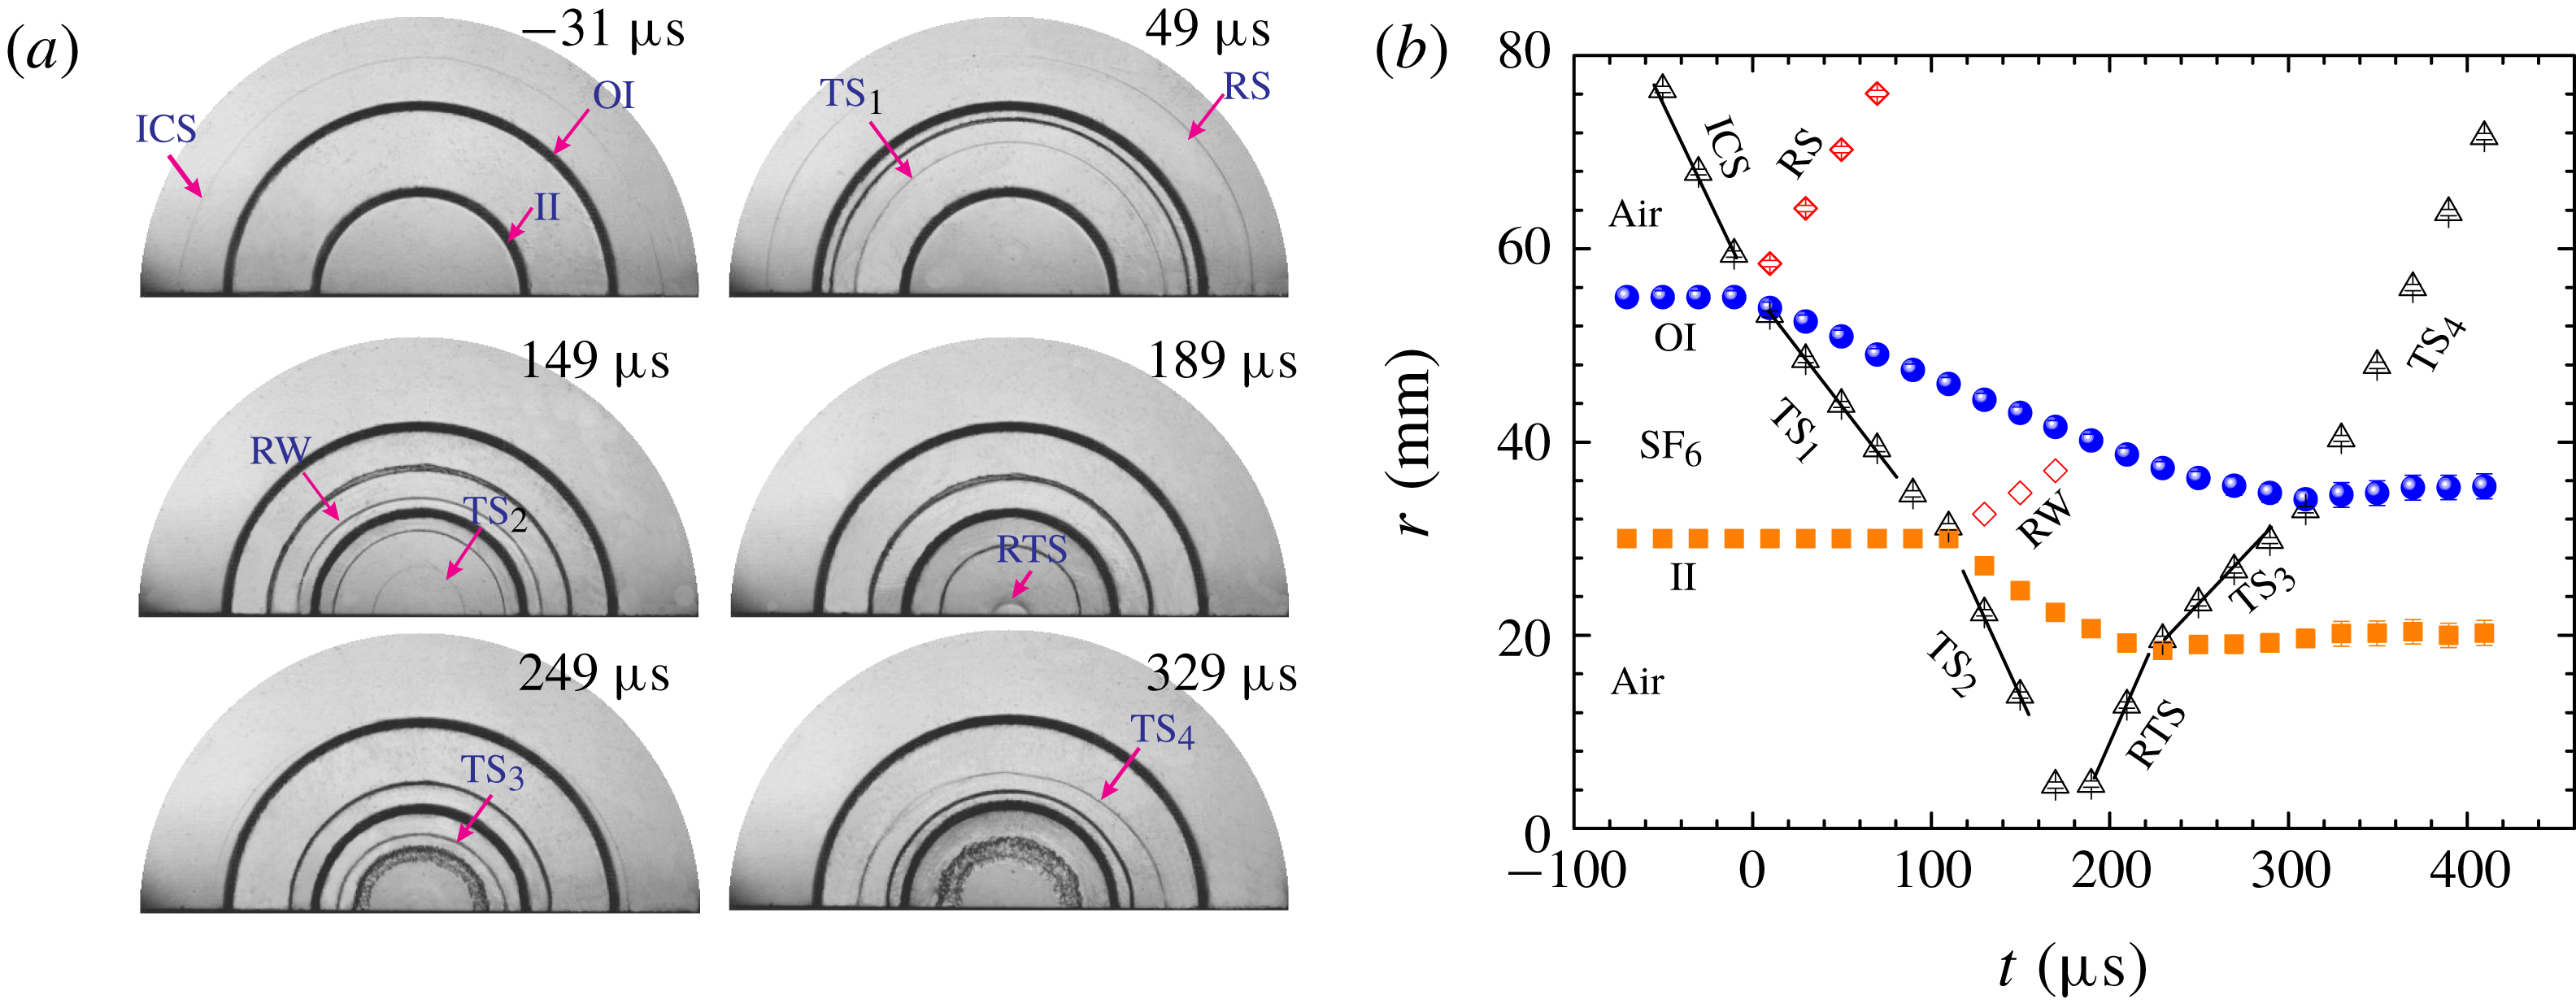
) and a concentric cylindrical shock is first examined. Representative schlieren images are displayed in figure 2(a). At the beginning, both the outer (
 $\text{air}/\text{SF}_{6}$
) and inner (
 $\text{SF}_{6}/\text{air}$
) interfaces as well as the incident cylindrical shock (ICS) can be clearly identified (
 $-31~\unicode[STIX]{x03BC}\text{s}$
). The perfect cylindrical shape for both the shock and interfaces demonstrates the good reliability of the present experimental method. As the ICS moves inward and collides with the outer interface, it bifurcates into an inward-moving transmitted shock (
 $\text{TS}_{1}$
) and an outward-moving reflected shock (RS) (
 $49~\unicode[STIX]{x03BC}\text{s}$
). Simultaneously, the shocked outer interface moves inward following the
 $\text{TS}_{1}$
. Later, the
 $\text{TS}_{1}$
collides with the inner interface, generating a second ingoing transmitted shock (
 $\text{TS}_{2}$
) and an outgoing rarefaction wave (RW) (
 $149~\unicode[STIX]{x03BC}\text{s}$
). It is interesting that the RW formed here remains concentrated in shape and thus seems like a shock wave. This is mainly ascribed to the non-uniform flow field in the convergent geometry as numerically found by Lombardini, Pullin & Meiron (Reference Lombardini, Pullin and Meiron2014). The shocked inner interface also moves inward following the
 $\text{TS}_{2}$
. As the
 $\text{TS}_{2}$
reaches the geometry centre, a shock focusing happens accompanied by the formation of a reflected transmitted shock (RTS). Later, the outgoing RTS impacts the inner interface. This is called a reshock and is a typical flow phenomenon in the convergent RMI. Re-accelerated by the RTS, the inward-moving inner interface suffers a sudden decrease in velocity (to nearly zero) and then evolves at nearly a fixed radial position. Meanwhile, a third transmitted shock (
 $\text{TS}_{3}$
) as well as a reflected shock (not noticeable in the schlieren image due to its very weak strength) is generated. Later, the
 $\text{TS}_{3}$
collides with the outer interface, causing a quick drop of its velocity to nearly zero.
(a) Schlieren images showing the evolution of a semi-annular
 $\text{SF}_{6}$
layer surrounded by air impacted by a cylindrical shock. (b) Temporal variations of the displacements of interfaces and waves. ICS: incident cylindrical shock; OI: outer interface; II: inner interface; RS: reflected shock;
 $\text{TS}_{i}$
:
 $i$
th transmitted shock; RW: rarefaction wave; RTS: reflected transmitted shock.

As quantitatively presented in figure 2(b), the ICS propagates initially in air at a nearly constant speed of
 $426~\text{m}~\text{s}^{-1}$
, corresponding to a Mach number of 1.23. Impacted by the ICS, the outer interface speeds up rapidly to a velocity of
 $86~\text{m}~\text{s}^{-1}$
. According to the one-dimensional shock dynamics theory, the
 $\text{SF}_{6}$
mass fraction for the gas mixture inside the layer is estimated to be approximately 89 %. The velocity of the generated
 $\text{TS}_{1}$
is measured to be about
 $223~\text{m}~\text{s}^{-1}$
, which agrees well with the theoretical prediction (
 $228~\text{m}~\text{s}^{-1}$
) using the estimated gas concentration. Accelerated by the
 $\text{TS}_{1}$
, the inner interface attains a velocity of
 $120~\text{m}~\text{s}^{-1}$
at the early stage, and later experiences a deceleration phase similar to that in the single-interface case (Ding et al.
Reference Ding, Si, Yang, Lu, Zhai and Luo2017). After the shock focusing, the generated RTS explodes outwards at a nearly constant speed of
 $490~\text{m}~\text{s}^{-1}$
, and later re-accelerates the inner and outer interfaces successively. Then, both the inner and outer interfaces stay at a nearly constant radial location. Note that the experimental uncertainties on the shock and interface speeds are within
 $6~\text{m}~\text{s}^{-1}$
, and the nearly constant motion of the shock and the interface exists only within the time frame of interest. The present result indicates several new physical regimes of the cylindrical RMI as compared with the planar counterpart. First, the shocked interface moves inward and the geometry convergence effect continuously influences the instability development. Second, the interface experiences a deceleration before the reshock, and thus an RT stability (instability) effect is produced on the evolving light/heavy (heavy/light) interface, which inhibits (promotes) the instability growth. Third, the reshock happens inevitably in convergent RMI (producing additional baroclinic vorticity on the evolving interface), making the evolution process much more complicated.
3.2
 $\mathit{SF}_{6}$
layers of different thickness

Three
 $\text{SF}_{6}$
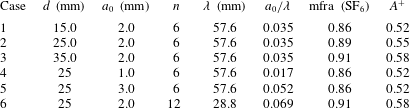
layers with different thickness subjected to a cylindrical shock are then examined. The detailed parameters corresponding to initial conditions for each case (Cases 1–3) are listed in table 1. The Atwood number is defined as
 $A=(\unicode[STIX]{x1D70C}_{2}-\unicode[STIX]{x1D70C}_{1})/(\unicode[STIX]{x1D70C}_{2}+\unicode[STIX]{x1D70C}_{1})$
with
 $\unicode[STIX]{x1D70C}_{2}$
and
 $\unicode[STIX]{x1D70C}_{1}$
being the gas densities inside and outside the layer, respectively. The mean position of the outer interface is fixed at
 $R_{0}^{o}=55.0~\text{mm}$
, and three different radii of
 $R_{0}^{i}=40.0$
, 30.0 and 20.0 mm for the inner interface are adopted, corresponding to layer thicknesses of
 $d=15.0$
, 25.0 and 35.0 mm, respectively. The amplitude-to-wavelength ratio for the outer perturbation is 0.035, which satisfies the small perturbation requirement. Note that a high concentration of
 $\text{SF}_{6}$
is obtained for all cases, which ensures a good repeatability of the experiments. It should be mentioned that in our experiments it is very difficult to generate perturbed interfaces with large azimuthal mode number (
 $n>12$
) and amplitude (
 $a_{0}>5~\text{mm}$
). A main reason is that to produce perturbed soap-film interfaces with large
 $n$
or
 $a_{0}$
, a strong surface tension is required, which brings a great challenge for the material properties of soap solution. In this work, to ensure the formation of a periodic and symmetric interface in a semi-cylindrical geometry as well as to obtain various amplitude-to-wavelength ratios for parametrical study,
 $n=6$
is chosen and also
 $n=12$
(Case 6) is considered to examine the wavenumber effect on the instability growth.
Parameters of the initial conditions for different cases:
 $\unicode[STIX]{x1D706}$
refers to the pre-shock wavelength of the outer interface,
 $A^{+}$
to the post-shock Atwood number, mfra (
 $\text{SF}_{6}$
) to the mass fraction of
 $\text{SF}_{6}$
inside the layer and
 $d$
is the layer thickness.

 $\text{SF}_{6}$
layers with different thickness subjected to a cylindrical shock. Symbols are the same as those in figure 2.

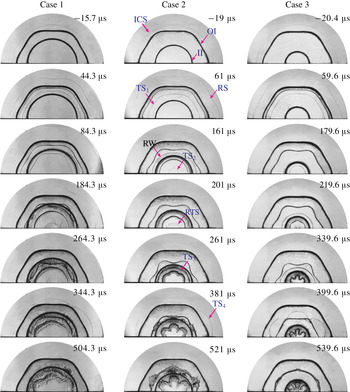
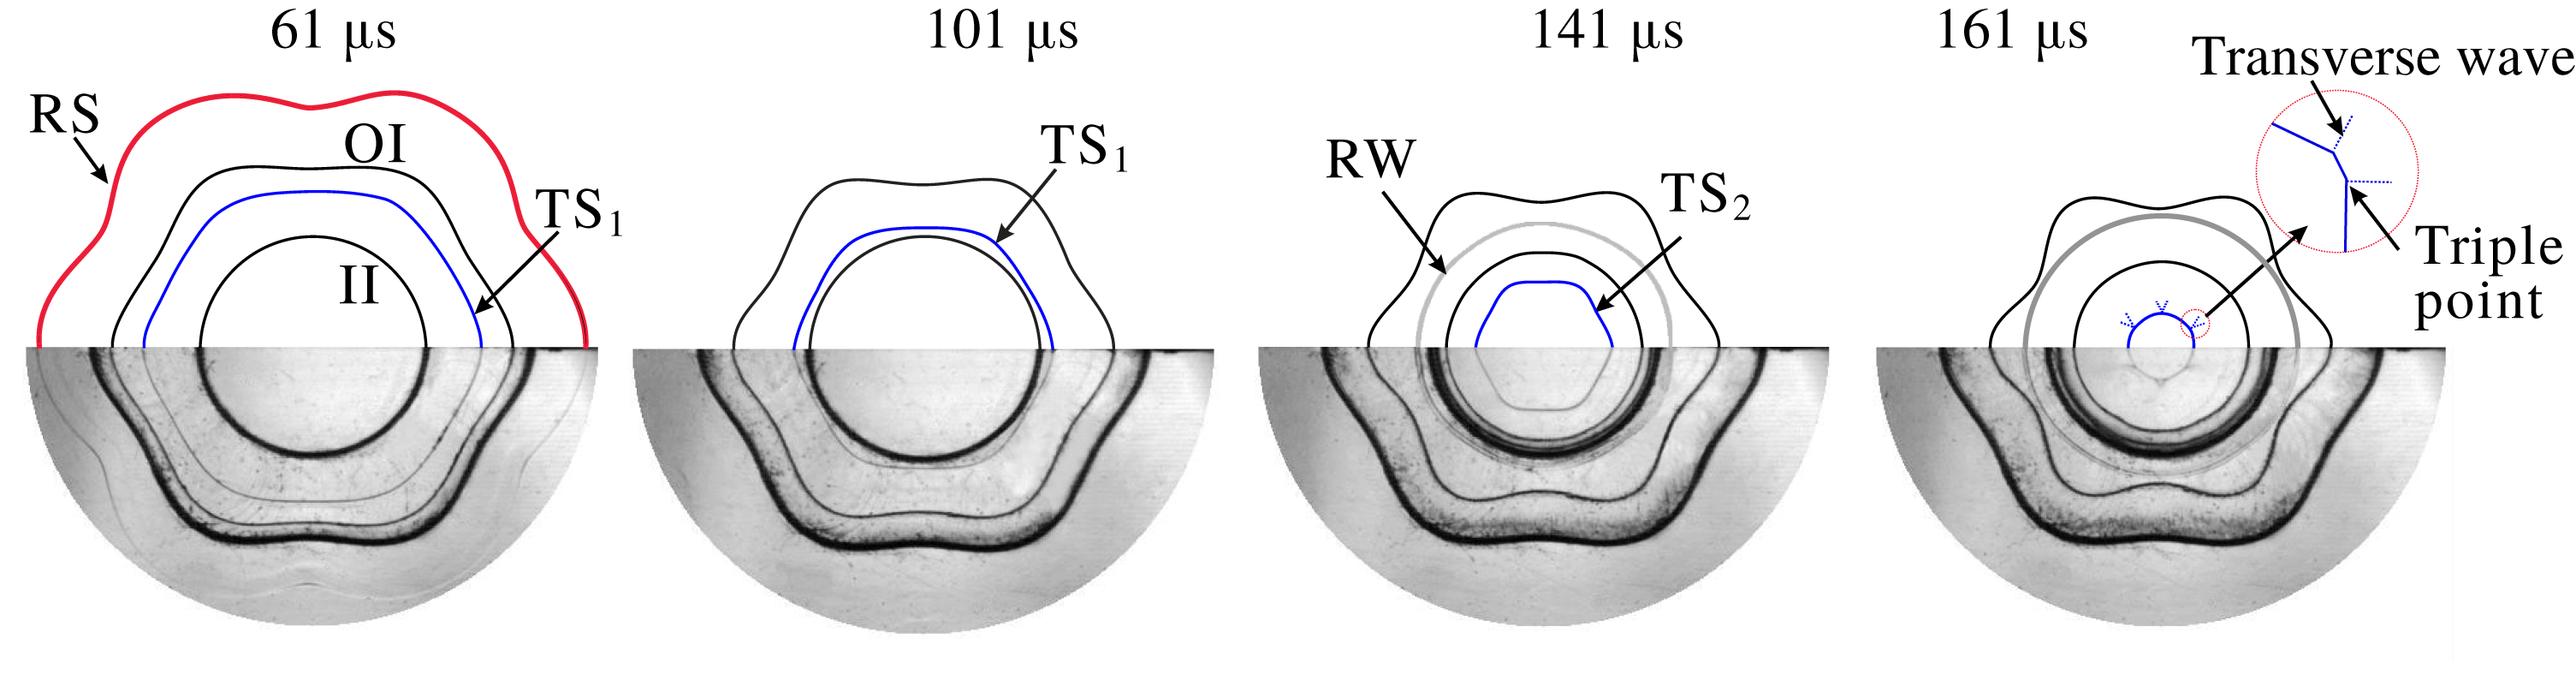
Wave patterns and interface morphologies for the three cases are well captured by the high-speed schlieren photography. As shown in figure 3, the development processes are generally similar for the three cases. Take Case 2 as an example to discuss the detailed evolution process. Initially, the ICS together with the outer and inner interfaces can be clearly identified (
 $-19~\unicode[STIX]{x03BC}\text{s}$
). The ICS first collides with the sinusoidally perturbed outer interface, generating an outward-moving RS and an inward-moving TS. Both the RS and TS present a sine-like shape, which indicates a transfer of the initial perturbation of the outer interface to the generated waves during the shock refraction. After the ICS passage, the outer perturbation amplitude first decreases due to shock compression, and then increases continuously driven by the RMI and the convergence effects. Detailed observations of the wave patterns at four moments before the shock focusing are shown in figure 4. It is seen that the front of the
 $\text{TS}_{1}$
maintains a sine-like shape during the implosion, which is different from the planar case where the distorted shock recovers quickly to become uniform. Thus, the
 $\text{TS}_{1}$
–inner interface interaction here is essentially the problem of a distorted shock interacting with an unperturbed interface in a convergent geometry. As recently reported by Zou et al. (Reference Zou, Liu, Liao, Zheng, Zhai and Luo2017) and Zhai et al. (Reference Zhai, Liang, Liu, Ding, Luo and Zou2018), the driving mechanism of such an instability is quite different from that of the standard RMI (uniform shock interacting with perturbed interface), and the perturbation growth of the non-standard RMI is relatively slower. As the
 $\text{TS}_{1}$
moves inward, the trough of its front first encounters the inner interface, followed by the crest. As a result, a part of the
 $\text{TS}_{1}$
is transmitted into air in advance, attaining a higher speed due to the smaller acoustic impedance of air, while the rest still propagates in
 $\text{SF}_{6}$
at a much lower speed. This velocity difference produces a larger perturbation on the formed
 $\text{TS}_{2}$
. It means that the unperturbed
 $\text{SF}_{6}/\text{air}$
interface serves as an ‘amplifier’ for the perturbation amplitude of the passing shock. The
 $\text{TS}_{2}$
also presents a sinusoidal shape with an initial phase identical to the
 $\text{TS}_{1}$
, and later transforms to a hexagon with transverse waves attached to triple points. The present wave patterns are similar to those of cylindrical shock–polygonal gas cylinder interactions (Lei et al.
Reference Lei, Ding, Si, Zhai and Luo2017).
Evolution of the wave patterns at four moments before shock focusing for Case 2.

Small perturbations are introduced to the inner interface by the passage of the distorted
 $\text{TS}_{1}$
. These small perturbations develop slowly at the beginning and are visible until
 $201~\unicode[STIX]{x03BC}\text{s}$
. It should be noted that the perturbation phase of the inner interface is opposite to that of the outer interface. For convenience of expression, in this work, the amplitude of the initial outer perturbation is defined as positive and the inner perturbation is negative. As experimentally found by Budzinski et al. (Reference Budzinski, Benjamin and Jacobs1994) and theoretically analysed by Mikaelian (Reference Mikaelian1995), there exists a significant coupling effect between two nearby evolving interfaces in a planar geometry. This coupling effect should also exist in the convergent situation, i.e. the growth of the outer perturbation will trigger an in-phase perturbation growth on the inner interface. Conversely, the distorted transmitted shock, which plays an important role in the early-stage instability development, induces an anti-phase growth on the inner interface. The net growth of the inner perturbation is negative, which indicates that the distorted shock overwhelms the interface–coupling effect at the early stage. Note that the former has never been considered in previous theories under the incompressible fluid assumption. As time proceeds, the
 $\text{TS}_{2}$
focuses at the convergence centre and the RTS is bounced back accompanied by numerous disturbance waves. Then, the exploding RTS collides with the evolving inner interface (
 $201~\unicode[STIX]{x03BC}\text{s}$
), causing a quick perturbation growth. Later, nonlinear flow structures including the outward-pointing bubble and inward-pointing spike appear (
 $381~\unicode[STIX]{x03BC}\text{s}$
). Also, the outgoing
 $\text{TS}_{4}$
will re-accelerate the evolving outer interface, causing a phase inversion followed by a rapid instability growth.
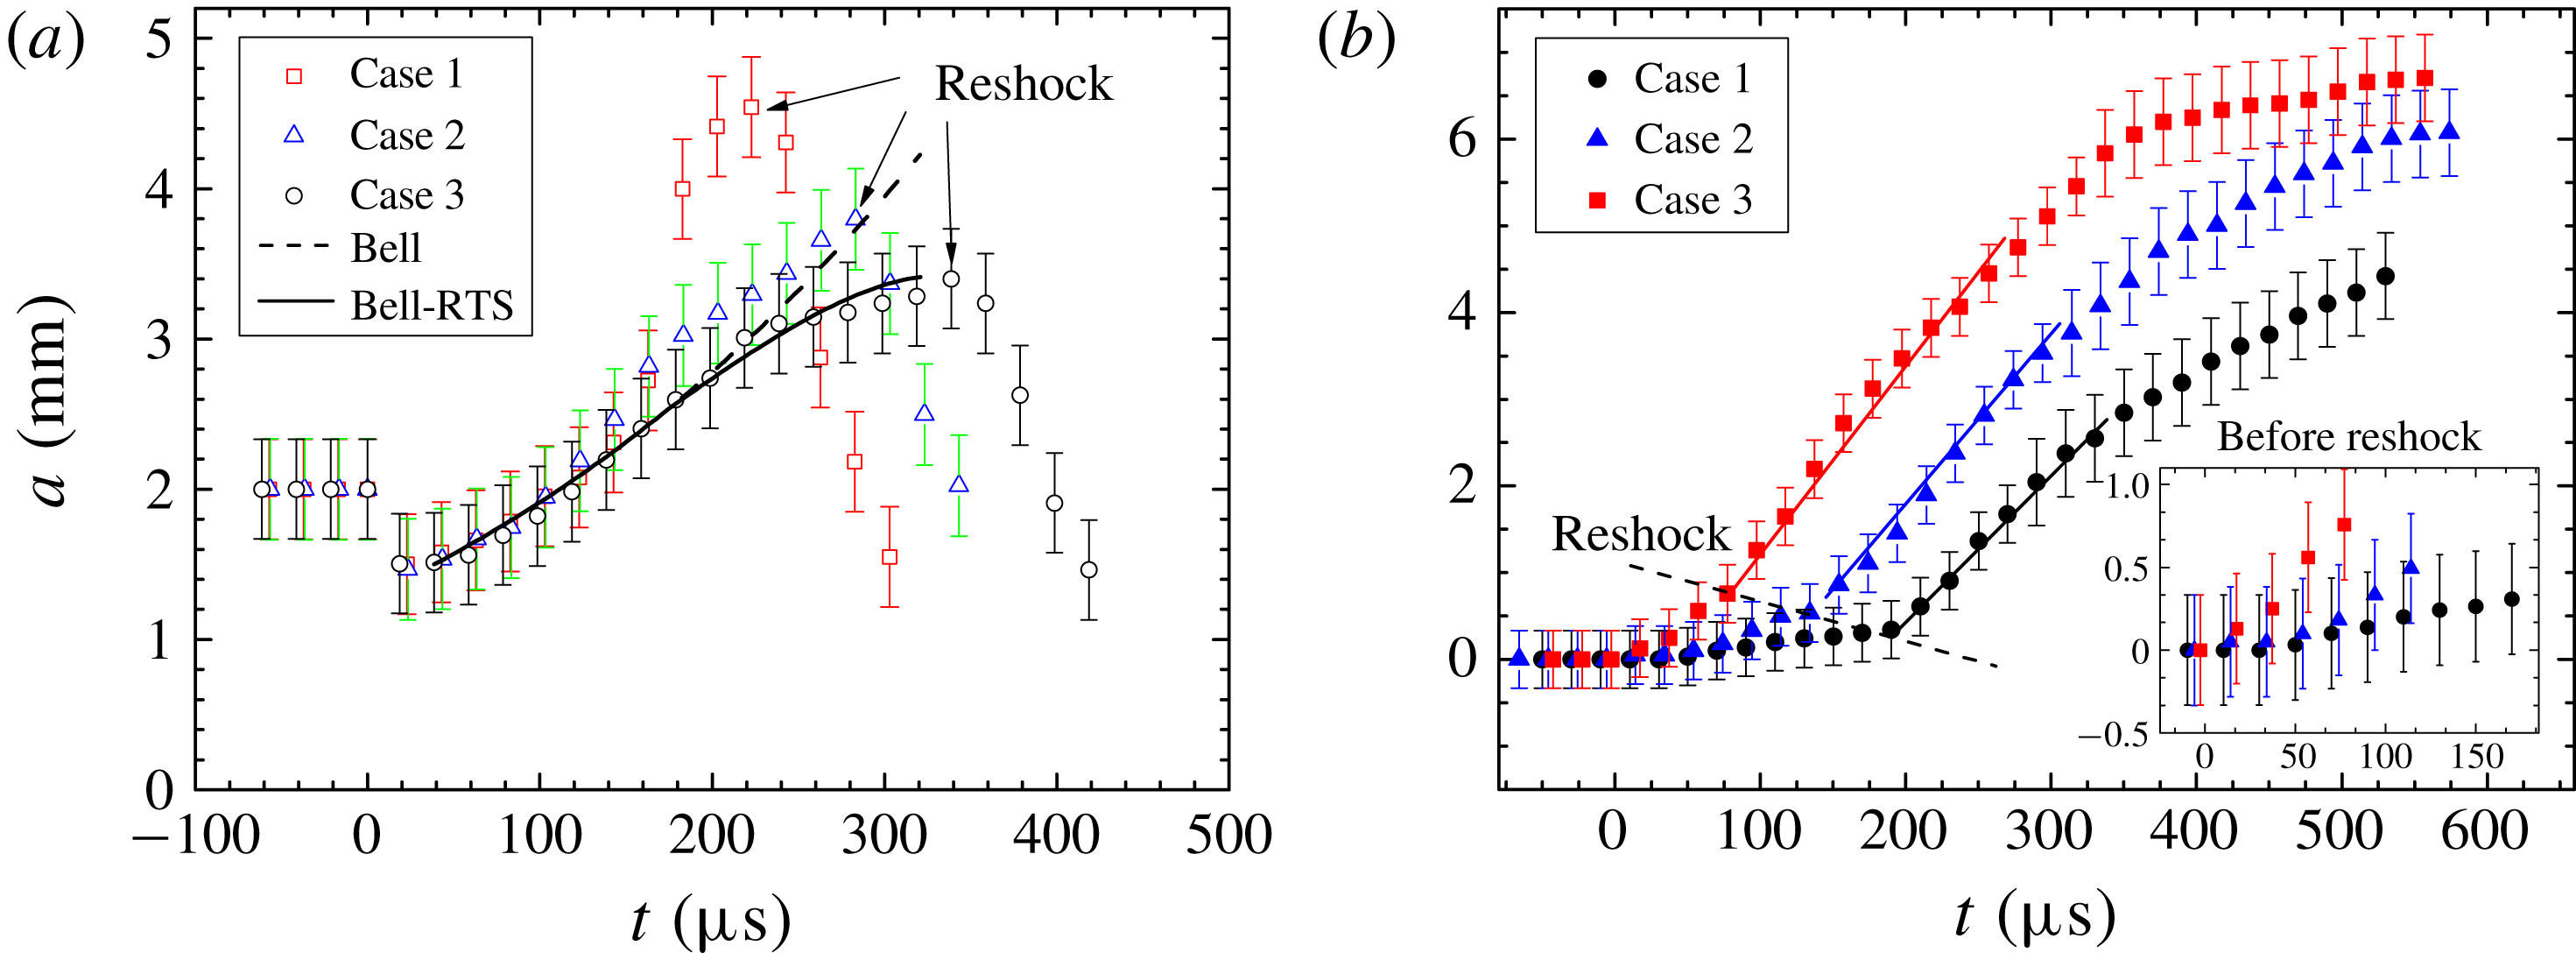
Temporal variations of the amplitudes of the outer (a) and inner (b) interfaces. The predictions of Bell theory (Bell Reference Bell1951) and Bell-RTS theory (Ding et al. Reference Ding, Si, Yang, Lu, Zhai and Luo2017) are given for comparison.

Benefiting from the clear interfacial morphologies captured, amplitudes of the inner and outer interfaces can be accurately measured from the schlieren pictures and their temporal variations are plotted in figure 5, where the predictions of Bell theory (Bell Reference Bell1951) and Bell-RTS theory (Ding et al. Reference Ding, Si, Yang, Lu, Zhai and Luo2017) developed for the cylindrical RMI of a single interface are also given for comparison. According to the analyses of Bell (Reference Bell1951) and Mikaelian (Reference Mikaelian2005), the perturbation growth for the cylindrical RMI of a single sinusoidal interface can be described as
 $$\begin{eqnarray}\frac{1}{r^{2}}\frac{\text{d}(r^{2}{\dot{a}})}{\text{d}t}=(nA-1)\frac{\ddot{r}}{r}a,\end{eqnarray}$$
where
 ${\dot{a}}$
is the first time derivative of amplitude and
 $\ddot{r}$
is the second time derivative of radius. Treating the shock impact as an impulsive function
 $\ddot{r}=\unicode[STIX]{x1D6FF}(t)\unicode[STIX]{x0394}V$
, the amplitude variation versus time can be obtained by integrating equation (3.1),
 $$\begin{eqnarray}a(t)-a_{0}={\dot{a}}_{0}R_{0}^{2}\int _{t_{0}^{+}}^{t}\frac{1}{r^{2}}\,\text{d}t+(nA-1)\int _{t_{0}^{+}}^{t}\left(\frac{1}{r^{2}}\int _{t_{0}^{+}}^{t}ar\ddot{r}\,\text{d}t^{\prime }\right)\text{d}t,\end{eqnarray}$$
where
 $t_{0}^{+}$
refers to the time right after the shock passage and
 ${\dot{a}}_{0}$
to the initial growth rate due to the shock impact. The first term on the right-hand-side of (3.2) corresponds to the combination of the pure RM instability with the BP effect and the second term to the RT effect caused by the non-uniform motion of the interface. Since (3.2) accounts for the RT effect on the RMI, it is termed the Bell-RTS model. If the interface is assumed to move uniformly all the time, the second term equals zero and the model reduces to that of Bell (Reference Bell1951).
As shown in figure 5, for Case 3, the outer interface develops in a highly similar way to that of the single-interface case (Ding et al. Reference Ding, Si, Yang, Lu, Zhai and Luo2017), namely, an increasing growth rate at the early stage due to the BP effect and a decreasing growth rate at the late stage caused by the RT stabilization. The Bell-RTS theory, accounting for the RT stabilization associated with the interface deceleration, can give a reasonable forecast of its amplitude growth before the reshock. It demonstrates that for Case 3 with a relatively larger layer thickness, the presence of the inner interface has a negligible influence on the outer interface development, i.e. the two interfaces decouple in this situation.
Because the convergence effects have only a minor influence on the early-stage evolution (Luo et al.
Reference Luo, Zhang, Ding, Si, Yang, Zhai and Wen2018), the coupling strength between the inner and outer interfaces of the present cylindrical shell can be approximately estimated by a coupling angle (
 $\unicode[STIX]{x1D6FC}$
) as used in a planar geometry (Mikaelian Reference Mikaelian1995),
 $$\begin{eqnarray}\sin \unicode[STIX]{x1D6FC}=(2W^{o}/W^{i})/[1+(W^{o}/W^{i})^{2}],\end{eqnarray}$$
where
 $$\begin{eqnarray}\displaystyle \frac{W^{o}}{W^{i}} & = & \displaystyle 1+\sinh (kd)\tanh \left(\frac{kd}{2}\right)+\sinh (kd)\frac{\unicode[STIX]{x1D70C}_{1}}{\unicode[STIX]{x1D70C}_{2}}\nonumber\\ \displaystyle & & \displaystyle \times \,\left\{1+\left[1+\left(\frac{\unicode[STIX]{x1D70C}_{2}}{\unicode[STIX]{x1D70C}_{1}}\right)^{2}+2\left(\frac{\unicode[STIX]{x1D70C}_{2}}{\unicode[STIX]{x1D70C}_{1}}\right)\coth (kd)\right]^{1/2}\right\}.\end{eqnarray}$$
Note that the wavenumber
 $k$
equals
 $n/R$
in a cylindrical geometry. Then, the perturbation growth rate for each interface of the gas layer can be expressed as
 $$\begin{eqnarray}{\dot{a}}_{o}=\frac{\unicode[STIX]{x0394}V\unicode[STIX]{x1D70F}^{2}}{\cos \unicode[STIX]{x1D703}}[a_{0}^{o}-a_{0}^{i}\sin \unicode[STIX]{x1D6FC}],\quad {\dot{a}}_{i}=\frac{\unicode[STIX]{x0394}V\unicode[STIX]{x1D70F}^{2}}{\cos \unicode[STIX]{x1D703}}[a_{0}^{i}-a_{0}^{o}\sin \unicode[STIX]{x1D6FC}],\end{eqnarray}$$
where
 $\unicode[STIX]{x1D70F}^{2}=[k(\unicode[STIX]{x1D70C}_{2}/\unicode[STIX]{x1D70C}_{1}-1)]/[1+(\unicode[STIX]{x1D70C}_{2}/\unicode[STIX]{x1D70C}_{1})^{2}+2(\unicode[STIX]{x1D70C}_{2}/\unicode[STIX]{x1D70C}_{1})\coth (kd)]$
and
 $\unicode[STIX]{x0394}V$
is the velocity jump induced by the shock impact.
The coupling angles as well as the growth rates of both interfaces for three cases. Here,
 ${\dot{a}}_{o}$
and
 ${\dot{a}}_{i}$
represent the growth rates of outer and inner interfaces, respectively.

The quantitative results are given in table 2. It is seen that
 $\unicode[STIX]{x1D6FC}$
for Case 3 is very small, which indicates a very weak interface coupling. This provides strong evidence for the interface decoupling of Case 3 as shown in figure 5(a). Although the coupling angle becomes greater for Cases 2 and 1, the growth rate of the outer interface suffers only a slight variation as compared to that of Case 3. It means that the interface coupling has a very weak effect on the outer interface development for the current experimental configuration. This reasonably well explains the good agreement of the present outer interface development with the prediction of Bell theory developed for single-interface situations at the early stage for all three cases (
 $t<120~\unicode[STIX]{x03BC}\text{s}$
). Since the mean positions of the inner and outer interfaces become closer and closer during the implosion and also the quick growth of the outer perturbation greatly facilitates the proximity of two interfaces, the strength of interface coupling is gradually augmented. This is the main reason for the quick rise in growth rate of the outer perturbation for Case 1 at
 $120~\unicode[STIX]{x03BC}\text{s}$
as shown in figure 5(a). For Case 2 with a moderate coupling strength, the promotion on the outer perturbation growth is also noticeable. The quasi-linear growth of the outer perturbation of Case 2 at late stages may be due to the counteraction between the coupling effect and the RT stabilization. Note that the interface morphologies in this work are determined by the central position of the material and thus the error bars represent the thickness of the material layer in the schlieren images.
As shown in figure 5(b), impacted by the distorted
 $\text{TS}_{1}$
, the inner interface acquires a slow perturbation growth before the reshock. The growth rate for each case can be approximately obtained by a linear fitting of the experimental data and is listed in table 3. According to the work of Zou et al. (Reference Zou, Liu, Liao, Zheng, Zhai and Luo2017) and Zhai et al. (Reference Zhai, Liang, Liu, Ding, Luo and Zou2018), the perturbation growth rate of a uniform interface induced by a rippled shock can be estimated by
 ${\dot{a}}=a_{i0}kA^{+}\unicode[STIX]{x0394}V$
where
 $a_{i0}$
is interface amplitude right after the passage of the rippled shock. The values of the related parameters as well as the predicted growth rates are given in table 3. It is seen that the experimental growth rates for Cases 2 and 3 agree reasonably well with the prediction, whereas that of Case 1 deviates greatly. The difference between the experimental growth rate and the model prediction is nearly equal to the
 ${\dot{a}}_{i}$
listed in table 2. It indicates that the strong interface coupling in Case 1 causes a considerable positive perturbation growth of the inner interface, which largely counteracts the perturbation growth (negative growth) induced by the rippled shock. This result suggests that the development of the inner interface before reshock can be controlled by adjusting the layer thickness.
Experimental growth rate of the inner interface before the reshock and the theoretical prediction of Zhai et al. (Reference Zhai, Liang, Liu, Ding, Luo and Zou2018).

Experimental growth rate of the inner interface after the reshock and the theoretical prediction of Mikaelian (Reference Mikaelian1989). The superscript ‘
 $+$
’ denotes values after the reshock.

After the reshock, the amplitude of the inner interface increases linearly at the early stage for the three cases, and the growth rates are listed in table 4. The small discrepancy in growth rate among three cases is mainly ascribed to the different strength of the exploding shock at its contact with the interface. An empirical model of Mikaelian (Reference Mikaelian1989) was used to calculate the growth rate of the reshocked interface,
 ${\dot{a}}=b\unicode[STIX]{x0394}VA^{+}$
with
 $b$
an empirical coefficient ranging from 0.28 to 0.39 in a planar situation (Leinov et al.
Reference Leinov, Malamud, Elbaz, Levin, Ben-Dor, Shvarts and Sadot2009). Here, with the linear growth rate fitted from the experimental data listed in table 4 as well as the measured values for
 $\unicode[STIX]{x0394}V$
and
 $A^{+}$
, the coefficient for each case can be readily calculated. The calculated coefficients for Cases 1–3 are
 $b=0.32$
, 0.31 and 0.30, respectively. Considering the measuring and fitting errors, here an averaged value
 $b=0.31$
is adopted, which gives a reasonable prediction of the experimental results for all cases. To the authors’ knowledge, this is the first empirical coefficient to be found for the reshocked RMI in convergent geometry. It should be noted that at late stages, the geometry convergence or divergence effect produces a negligible influence on the instability growth, as shown in the unperturbed case. This is a major reason for the agreement of the present experimental data with the prediction of Mikaelian (Reference Mikaelian1989)’s theory originally developed for the reshock RMI in planar geometry. For Cases 2 and 3, after the termination of the linear stage, the growth rate decreases continuously, and finally the perturbation stagnates with a constant amplitude. In Case 1, the perturbation presents a quasi-linear growth with a smaller growth rate at late stages, which can be partially ascribed to the strong interface coupling in Case 1 such that the in-phase outer perturbation triggers persistent growth of the inner perturbation. Another reason is that the inner surface is relatively far from the geometry centre and thus suffers little influence by the complex flow field in the central region. Note that the error for the experimental growth rates in tables 2–4 is approximately
 $0.5~\text{m}~\text{s}^{-1}$
.
3.3
$\mathit{SF}_{6}$
layers with different amplitudes and wavelengths for the outer interface

As described above, for the present gas layers, the initially smooth inner surface exhibits a quick instability growth after reshock and its perturbation amplitude is even larger than that of the outer surface at late stages. Such an instability growth on the inner interface should be of special concern in ICF because it can greatly degrade the extreme thermodynamic state of the central fuel and further reduce the fusion yield. In this section, we intend to investigate the outer perturbation influence on the development of the inner interface. Three
 $\text{SF}_{6}$
layers with a fixed thickness (25 mm) but different amplitudes and wavelengths for the outer perturbation are considered. The detailed parameters corresponding to the initial conditions for each case (Cases 4–6) are listed in table 1.
 $\text{SF}_{6}$
layers with different outer perturbations:
 $a_{0}=1$
,
 $n=6$
(Case 4),
 $a_{0}=2$
,
 $n=6$
(Case 5) and
 $a_{0}=3$
,
 $n=12$
(Case 6) subjected to a cylindrical shock. Symbols are the same as those in figure 2.

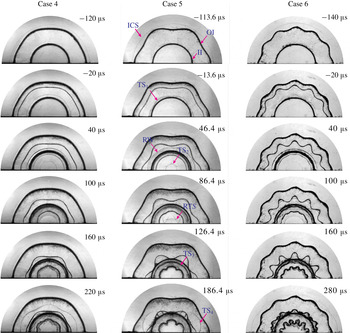
Representative schlieren images illustrating the detailed processes of wave propagation and interface deformation for the three cases are shown in figure 6. It is seen that the amplitude and the wavelength of the initial outer interface can be readily adjusted, which demonstrates the good flexibility of the current experimental method. The whole evolution processes for the three shells are generally similar to those of varying thickness cases. Specifically, the traverse of the distorted
 $\text{TS}_{1}$
seeds a slight perturbation on the initially smooth inner interface, and this small perturbation undergoes a slow growth before the reshock. An outward-moving RTS is generated immediately after the focusing of
 $\text{TS}_{2}$
, and it later re-accelerates the inner interface again, causing a quick instability growth. It is found that the azimuthal mode number of the outer perturbation is well ‘remembered’ by the developing inner interface.
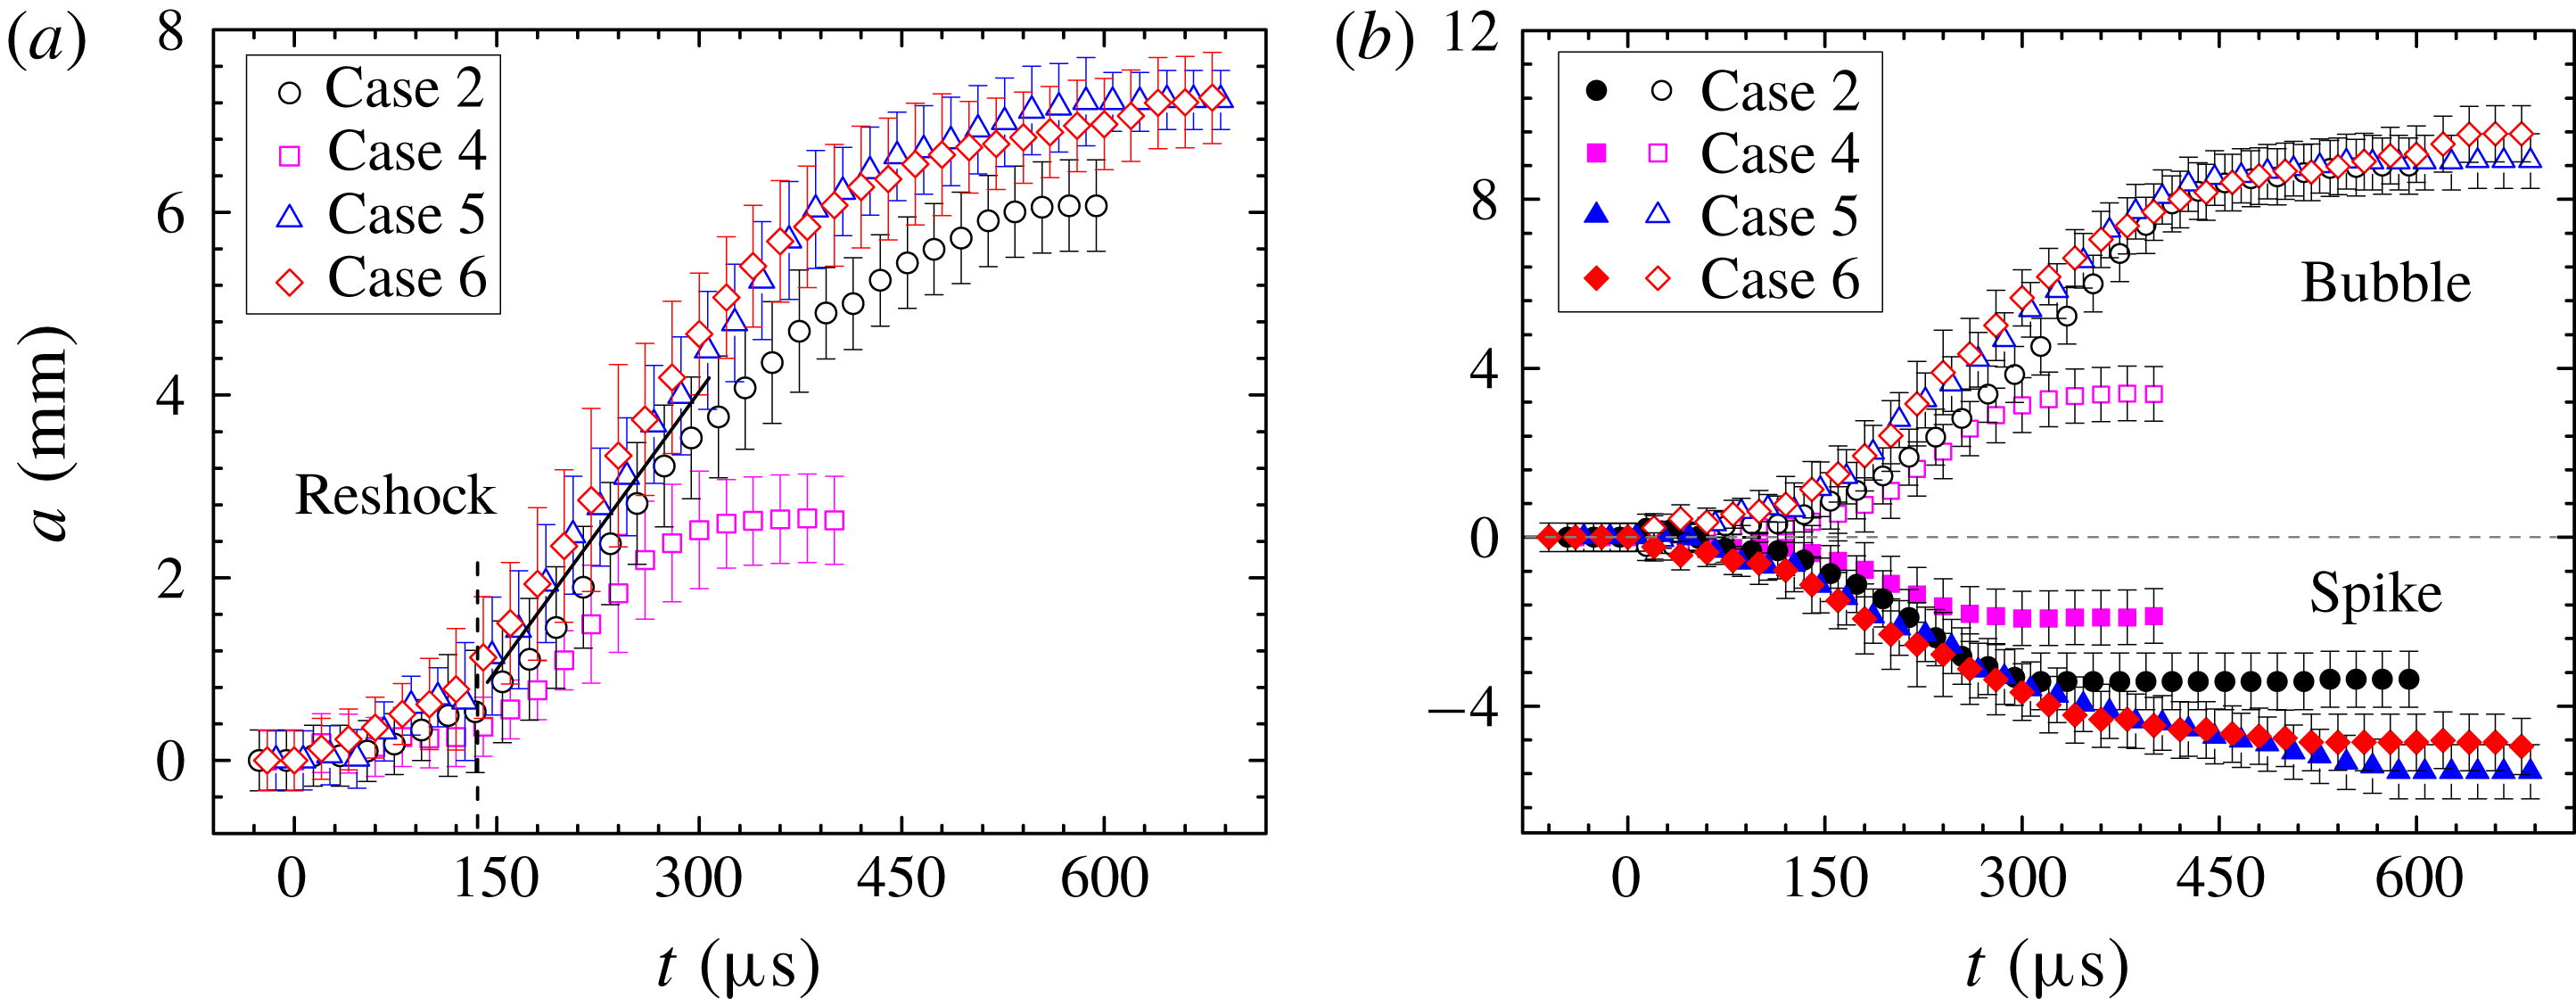
Temporal variations of the amplitudes of the inner interface (a) and the spike and bubble (b) for Cases 2, 4, 5 and 6.

Experimental and theoretical (Mikaelian Reference Mikaelian1989) growth rates of the inner perturbation after the reshock. The superscript ‘
 $+$
’ denotes the post-reshock state.

Temporal variations of the inner interface amplitude for Cases 2, 4, 5 and 6 sharing the same layer thickness (25 mm) are compared in figure 7(a). After the reshock, the perturbation amplitude increases linearly for all cases. As listed in table 5, the linear growth rate is almost independent of the pre-reshock amplitude and wavelength, and can be reasonably well predicted by the Mikaelian (Reference Mikaelian1989) model with
 $b=0.31$
obtained above. This result is very similar to the previous finding on reshock RMI in planar geometry where the post-reshock growth rate has been demonstrated to be insensitive to the pre-reshock interface shape (Leinov et al.
Reference Leinov, Malamud, Elbaz, Levin, Ben-Dor, Shvarts and Sadot2009; Ukai, Balakrishnan & Menon Reference Ukai, Balakrishnan and Menon2011). So far, the main regimes for such an independence from initial conditions have not yet been clarified due to its complexity, and only empirical models can be obtained. Nevertheless, the linear stage duration shows a weak relation with the pre-reshock amplitude, especially for those with a very small perturbation such as Case 4 where a relatively shorter period of linear growth is observed. A possible reason is that for interfaces with a very small perturbation, very little energy is deposited on the interface and it cannot support a long-term linear growth. After the linear stage, the perturbation growth rate continuously decreases and finally freezes with a constant amplitude. It should be pointed out that this type of instability freeze-out, which exists in all the present layers regardless of the outer perturbation amplitude and wavelength as well as the layer thickness, has never been observed in previous experiments.
Figure 7(b) shows temporal variations of the individual amplitudes of spikes and bubbles for the inner interface. After the re-acceleration of the RTS, the bubble and the spike increase linearly at a nearly identical growth rate. After the linear stage, the spike first begins to saturate and finally remains at a constant amplitude. Following the stagnation of spikes, the bubble decreases continuously in growth rate and later stops growing as well. Note that at late stages the bubble possesses a larger perturbation amplitude than that of the spike. The instability development presented here is completely different from that of the single-interface case, where spikes usually dominate the late-stage evolution and have a larger amplitude than bubbles. The physical regimes for the perturbation stagnation are described below. As the circumferentially distributed spikes carrying heavy
 $\text{SF}_{6}$
approach the geometry centre at a very high speed, the central air is continuously extruded and produce a local high pressure for the convergent geometry constraint. As a consequence, an increasing adverse pressure gradient is produced near the convergence centre. As this pressure gradient is strong enough to reduce the driving force of ingoing spikes, the spike tip stops moving. As indicated in the unperturbed case, the inner interface remains at a nearly fixed position after reshock, which indicates a constant volume of the interior air at late stages. After the ceasing of growth of the spikes, the outward-moving bubbles have to slow down quickly to maintain a constant volume of the interior gas. As both the spikes and the bubbles stop growing, a freeze-out of the overall perturbation amplitude is obtained. It can be generally concluded that the convergent geometry constraint together with the very weak compressibility at late stages is mainly responsible for this instability freeze-out. The present finding suggests that the simple treatment of setting the convergent geometry centre as a source or a sink in previous theoretical analyses is inappropriate.
4 Conclusions
The interaction between a cylindrical shock and a heavy gas layer with a perturbed outer surface has been examined in shock-tube experiments for the first time. Experiments are conducted in a semi-annular shock tube, and the soap-film technique is extended to generate gas layers with controllable inner and outer boundaries. Detailed processes of the shock propagation and the interface deformation are well captured by high-speed schlieren photography. An unperturbed layer is first examined, and the movements of the interfaces and waves are much more complicated than those of the single-interface case. For perturbed layers with different thicknesses, the evolutions of the outer and inner interfaces show a strong dependence on the layer thickness. The thicker the gas layer, the weaker the interface–coupling effect and, subsequently, the slower the evolution of the outer interface. For the inner surface, the distorted transmitted shock induces a negative growth rate, while the interface coupling causes a positive growth rate. The net negative growth of the inner perturbation before reshock indicates that the distorted shock effect overwhelms the interface coupling at early stages. As the layer thickness increases, the interface coupling attenuates greatly, while the distortion degree of the transmitted shock becomes stronger gradually because of the convergence effect. As a result, the growth rate of the inner interface increases. This provides a possible way to control the development of the inner interface by manipulating the layer thickness. After the reshock, the inner perturbation presents a quick linear growth at a growth rate independent of the layer thickness as well as of the outer perturbation amplitude and wavelength, and the growth rate can be reasonably well predicted by the model of Mikaelian (Reference Mikaelian1989) with a prefactor of 0.31. This finding is similar to the previous result on reshock RMI in planar geometry where the post-reshock growth rate has been demonstrated to be insensitive to the pre-reshock interface shape (Leinov et al. Reference Leinov, Malamud, Elbaz, Levin, Ben-Dor, Shvarts and Sadot2009; Ukai et al. Reference Ukai, Balakrishnan and Menon2011). Nevertheless, the linear growth duration shows a relation with the initial outer perturbation amplitude. As the linear stage is terminated, the growth rate of the inner perturbation decreases gradually, and finally the perturbation stagnates with a constant amplitude. The convergent geometry constraint as well as the very weak flow compressibility at late stages is mainly responsible for the instability freeze-out. The present findings provide deep insights into the dynamics of convergent RMI on dual interfaces and are helpful for ICF target design. Further experiments on the development of gas layers with perturbations on either the inner side or both sides will be reported in the near future.
Acknowledgements
This work was supported by the National Natural Science Foundation of China (nos 11802304, 11625211 and 11621202), and the Science Challenging Project (no. TZ2016001).