Introduction
An increasing number of neuroimaging studies of bipolar disorder show significant volumetric alteration in various areas of the brain, including the striatum, frontal lobe, orbitofrontal cortex, amygdala, anterior cingulate gyrus, dorsolateral prefrontal cortex, temporal lobe, and thalamus (Konarski et al., Reference Konarski, McIntyre, Kennedy, Rafi-Tari, Soczynska and Ketter2008). However, many of these studies involved younger bipolar populations, and the study findings are difficult to replicate because of a variety of factors including aging, medication, and the heterogeneity of bipolar disorders.
Cognitive dysfunction is common in elderly patients with bipolar disorder (Gildengers et al., Reference Gildengers and 2004). The onset of mania in late adulthood is likely to be associated with neurological or cerebrovascular morbidity (Subramaniam et al., Reference Subramaniam, Dennis and Byrne2007). These findings are supported by the occurrence of silent cerebral infarction in approximately half of cases of late-onset mania (Fujikawa et al., Reference Fujikawa, Yamawaki and Touhouda1995). Age at onset could be used to identify more homogeneous groups with bipolar disorder (Lin et al., Reference Lin2006) and could be an important variable used to determine the etiology and subtype of mania (Young and Klerman, Reference Young and Klerman1992; Cassidy and Carroll, Reference Cassidy and Carroll2002). Furthermore, the negative effects of aging and comorbid medical disorder of the brain may collectively explain the accelerated cognitive decline of patients with early-onset bipolar disorder (Tsai et al., Reference Tsai, Lee, Chen and Huang2007). However, evidence of the influence of aging on bipolar disorder is lacking. Elderly patients with early-onset and late-onset bipolar disorder may share clinical characteristics, with the exceptions of a smaller likelihood of positive family history and a greater likelihood of neurological damage in the late-onset group (Depp and Jeste, Reference Depp and Jeste2004).Yet the existing literature on alterations of the brain in elderly manic patients lacks comparisons between patients with early- and late-onset disease.
It is hypothesized that alterations of the brain, particularly the caudate nucleus, in elderly bipolar patients may vary by age at disease onset. This magnetic resonance imaging (MRI) study was conducted to examine differences in volume of cortical regions between elderly patients with early and late onset.
Methods
Design and subjects
This study was approved by the institutional review board of the Taipei Medical University Hospital (TMUH) and participating hospitals, and written informed consent was obtained from all participating patients. Patients with bipolar disorder from TMUH and Taipei City Psychiatric Center (TCPC) were recruited to participate in the study if they met the following criteria: age over 60 years, at least one psychiatric admission before the start of the study, and a final diagnosis of bipolar I disorder (DSM-IV). Both the participants and their reliable companions (mostly family members) were directly interviewed by two of the experienced psychiatrists involved in this study using the Chinese version of the Structured Clinical Interview for the DSM-III-R, patient edition, to confirm the diagnosis of bipolar I disorder as well as any prior history of psychiatric disorders. The exclusion criteria were the presence of comorbid dementia, active substance abuse, mental disorders associated with general medical conditions, and the inability to undergo MRI.
The onset of bipolar I disorder was defined as the first occurrence of affective symptoms causing severe impairment of the participant's psychosocial functioning or symptoms necessitating hospitalization. According to an early volumetric study, we divided the bipolar patients into early- and late-onset groups using the cutoff age at illness onset of 45 years (Beyer et al., Reference Beyer2004).
Clinical data collection
Clinical data were obtained by a review of medical records as well as direct interviews with patients and their reliable companions. Measurements of the patient's body weight, body height, and blood pressure were obtained and electrocardiography was performed at the time of the interview, and the patient's personal and family medical history was also recorded. A cerebrovascular disease risk/burden score (range: 0–7) was determined from a review by the authors of all consensus Axis III diagnoses, with each of the following diagnoses receiving a score of one point: hypertension, diabetes, peripheral vascular disease, coronary artery disease, history of transient ischemic attack or stroke, atrial fibrillation, and carotid bruit (Wylie et al., Reference Wylie1999).
Affective symptoms were assessed using the Young Mania Rating Scale (YMRS; Young et al., Reference Young, Biggs, Ziegler and Meyer1978) and the Hamilton Depression Rating Scale (HDRS; Hamilton, Reference Hamilton1960); psychosocial outcomes were determined using both the Strauss-Carpenter Scale (Strauss and Carpenter, Reference Strauss and Carpenter1972) and the Global Assessment of Functioning (GAF) Scale (DSM-IV).
Cognitive assessment
We rated cognitive function using the Chinese version of the Mini-mental State Examination (MMSE) (Liu et al., Reference Liu1995) of subjects in full remission whose YMRS scores were less than 5 and HDRS scores were less than 7 for a continuous period of eight weeks or longer.
MRI acquisition
Image collection
Brain images were obtained from each participant using a 1.5-T MR scanner (Signa contour, GE-Yokogawa Medical Systems, Tokyo) with three different pulse sequences: 124 contiguous, 1.2-mm-thick axial planes of three-dimensional T1-weighted images (spoiled gradient recalled acquisition in steady state: repetition time [TR], 40 ms; echo time [TE], 7 ms; flip angle [FA], 90°; voxel size, 0.86 mm × 0.86 mm × 1.2 mm); 58 contiguous, 3-mm-thick axial planes of proton density (PD) images (spin echo [SE]: TR, 2860 ms; TE, 15 ms; voxel size, 0.86 mm × 0.86 mm × 3 mm); and 58 contiguous, 3-mm-thick axial planes of T2-weighted images (SE: TR, 2860 ms; TE, 120 ms; voxel size, 0.86 mm × 0.86 mm × 3 mm). Before carrying out further computational procedures, all MR images were converted into the ANALYZE format using MRIcro software (http://www.sph.sc.edu/comd/rorden/mricro.html).
Image analysis
Image analysis was performed using the FMRIB software library (FSL 3.3). After acquisition, T2-weighted images and PD images were coregistered and resliced into T1 native spaces using the FMRIB's Linear Image Registration Tool (FLIRT) (Jenkinson et al., Reference Jenkinson, Bannister, Brady and Smith2002). Then, multi-channel image segmentation using T1-weighted images, PD images and T2-weighted images was performed using the fast tool to generate different tissue probability map images (e.g. gray matter image, white matter image, and cerebrospinal fluid [CSF] image) (FMRIB's Automated Segmentation Tool) (Zhang et al., Reference Zhang, Brady and Smith2001). The underlying method of image segmentation was based on a hidden Markov random field model and an associated expectation-maximization algorithm. The whole process was fully automated and could produce different segmented probabilistic tissue volume images. After the segmentation procedure, the brain tissue was classified into different tissue types (e.g. gray matter, white matter, CSF) while correcting for spatial intensity variations (also known as bias field). Finally, the individually segmented gray matter mask was automated and labeled into 116 different cortical regions, and the volume of each region was calculated using the Individual Brain Atlases using Statistic Parametric Mapping Software (IBASPM) toolbox (Alemán-Gómez et al., Reference Alemán-Gómez, Melie-Garcia and Valdés-Hernandez2006). The total intracranial volume (TIV) calculated by summation of the gray matter volume, white matter volume, and CSF volume was also recorded. To conduct further inter-individual comparison of different brain regions, each brain region was divided by the individual's TIV to get the volume in percentage relative to total intracranial volume.
Statistical analysis
In cases where the explanatory variables were found to be categorical, group comparisons were then made using the χ2 test along with the Yates’ correction or Fisher exact test. The independent t test was also used to calculate the inter-pair differences in the mean values of the variables. Given the exploratory nature of this study, the univariate analyses are presented without Bonferroni correction. Parametric and nonparametric tests were used as appropriate. The level of statistical significance was set at 0.05.
Results
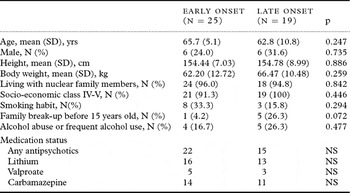
In total, we recruited 25 patients with early-onset mania and 19 patients with late-onset mania. No statistically significant difference in demographic characteristics was found between the two groups, except for the prevalence of growing up in a broken family with marginal significance (Table 1).
Demographic and basic data in early- and late-onset bipolar subjects

SD = standard deviation; NS = not significant.
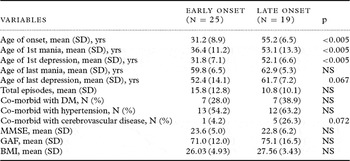
The two groups had comparable cognitive function (MMSE score), physical conditioning (BMI), psychosocial functioning (GAF), and clinical course (total number of episodes) (Table 2). In terms of medical comorbidity, cerebrovascular disease was more common in the late-onset group, with marginal statistical significance (p = 0.072). No difference was found in family history of psychiatric disorders (data not shown).
Clinical variables in early- and late-onset bipolar subjects

MMSE = Mini-mental State Examination, GAF = Global Assessment of Functioning, BMI = Body Mass Index; NS = not significant.
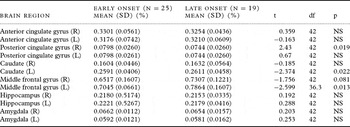
No statistically significant difference was found in mean TIV (1194.5 ± 158.0 mL vs. 1238.3 ± 82.7 mL, t = −1.008) or total volume of gray and white matter (913.7 ± 79.9 mL vs. 879.8 ± 115.8 mL, t = −0.984) between the late-onset and early-onset groups, respectively. The volume percentages of the left caudate nucleus and left middle frontal gyrus were significantly greater in the late-onset group, while that of the right posterior cingulate gyrus was significantly smaller in the late-onset group (Table 3).
Analysis of the volume percentage of different brain regions in early- and late-onset bipolar subjects

R = right side; L = left side; SD = standard deviation.
NS = not significant.
In addition, we found that the mean volume percentages of the left caudate nucleus and the left middle frontal gyrus were significantly greater in late-onset patients with cerebrovascular disease than in early-onset patients with cerebrovascular disease (0.1618 ± 0.0644 vs. 0.0937 ± 0.0170 and 0.7513 ± 0.1147 vs. 0.6656 ± 0.1515, respectively). No statistically significant differences were found in these values between early- and late-onset patients without cerebrovascular disease (data not shown).
Discussion
The major finding of this study was that patients with late-onset mania, compared with those with early-onset mania, exhibit significantly reduced volume of the right posterior cingulate gyrus as a percentage of TIV. Previous neuroimaging studies revealed no consensus regarding volumetric changes of the brain in patients with mood disorders. However, a functional abnormality of the cingulate gyrus may exist in depressive disorder (Hosokawa et al., Reference Hosokawa, Momose and Kasai2009), and functional MRI (fMRI) has demonstrated a potential relationship between the left posterior cingulate gyrus and manic severity (Roth et al., Reference Roth2006).
The present findings have several possible explanations. Patients with early-onset disease may have taken medication for more years than those with late-onset disease. These psychotropic agents, such as quetiapine and valproic acid, may exert a protective effect on the left anterior and left posterior cingulate gyrus (Sassi et al., Reference Sassi2004; Atmaca et al., Reference Atmaca2007). On the other hand, our data showed a higher prevalence of cerebrovascular disease in the late-onset group. As the posterior cingulate gyrus is an area of the brain with relatively great resistance to the effects of aging (Kalpouzos et al., Reference Kalpouzos2009) and cerebrovascular lesions are closely related to late-onset mania (Subramaniam et al., Reference Subramaniam, Dennis and Byrne2007), the reduced volume of the right posterior cingulate gyrus in late-onset patients may result from cerebrovascular diseases. In addition, accelerated degeneration due to vascular lesions may contribute to the loss of volume in patients with late-onset mania.
Unlike the posterior cingulate gyrus, the left caudate nucleus and left middle frontal gyrus had a greater volume in late-onset than in early-onset manic patients, and the results were the same when only patients with cerebrovascular disease were analyzed. DelBello et al. (Reference DelBello, Zimmerman, Mills, Getz and Strakowski2004) found that the striatum (caudate nucleus and putamen) was larger in bipolar patients compared with the general population. The middle frontal cortex has been found through fMRI study to be related to emotional processing in pediatric bipolar disorder (Pavuluri et al., Reference Pavuluri, Passarotti, Harral and Sweeney2009) and reward selection along with anticipation (Smoski et al., Reference Smoski2009). One MRI study showed decreased thickness of the left middle frontal cortex in bipolar patients compared with healthy subjects (Lyoo et al., Reference Lyoo2006). However, without comparisons with normal geriatric subjects, it is difficult to determine volume changes in the left caudate nucleus and middle frontal cortex of patients with late-onset bipolar disorder. These two areas may be relevant to the etiology or pathophysiology of early-onset (primary) bipolar disorder. Further study should be conducted to clarify issues related to neuronal loss due to the pathophysiology of long-term illness, etiology of bipolar disorder, and a brain deficit of developmental origin. To our knowledge, no previous study has reported volumetric differences in cortical regions between onset subgroups of elderly manic patients. Our finding of a larger left middle frontal gyrus in the late-onset group may merit further investigation.
Differences in cognitive functioning have been found between patients with early- and late-onset bipolar disorder (Schouws et al., Reference Schouws2009). However, we found no significant difference in MMSE scores between the early- and late-onset groups. This may be related to the fact that the MMSE is a screening tool that may not be able to detect subtle deficits in cognitive functioning.
Our study had several limitations. First, its cross-sectional design limits the ability to determine causal relationships. Second, the sample size was relatively small, and there was no control group. Third, age is usually treated as a continuous variable; the fact that we treated it as dichotomous with a cutoff point of 45 years makes it difficult to differentiate the effect of age on illness onset. Fourth, recall bias is more common in elderly patients, particularly regarding the first affective episode. Thus, the homogeneous nature of the subgroups is questionable. Fifth, because of the exploratory and descriptive nature of the study, the univariate analyses are presented without Bonferroni correction. Finally, the methodology used to establish the various brain regions deserves further consideration. Many factors involved in image preprocessing steps such as segmentation of gray and white matter, spatial transformation, and brain structure parcellation could affect the final results. We used a multi-spectral image segmentation method, as extraction of gray matter tissue from a single T1 image may be largely superseded by multi-spectral approaches (Vannier et al., Reference Vannier, Butterfield, Jordan, Murphy, Levitt and Gado1985; Harris et al., Reference Harris1994). Differing methods of brain structure parcellation may also contribute to the various results in the neuropsychiatric studies. Although the automated tracing method for various brain regions may show better consistency than manual tracings, this consistency should be further validated by large studies involving multiple cortical regions (Cherbuin et al., Reference Cherbuin, Anstey, Reglade-Meslin and Sachdev2009).
Conclusions
Late-onset mania may be accompanied by alterations in specific regions of the brain. The results of this study suggest that reduced volume of the right posterior cingulate gyrus is closely associated with late-onset mania and that reduced volume of the left caudate nucleus and left middle frontal gyrus is associated with early-onset mania. Volumetric change of brain regions may vary in elderly patients with early- and late-onset bipolar disorder.
Conflict of interest
None.
Description of authors’ roles
S.H. Huang managed the literature searches and analyses and wrote the first draft of the paper. S.Y. Tsai designed the study and wrote the protocol. J.L. Hsu designed the MRI data acquisition and processing. Y.L. Huang undertook the statistical analysis.
Acknowledgments
The authors are grateful for the acceptance of their poster at the 14th IPA Congress. They also wish to thank Nai-Ying Liu for assistance in data management. This study was supported by research grants from the National Science Council of Taiwan (95-2314-B-038-002).