Introduction
Soybean (Glycine max (L.) Merrill), a species belonging to the legume family, is one of the most important field crops in the world. Soybean; because of its oil and protein content, it is used for table consumption and as a biofuel raw material (Li and Burton, Reference Li and Burton2002; Masuda and Goldsmith, Reference Masuda and Goldsmith2009). Soybean production was 316 million tons worldwide in 2018 (FAO, 2020). In the same year, 36 thousand tons of production were realized in Turkey (TUIK, 2018). In Turkey; approximately 80% of the soybean production areas are located in the Mediterranean Region (in Adana and Mersin provinces).
Soybean cultivation is carried out in the Mediterranean region in summer; so, demands that high levels of evapotranspiration and irrigation (Gajić et al., Reference Gajić, Kresović, Tapanarova, Životić and Todorović2018). Maximizing the yield per unit of water volume under limited irrigation conditions is crucial for sustainable soybean production. Water scarcity and climate change affect soybean growth and productivity in many parts of the world (Hatfield and Prueger, Reference Hatfield, Prueger, Yadav, Redden, Hatfield, Lotze-Campen and Hall2011; Steduto et al., Reference Steduto, Hsiao, Fereres and Raes2012; Sentelhas et al., Reference Sentelhas, Battisti, Câmara, Farias, Hampf and Nendel2015). Water stress is principally harmful during flowering, grain setting and grain filling. In recent years, the negative effects of climate change (deterioration of precipitation regime and increase in temperatures) have been felt very strongly in the Mediterranean Region. Limited irrigation can result in substantial differentiation in crop productivity in various environments (Djaman et al., Reference Djaman, Irmak, Rathje, Martin and Eisenhauer2013). Deficit irrigation methods can be recommended as appropriate irrigation programs under limited water conditions (Payero et al., Reference Payero, Melvin and Irmak2005; Akcay and Dagdelen, Reference Akcay and Dagdelen2016). In the Western Mediterranean region of Turkey a study reported that up to 75% of full irrigation could be irrigated with a negligible decrease in yield under constrained water conditions (Aydinsakir, Reference Aydinsakir2018). Candogan et al. (Reference Candogan, Sincik, Buyukcangaz, Demirtas, Goksoy and Yazgan2013) reported that in Turkey, the reduction in grain yield was 18 and 45% under intermediate water stress and severe water stress, respectively, with grain yield of 2.16 and 3.23 t/ha under intermediate water stress and severe stress, respectively.
Soil cultivation costs constitute the largest part of plant production costs in Turkey (Barut et al., Reference Barut, Ertekin and Karaagac2011). Farmers are moving away from the conventional tillage method to alternative techniques due to its high energy inputs. In addition, it has been determined that regular tillage systems cause soil degradation, resulting in soil biological and physical properties and environmental degradation (Martínez-Valderrama et al., Reference Martínez-Valderrama, Ibáñez, Del Barrio, Sanjuán, Alcalá, Martínez-Vicente, Ruiz and Puigdefábregas2016; Alhameid et al., Reference Alhameid, Ibrahim, Kumar, Sexton and Schumacher2017; Kumar et al., Reference Kumar, Dwivedi, Kumar, Mishra, Singh, Prakash and Bhatt2017). However, the no-tillage system is an economical and environmentally friendly application that provides soil, water and climate protection in semi-arid regions (Friedrich et al., Reference Friedrich, Derpsch and Kassam2012; Wittwer et al., Reference Wittwer, Dorn, Jossi and van der Heijden2017). In recent years, studies on no-tillage agriculture have been widely carried out in Europe (Soane et al., Reference Soane, Ball, Arvidsson, Basch, Moreno and Roger-Estrade2012; Huynh et al., Reference Huynh, Hufnagel, Wurbs and Bellingrath-Kimura2019). In a study conducted in Germany, it was reported that environmentally friendly production was achieved on field crops by no-tillage and reduced tillage methods (Tebrügge and Düring, Reference Tebrügge and Düring1999). In Turkey; soils generally have a low organic matter content, high water scarcity-drought risk and high energy input costs. For this reason, research and dissemination of no-tillage systems will make a great contribution to the country's economy.
Differences between soil storage are mainly due to the presence of residues that limit the penetration of solar radiation and consequent soil heating, reducing evaporation from the surface. Conservation tillage with straw mulching was found to increase soil storage at sowing stages and persist over time (Wang et al., Reference Wang, Wang, Zhang, Wang, Zhang, Xu and Li2018).
Many studies have been conducted on the soybean water yield relationship (Liu et al., Reference Liu, Anderse and Jensen2003; Karam et al., Reference Karam, Masaad, Sfeir, Mounzer and Rouphael2005; Giménez et al., Reference Giménez, Paredes and Pereira2017). However, information is lacking on the impact of different levels of irrigation and soil cultivation interaction on soybean yield and water productivity (WP). The goal of this study was to determine the effects of different irrigation levels and tillage on yield, evapotranspiration and water use efficiency of soybean in the Mediterranean region. These data can be useful for the soybean industry and the regional soybean growers to maximize the grain yield and productivity of water use through the selection of appropriate irrigation levels and a tillage system strategy.
Materials and methods
Description of the experimental site
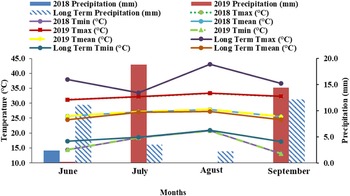
Soybean was grown at the Research Experimental Station of the National Institution of Alata Horticulture Research in Mersin, Turkey (latitude of 37°01′N and longitude of 35°01′E and 10 m above mean sea level) during 2018 and 2019. Meteorological variables of interest for both seasons are shown in Fig. 1 together with historic data (30 years series). The historical and seasonal values for rainfall, temperature, evaporation, and mean relative humidity data were obtained from the meteorological station, which is situated at the Institute. Total rainfall from soybean sowing to physiological maturity was lower in 2018 (3 mm) than in 2019 (33 mm).
Colour online. Average, minimum and maximum temperature, precipitation during long term and soybean growing seasons 2018 and 2019.

The soil of the study area is characterized by high clay content and low organic matter (1.5%). It is generally a fairly well-drained soil, with a slope of less than 0.1%. In the root zone depth (60 cm), a field capacity of 32.2%, permanent wilting point of 22.5%, mean bulk density varies from 1.30 to 1.40 g/cm3; the average electrical conductivity (ECe) values range between 0.4 and 0.5 dS/m respectively (Aboukhaled and Sarraf, 1970). The plant available water within the top 100 cm is 190 mm for an average bulk density of 1.41 g/cm3.Water is obtained from a borehole in the experimental area, with a pH value of 8.0–8.1 (Table 1).
Physical and chemical soil characteristics of the experimental soil

EC, Electrical Conductivity; O.M., Organic Matter.
Treatments and irrigation design
The experimental design was randomized, with two irrigation and tillage management systems and three replications. Each subplot measured 4.2 × 20 m (row space 0.7 m). The experiment had a randomized blocks split-plot design with 2 management system tillage and irrigation with three replications. Tillage had five levels: T1: Conventional tillage (plough-disc harrow-harrow-sowing), T2: Reduced tillage (combined chisel plough-rototiller-roller toothed harrow-sowing), T3: Reduced tillage (chiche- goble disc harrow-sowing), T4: Ridge tillage (plough-disc harrow-lister-back hopper-sowing), T5: No tillage. Irrigation had three levels: I100: Soil water deficit in a 60 cm soil depth was replenished to field capacity (in the 7-day irrigation interval), I75: received 75% of the water applied to I100, I50: received 50% of the water applied to I100.
The irrigation system control unit contained: a sand-gravel filter, disc filter, manometer, water meter, valves and fittings; fertilizer tank and fertilizer injection system. Internal drippers with surface drip laterals of 20 mm diameter, dripper spacing of 20 cm, and a flow rate of 1.8 l/h were located. The air relief valve is located at the manifold outlets. Laterals: One lateral was laid at 70 cm intervals with one lateral on each plant row. The amount of irrigation water applied to each plot was calculated with the help of a water meter and control was provided with the help of solenoid valves. The maturity group of the soybean variety was 3.6.
Crop management-agronomic practices
Seedlings of (Progen Asya) soybean, a widely used variety in the region, were gently transplanted into the plots on 15 June 2018 and 21 June 2019, in the experimental years. Plants were cut (2 October 2018 and 11 October 2019) in 5 cm rows with plants spaced 70 cm apart. All plots received 50 N; 50 P2O5; and 50 kg/ha K2O as compound fertilizer at planting. Plants were cut at the soil surface and oven-dried (forced air at 60°C) until constant weight had been achieved. Soybean grain yield was determined by harvesting plants from an area of 28.8 m2 per plot. Grain moisture was determined, and grain yield values were expressed at grain moisture of 13%.
Measurements and observations
Soil water content was measured with a neutron probe (Model 503 DR, Campbell Pacific Nuclear, Martinez, CA) at 0.3 m increments down to 0.9 m before irrigations throughout the growing season (irrigation treatments: I100, I75 and I50, tillage treatments: T1 and T5). Aluminium access tubes of 1.2 m long were installed in the centre of the plant bed in the experimental sub-plots. The surface soil layer (0–30 cm) was sampled gravimetrically. Neutron probe readings were locally calibrated with gravimetric measurements.
Evapotranspiration (ETa) was calculated from the water balance using Eqn (1).

where ETa; evapotranspiration (mm); R, the precipitation (mm); I, the amount of irrigation water applied (mm); Cp is contribution through the capillary rise from groundwater; ΔS, the change in the soil water content (mm); Dp is deep drainage and RO is run off (mm). Since the amount of irrigation water was controlled Dp and RO were assumed to be negligible. Water table depth was about 3 m below the soil surface Cp was also neglected.
WP and irrigation water productivity (IWP) were calculated using the following Eqns (2) and (3) (Howell, Reference Howell2001);


where WP is water productivity (kg/m3); ETa is actual evapotranspiration (m3); IWP is irrigation water productivity (kg/m3); Y is the yield of irrigated treatment (kg/ha); I is irrigation water applied (m3).
The water use-yield relationship was determined by Eqn (4) using the Stewart model in which dimensionless parameters in relative yield reduction and relative water evapotranspiration are used (Doorenbos and Kassam, Reference Doorenbos and Kassam1979);

where Ya is the actual yield (kg/ha), Ym is the maximum yield (kg/ha), Ya/Ym is the relative yield, 1 − (Ya/Ym) the decrease in relative yield, ky is yield response factor, ETa is the actual crop evapotranspiration (mm), ETm is the maximum crop evapotranspiration, 1 − (ETa/ETm) is the decrease in relative evapotranspiration.
The harvested crops were taken to the laboratory, where the following physical characteristics were analysed: yield components such as grain yield, plant height, biomass, harvest index, height of the first pod and 1000 grain weight. Grain yield was normalized for 13% grain water concentration. Harvest index was determined as grain yield divided by the total biomass after drying the samples at 65°C.
Statistical analysis
Data collected were subjected to analysis of variance (ANOVA) using the JMP Statistical software developed by SAS (SAS Institute, Inc., Cary, NC, USA). The least-square deviation (LSD) test was used to compare the treatment means (Steel and Torrie, Reference Steel and Torrie1980).
Results
Weather conditions
The daily weather data during the soybean growing season were obtained from a weather station located at the experimental site. The average temperature during both growing seasons was strongly similar to the long-term mean temperature. The first growing season was very dry (2.4 mm rainfall) compared to the second growing season (33.4 mm rainfall). The second growing season precipitation is similar to the long-term mean precipitation (29 mm). However, both growing seasons were considered as dry seasons (rainfall < 100 mm). Therefore precipitation did not affect the amount of irrigation water in both growing seasons.
Applied irrigation water (I) and evapotranspiration (ETa)
The total amount of irrigation water varied depending on the seasons, irrigation and tillage treatments. The seasonal amount of irrigation water and actual evapotranspiration values are given in Table 2. Irrigation treatments started on 20 July 2018 and 16 July 2019 and ended on 21 September 2018 and 17 September 2019. Total applied irrigation water varied between 323–606 mm and 302–564 mm in 2018 and 2019, respectively. In general, the lower relative humidity and higher air temperature results in greater demand for water for soybean (Gajić et al., Reference Gajić, Kresović, Tapanarova, Životić and Todorović2018). The seasonal crop evapotranspiration (ETa) increased with the increase in the irrigation volume; it varied between 395–636 mm and 456–657 mm in 2018 and 2019, respectively. The lowest seasonal crop evapotranspiration was seen in I50T5 and the highest in I100T1 in both growing seasons.
Soybean results of yield (Y), Irrigation amount (I), Evapotranspiration (ETa), water productivity (WP), and irrigation water productivity (IWP) for the 2018 and 2019 growing seasons

Water productivity and irrigation water productivity
The WP and IWP values of the experimental years are given in Table 2. WP values varied between 5.8 and 8.7 kg/m3 and 6.7 and 8.8 kg/m3 in 2018 and 2019, respectively. IWP values varied between 6.0 and 10.7 kg/m3 and 8.0 and 13.3 kg/m3 in 2018 and 2019, respectively. Different irrigation treatments and tillage treatments were found to be statistically significant (P < 0.01), while the irrigation-tillage interaction was insignificant on WP and IWP values (Table 3).
Results of statistical analysis to components of soybean and WP, IWP

IWP, Irrigation water productivity; WP, Water productivity; P, Probability; LSD, Least significant difference.
Soil water content
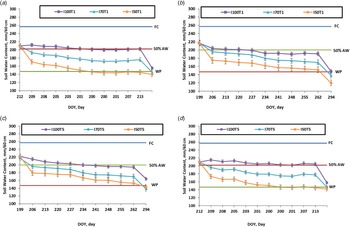
Soil water content (%) dynamics of no-tillage and conventional planting treatment in 0.60 m crop root zone during two growing seasons of soybean (Figs 2(a)–(d)). For the DI100 treatment; in general, soil water content was almost near the threshold level of 50%, but in some extreme climate periods, it has fallen below 50% of depletion of total available water. As the amount of irrigation water applied to the treatments decreased, the soil water content also decreased. Soil water contents fell below the wilting point in all subjects up to the time of harvest.
Colour online. Soil water content in the crop zone (0–0.60 m) for different irrigation treatments, conventional and no-tillage treatments during two growing seasons. (a): Treatment of T1 SWC in 2019, (b): treatment of T5 SWC in 2019, (c): treatment of T1 SWC in 2020, (d): treatment of T5 SWC in 2020. FC, Field capacity; AW, Available water; WP, Wilting Point; DOY, Day of year.

Soybean grain yield
Soybean grain yield values are given in Table 2. Grain yields obtained ranged between 3150 and 4360 kg/ha in 2018 and 3270 and 4990 kg/ha in 2019. Grain yield decreased as the amount of applied irrigation water decreased. The effects of different irrigation treatments, different tillage and irrigation, and tillage interaction on grain yield were found to be statistically significant (P < 0.01) (Table 4). For the irrigation treatments, the lowest yield was observed in I50 and the highest in I100 in both growing seasons. For the tillage treatments, the lowest grain yield was obtained for T3 and the highest for T1 tillage treatment in both growing seasons.
Yield quality parameters of soybean under different treatments in the experimental years

Yield components
It was found that different irrigation levels were statistically significant (P < 0.01) on plant height, first pod height and 1000 grain weight, while the interaction of different tillage and irrigation levels-tillage was found to be statistically insignificant.
Plant height
The effects of different irrigation levels and tillage systems methods on plant height were analysed. The height varied between 70.3 cm (I50T2) and 93.8 cm (I100T1) in 2018 and between 83.3 cm (I50T1) and 106 cm (I100T1) in 2019.
1000 Grain weight
The effects of different irrigation and tillage treatments on 1000 grain weight were analysed. The 1000 grain weight varied between 131.0 g (I50T2) and 153.3 (I100T1) in 2018 and between 131.9 g (I50T2) and 158.9 g (I100T1) in 2019.
Height of the first pod
The effects of different irrigation levels and tillage methods on the height of the first pod. The height ranged from 9.7 cm (I50T5) to 13.7 cm (I100T2) in 2018 and ranged from 10.3 cm (I50T3) to 23.3 cm (I100T1) in 2019.
Biomass
The effects of different irrigation levels and tillage methods on the biomass were analysed. The biomass varied between 6090 kg/ha g (I50T5) and 9050 g (I100T2) in 2018 and between 6050 (I50T5) and 9100 g (I100T1) in 2019.
Harvest index (HI)
The effects of different irrigation and tillage treatments on the harvest index were analysed. The Harvest Index varied between 0.42 (I50T1) and 0.5 cm (I50T4) in 2018 and between 0.48 (I50T3) and 0.67 (I50T5) in 2019.
The relationships between yield, ETa and irrigation
Plant production functions ky values were determined as 0.78** in 2018 and 0.82** in 2019. Polynomial significant relationships were obtained in both years. Evapotranspiration and Irrigation relationship with grain yield are given in Figs 3(a) and (b).
Relationship between soybean yield (Y) and evapotranspiration (ET) for all treatments in 2018 (a) and 2019 (b).

Yield response factor (ky)
When the yield response factors (ky); results were analysed there was a 0.67 decrease in 2018 and 1.01 decrease in 2019 (Fig. 4). The reason for the higher ky values determined in the second year compared to the first year is the lower crop evapotranspiration and yield. This means soybean yields decrease significantly under deficit irrigation treatment.
Colour online. The yield response factor (ky).

Discussion
In all irrigation treatments, lower ETa was calculated in no-tillage treatments compared to the traditional method. According to Wang et al. (Reference Wang, Wang, Zhang, Wang, Zhang, Xu and Li2018), conservation tillage decreased mean ET by 3.4−6.3%. Our study results were similar to previous reports on soybean crop. Doorenbos and Kassam (Reference Doorenbos and Kassam1979) obtained ETa values between 450 and 700 mm depending on the growing period, soil properties and climate. Aydinsakir (Reference Aydinsakir2018) reported that ETa values varied between 218 and 782 mm in soybean in the Western Mediterranean region. Candoğan and Yazgan (2013), in their study in Bursa, Turkey, obtained ETa values of 342–823 mm. Since these studies were main crop soybean cultivation, they obtained higher ETa values than our study results. Kirnak et al. (Reference Kirnak, Dogan and Turkoglu2010) obtained ETa values ranging from 240 to 568 mm in the second crop soybean in their study in the Southeastern Anatolia Region of Turkey. These values are similar to our study. In Serbia, Gajić et al. (Reference Gajić, Kresović, Tapanarova, Životić and Todorović2018) reported that they obtained ETa values between 227 and 505 mm and Suyker and Verma (2009) between 431 and 451 mm in Nebraska.
Soil water content in the no-tillage treatments was higher than the traditional method. Stubble found on the uncultivated soil surface; reduces the amount of evaporation because of the soil surface was covered with mulch. Hou et al. (Reference Hou, Han and Jia2009), indicated that a combination of tillage practices with management during fallow could effectively improve soil water before sowing. Our results indicated that the water content of the no-tillage treatments in the fallow was higher than the conventional tillage.
In general, it was observed that WP and IWP values increased with deficit irrigation, and this situation was similar to other research results in soybean. Irmak et al. (Reference Irmak, Specht, Odhiambo, Rees and Cassman2014), reported that IWUE varied between 5.15 and 10.35 kg/m3 in south-central Nebraska. Candogan et al. (Reference Candogan, Sincik, Buyukcangaz, Demirtas, Goksoy and Yazgan2013), in their study in western Turkey, reported that IWP values increased as irrigation water decreased; and Aydınsakir (Reference Aydinsakir2018) reported that the values of WP and IWP varied between 5.1 and 8.3 kg/m3 and between 6.0 and 32.9 kg/m3, respectively. Unlike our study results, Kirnak et al. (Reference Kirnak, Dogan and Turkoglu2010) reported that IWP values decreased from full irrigation to restricted irrigation in central Turkey.
When the effect of different tillage systems on soil water content was examined; in all irrigation treatments, it was observed that the T5 subject was higher than the T1 treatment throughout the season in two growing seasons because the soil surface was covered with mulch. In this situation, T5 causes a reduction in the amount of evaporation from the soil surface thanks to the stubble (mulch). Thus, the water in the soil is preserved for longer. In field crops, especially during critical growth periods, soil water content directly affects yield. Wang et al. (Reference Wang, Wang, Zhang, Wang, Zhang, Xu and Li2018), reported that soil water content in a no-tillage system is higher than other traditional cultivation techniques. This result was similar to our study results. It has been stated that the no-tillage system method is effective in the formation of aggregates that provide water stabilization in the soil, increasing the water retention capacity of the soil, and reducing the negative effects of soil degradation and wind erosion. (Qin et al., Reference Qin, Gao, Ma, Ma and Yin2008; Wang et al., Reference Wang, Wang, Zhang, Wang, Zhang, Xu and Li2018). Lampurlanes et al. (Reference Lampurlanes, Angas and Cantero-Martinez2001), reported that the mulch planting method provided higher water depth and root development than other planting methods in barley. However, some researchers reported that; tillage in clay soils increases the infiltration rate and increases the water retention capacity (Kuklík, Reference Kuklík2011; Ram et al., Reference Ram, Singh, Saini, Kler and Timsina2013). According to the results, since evaporation from the soil surface was less, the soil water content was higher in the no-tillage systems compared to the conventional treatments.
With regard to the effect of different irrigation and tillage treatments on soybean grain yield, in 2018 the lowest yield was seen in I50T3 (3150 kg/ha), while the highest was I100T2 (4360 kg/ha), while in 2019 the lowest was 3270 kg/ha in I50T3 and the highest was 4990 kg/ha I100T1. Although an average of 30% water savings was achieved in the I70 irrigation treatment compared to the I100, the grain yield decreased by approximately 10%. Many other researchers also stated that water stress negatively affects soybean grain yield (Eck et al., Reference Eck, Mathers and Musick1987; Karam et al., Reference Karam, Masaad, Sfeir, Mounzer and Rouphael2005; Gajić et al., Reference Gajić, Kresović, Tapanarova, Životić and Todorović2008; Sincik et al., Reference Sincik, Candogan, Demirtas, Buyucangaz, Yazgan and Goksoy2008). Kirnak et al. (Reference Kirnak, Dogan and Turkoglu2010), obtained grain soybean of 0.3 t/ha for rainfed treatment and 3.6 t/ha for full irrigation treatment in Turkey. Aydinsakir (Reference Aydinsakir2018), obtained grain yield of 1.8 t/ha for rainfed and 4.1 t/ha for full irrigation in Mediterranean climate conditions; Candogan et al. (Reference Candogan, Sincik, Buyukcangaz, Demirtas, Goksoy and Yazgan2013) obtained 2.0 t/ha grain yield under limited irrigation condition and 3.8 t/ha grain yield for full irrigation. Payero et al. (Reference Payero, Melvin and Irmak2005) reported that irrigation had a significant effect on yield in soybean grown in arid and semi-arid climate conditions. Depending on the soil type and climatic conditions, not only irrigation but also tillage have a significant effect on soybean yield (Scott et al., Reference Scott, Ferguson and Wood1987; Gajri et al., Reference Gajri, Arora and Prihar2002; Arora et al., Reference Arora, Singh, Sidhu and Thind2011). The results of the effect of tillage on soybean yield are similar to the results of many researchers. Busscher et al. (Reference Busscher, Frederick and Bauer2000), USA obtained the highest soybean yield in traditional tillage practices in their study. Wilhelm et al. (Reference Wilhelm, Doran and Power1986), in their study in the USA, obtained higher yields in the no-till plots in the area where soybean cultivation was carried out for a long time. As a result of our study, higher yields were obtained in traditional tillage compared to the no-tillage system.
The results of the study indicated that irrigation treatments significantly affected soybean yield and WP in the Mediterranean Region with a semi-arid climate. A linear relation between grain yield and crop evapotranspiration was observed for both years. In order to guarantee the highest yield and WP, the plant must not be stressed. During times of limited water availability and during dry periods; instead of full irrigation, I70 irrigation is recommended with 30% water savings in irrigation water and 10% reduction in yield.
Soil water stress reduces the rate of photosynthesis in crops. Therefore, plant height, first pod height, and 1000-grain weight decrease under limited irrigation conditions in soybeans (Desclaux et al., Reference Desclaux, Huynh and Roumet2000; Banziger et al., Reference Banziger, Edmeades, Beck and Bellon2002; Yordanov et al., Reference Yordanov, Velikova and Tsonev2003). The results of this study are similar to the results of other researchers (Kadhem et al., Reference Kadhem, Specht and Williams1985; Smiciklas et al., Reference Smiciklas, Mullen, Carlson and Knapp1992; Oya et al., Reference Oya, Nepomuceno, Neumaier, Farias, Tobita and Ito2004; Dos Santos et al., Reference Dos Santos, Cattelan, Prete, Neumaier, Oliveira, Farias, Carvalho and Nepomuceno2012; Maleki et al., Reference Maleki, Naderi, Naseri, Fathi, Bahamin and Maleki2013).
In both experimental years, it was shown that the irrigation levels effect on plant height were statistically significant, while the tillage and tillage × irrigation levels were insignificant. Some authors reported that deficit irrigation shortened plant height in soybean (Specht et al., 1989; Atti et al., 2004; Karam et al., Reference Karam, Masaad, Sfeir, Mounzer and Rouphael2005; Candogan and Yazgan, 2016).
Similarly to these results, linear relationships between crop evapotranspiration and soybean yield were reported by Payero et al. (Reference Payero, Melvin and Irmak2005) and Kirnak et al. (Reference Kirnak, Dogan and Turkoglu2010) for the semi-arid environment of west-central Nebraska and the semi-arid Harran plain in Turkey, respectively. In Nebraska, Schneekloth et al. (Reference Schneekloth, Klocke, Hergett, Martin and Clark1991) found a linear relationship between grain yield and ETa. However, the slope of the regression line varied considerably between studies. Moreover, other forms of relationship (e.g. exponential, quadratic) between crop yield and Eta are reported. This may be attributed to the impact of different factors such as differences in seasonal precipitation amount, its frequency and temporal distribution, crop varieties, soil properties, adopted irrigation method and scheduling, and other weather parameters and agronomic management practices.
It was shown that the effect of irrigation on 1000 grain weight was statistically significant in both experimental years, while the effect of soil tillage and tillage × irrigation levels interactions were insignificant. Water stressed crops produced relatively smaller grain by the findings of Wijewardana et al. (Reference Wijewardana, Reddy, Alsajri, Irby, Krutz and Golden2018) in rainfed soybean variety Asgrow at Mississippi. Water shortage in the grain-filling period led to a decline in 1000-grain weight due to the shortening of grain fill duration (Brevedan and Egli, Reference Brevedan and Egli2003).
It was shown that the effect of irrigation on the first pod height was statistically significant, while the tillage and tillage × irrigation levels were insignificant in both treatment years. Aydinsakir (Reference Aydinsakir2018) found that the first pod height ranged between 12.4 and 21.5 cm in Mediterranean conditions these results similar to our results.
The effects of irrigation levels, tillage, and tillage × irrigation levels on biomass in both treatment years were found to be statistically significant. Gajić et al. (Reference Gajić, Kresović, Tapanarova, Životić and Todorović2018), reported that the biomass yields were 2–73% greater in irrigated compared to non-irrigated plots, depending on the growing season and treatment, these results similar to our study. A similar effect of irrigation on aboveground biomass yield was observed by other researchers (Karam et al., Reference Karam, Masaad, Sfeir, Mounzer and Rouphael2005; Sincik et al., Reference Sincik, Candogan, Demirtas, Buyucangaz, Yazgan and Goksoy2008; Jha et al., Reference Jha, Kumar and Ines2018).
On the harvest index values, it was determined that the irrigation levels effect were statistically insignificant, and the tillage and tillage × irrigation levels were significant. Gajić et al. (Reference Gajić, Kresović, Tapanarova, Životić and Todorović2018), reported that the harvest index increased slightly when, the seasonal irrigation volume decreased. HI of irrigated treatments was 3–7% lower compared to I0 (no irrigation). Sincik et al. (Reference Sincik, Candogan, Demirtas, Buyucangaz, Yazgan and Goksoy2008) observed irregular variation of HI and reported that HI tended to be higher in non-irrigated treatment. Pedersen and Lauer (Reference Pedersen and Lauer2004) found that irrigation lowered HI by 2%, on average. In contrast to the present study, Garcia et al. (Reference Garcia, Persson, Guerra and Hoogenboom2010) found that different irrigation regimes did not affect the harvest index of soybean in a humid region of the south-eastern USA. In addition, Demirtas et al. (2010) stated that the HI of drip-irrigated soybean was not affected by drought stress in a sub humid environment of Turkey.
The yield response factor to water (ky) of soybean determined in this study for the whole growing period under deficit irrigation were similar to the results reported earlier by Doorenbos and Kassam (Reference Doorenbos and Kassam1979), Simsek et al. (Reference Simsek, Boydak, Gerçek and Kırnak2001) and Comlekcioglu and Simsek (Reference Comlekcioglu and Simsek2011).
Conclusion
In general, the highest soybean yield was obtained with full irrigation and conventional tillage methods. However, the highest soybean yield with water-limited treatments was obtained in no-tillage subjects. The reason for this is that with the no-tillage system; evaporation from the surface is reduced, subsequently the water content in the soil is preserved, thus reducing the crop water stress. To optimize irrigation and tillage management, an economic analysis is required. It depends on the objectives of irrigation and tillage, whether the objectives are related to maximization of net returns, WP, or yield, which might be a case study.
Author contributions
E. G.; determining the amount of irrigation water, calculating the plant water consumption, monitoring the soil water content and writing the article. O. K. carried out the tillage issues and made statistical analysis.
Financial support
This research received no specific grant from any funding agency, commercial or not-for-profit sectors.
Conflict of interest
The authors declare no conflicts of interest exist.
Ethical standards
Not applicable.