INTRODUCTION
The Caspian Sea is the largest inland water body on Earth. It is located at the far end of south-eastern Europe, bordering Asia (Kosarev & Yablonskaya, Reference Kosarev and Yablonskaya1994). The length of the Caspian Sea shoreline is 6000–7000 km (depending on the water level, etc) with a catchment area of 3.7 million km2 (Aladin & Plotnikov, Reference Aladin and Plotnikov2003). The south of the Caspian Sea receives 61 rivers. Sefidrood is the largest river discharging to the Caspian Sea with a 67,000 km2 catchment area and discharge of 4037 million m3. All the rivers that flow into the southern Caspian Sea encompass various river basins of 135,000 km2 in the area (Lahijani et al., Reference Lahijani, Tavakoli and Amini2008). The Anzali wetland is another freshwater source with a catchment area of 3740 km2 and takes in about 2.0 million m3 of fresh water per year. This wetland has a passage to the sea with a width of 426 m, and 11 tributary rivers flow into the Anzali wetland (Jafari, Reference Jafari2009). The lowlands of the basin are intensively cultivated for rice, while the natural cover of the upland is temperate-deciduous forest. Generally, the monthly mean rainfall account exceeds the evapotranspiration ratio during the year (Sharifi, Reference Sharifi2006).
Phytoplankton are an important water quality indicator because of their sensitivity to environmental changes, and short life span. Phytoplankton is also a useful indicator of high nutrient concentrations in water because of its propensity to multiply rapidly. Under the right conditions, phytoplankton can undergo rapid population growth, or blooms (Raymond, Reference Raymond2010). In an early study, the total number of phytoplankton between 1962 and 1974 was reported to be 449 in the Caspian Sea (Kosarev & Yablonskaya, Reference Kosarev and Yablonskaya1994). However, the species number was found to be decreased from the north (414 species) to the middle (225 species) and the southern area (71 species) mainly due to the disappearance of freshwater forms towards the south (Dumont, Reference Dumont1998). Recently, Kideys et al. (Reference Kideys, Soydemir, Eker, Vladymyrov, Soloviev and Melin2005) reported that there was a significant increase in phytoplankton density, particularly in harmful ones in the Caspian Sea. Moreover, Nasrollahzadeh et al. (Reference Nasrollahzadeh, Din, Foonga and Makhlough2008) and Roohi (Reference Roohi2009) observed 2–4 fold increases in phytoplankton abundance in 2003–2004 and 2005 compared to previous years. According to Khodaparast (Reference Khodaparast2006) the cyanophyte Nodularia sp. and dinoflagellate Heterocapsa sp. produced two anomalous algal blooms for the first time in the south-western Caspian Sea in September 2005 and October 2006, respectively. Increases in nutrient levels in the south-western Caspian Sea led to higher primary productivity reflected by high chlorophyll-a levels (2.71–35.3 µg l−1) in 2006, whereas chlorophyll-a levels in 1994 were between 0.56 and 1.34 µg l−1 (CEP, 2006; Khodaparast, Reference Khodaparast2006; Kideys et al., Reference Kideys, Roohi, Eker, Melin and Beare2008).
Fauna and flora in the Caspian Sea are largely endemic and they are therefore susceptible to external influences (Dumont, Reference Dumont1998). However, viewing the Caspian Sea as a focus of speciation (Dumont, Reference Dumont2000) and taking into account the many ecological changes in its geological evaluation (with changing water levels leading to temporary connections with the Black Sea and thus to different salinity regimes), it is predicted that fauna and flora in the Caspian Sea have a special adaptability to changing conditions. However, in spite of this adaptability, anthropogenic pollution such as heavy metals, hydrocarbons, pesticides, and changes in the quantity of nutrient inputs by rivers are significant threats to the biodiversity and biological resources such as the plankton structure in the Caspian Sea (Dumont, Reference Dumont2000; Daskalov & Mamedov, Reference Daskalov and Mamedov2007). For example, Stone (Reference Stone2002) revealed that there were various acute problems in the Caspian Sea such as reduction of the river discharges, unstable water levels during the year and, increases in various pollution sources. Moreover, Bilio & Niermann (Reference Bilio and Niermann2004) reported that there were drastic changes in the hydrological and meteorological regimes at the end of the 1980s that affected phytoplankton and mesozooplankton communities in the Caspian Sea (Oguz et al., Reference Oguz, Cokacar, Malanotte-Rizzoli and Ducklow2003). Therefore, changes in hydrological regimes and nutrient levels caused by the Anzali wetland and Sefidrood River can impact the phytoplankton structure in the south-western Caspian Sea.
In recent years, various phytoplankton studies have been conducted on annual and seasonal fluctuations of phytoplankton and nutrient concentrations in the southern Caspian Sea (Kideys et al., Reference Kideys, Soydemir, Eker, Vladymyrov, Soloviev and Melin2005; Nasrollahzadeh et al., Reference Nasrollahzadeh, Din, Foonga and Makhlough2008; Roohi et al., Reference Roohi, Kideys, Sajjadi, Hashemian, Pourgholam, Fazli, Khanari and Eker2010). The authors concluded that the ctenophore Mnemiopsis leidyi A. Agassiz, 1865 played an important role in phytoplankton population density in the Caspian Sea after 2000.
This study, in the period 2009 to 2010, intends to uncover the temporal distributions of phytoplankton population density and species composition in the south-western Caspian Sea. In addition, to discuss eutrophication processes in the system the findings of the present study were also compared with those of previous years.
MATERIALS AND METHODS
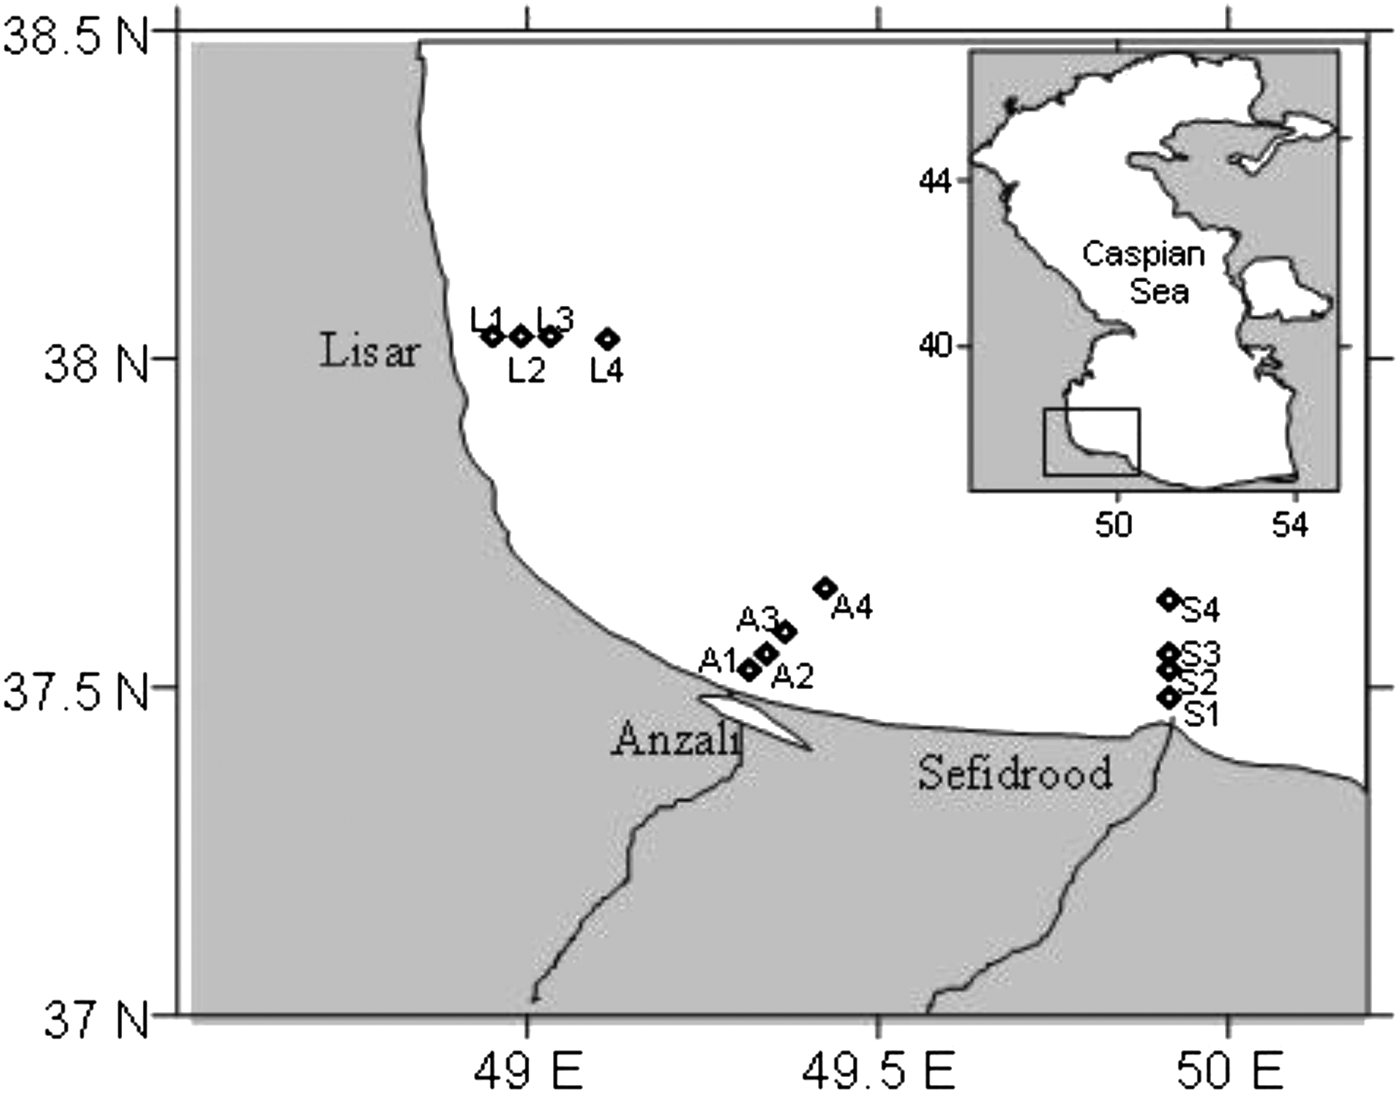
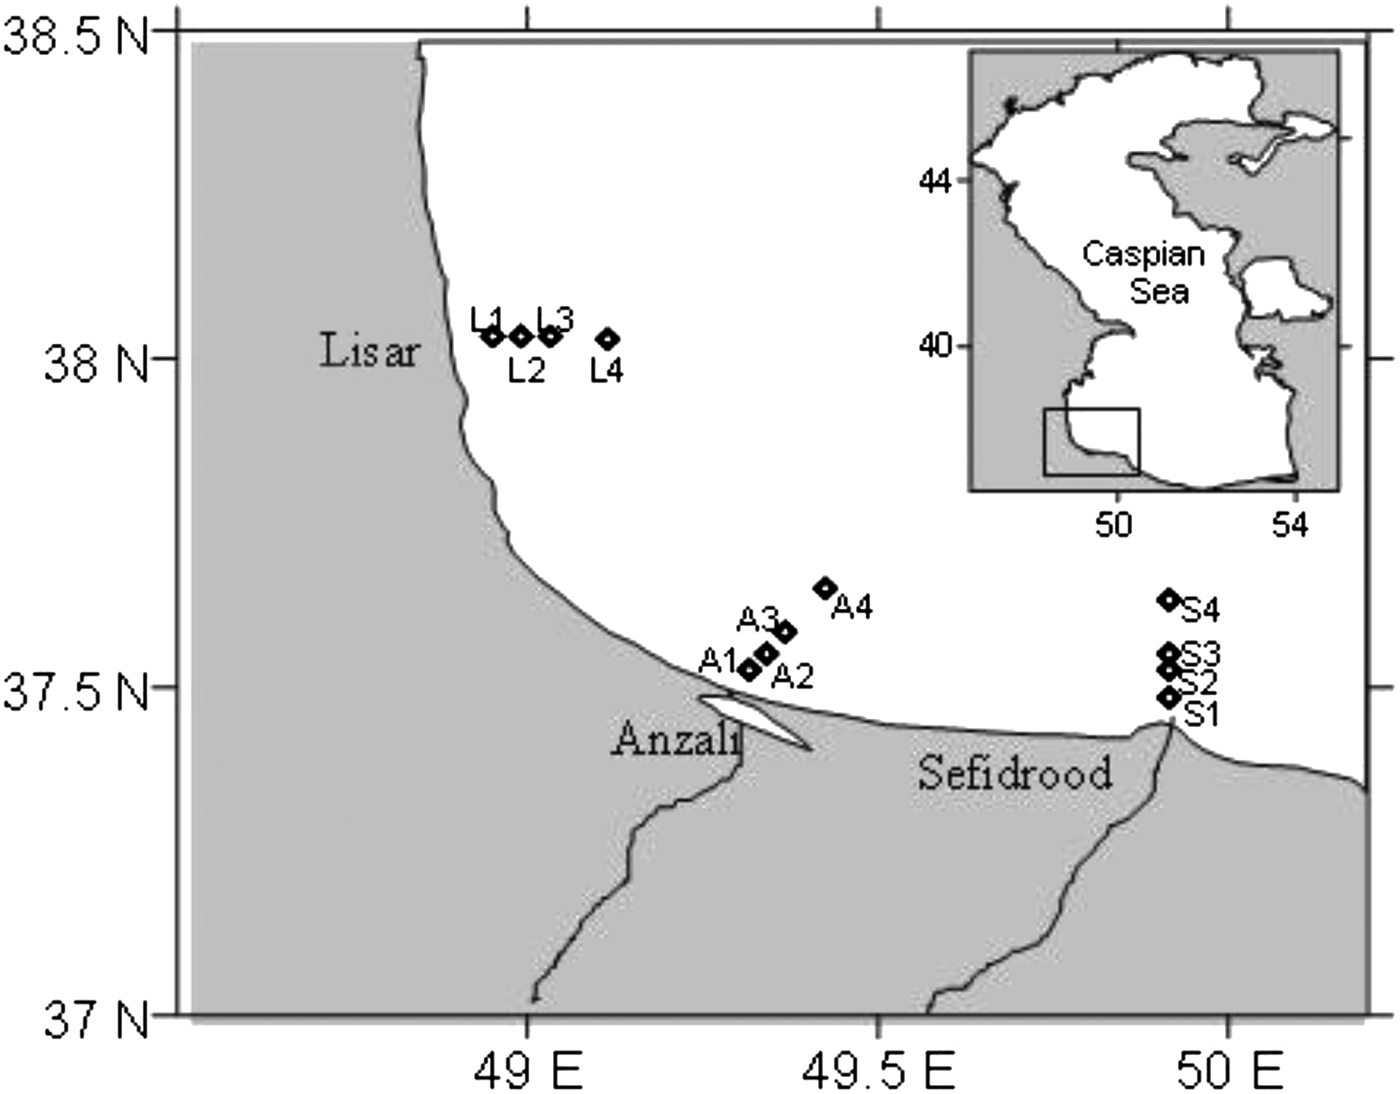
Phytoplankton density and species composition were evaluated by using surface samples collected from 12 stations along three transects (Lisar, Anzali and Sefidrood) on the western Iranian coast of the Caspian Sea during July 2009 to March 2010. The surface samples were collected in summer (16–18 July 2009), autumn (26–28 August 2009), winter (26–28 January 2010) and spring (13–15 March 2010). Since the depth along each transect increases, each sampling station is located in different depths from shore to offshore (stations at 5 m: L1, A1 and S1; stations at 10 m: L2, A2 and S2; stations at 20 m: L3, A3 and S3; stations at 50 m: L4, A4 and S4) (Figure 1). The sampling of the all station grids was performed in three days between 09.00 and 17.30 hours at daylight periods; each transect was sampled in one day using a speedboat.
Sampling transects and stations in the south-western Caspian Sea during July 2009 and March 2010.
Water samples were collected using a 1.70 l Nansen water sampler (Hydro-Bios, Germany, TPN; Transparent Plastic Nansen water sampler, No: 436201). Water temperature, salinity and dissolved oxygen levels were measured in situ by using a reverse thermometer (Hydro-Bios, TPN), a salinometer (Beckman; RS–7B, US Patent, No: 2542057) and oxygen meter, respectively. At each station, water transparency was measured with a Secchi disc. Water samples for analyses of dissolved inorganic nutrients were preserved at –21oC in a freezer until analysis. Dissolved inorganic phosphorus (DIP = P–PO−34), dissolved inorganic nitrogen (DIN = N–NO−2 + N–NO−3 + N–NH+4), dissolved organic nitrates (DON), dissolved organic phosphorus (DOP) and dissolved inorganic silicate (DIS = SiO4) were measured by a spectrophotometer using standard methods (Clesceri et al., Reference Clesceri, Greenberg and Eaton2005).
For chlorophyll-a analysis, 3 l of water samples were filtered with a pump through glass fibre filters (Whatman GF/C). Following filtration, 0.10 ml MgCO3 was added over the filter paper and the filters were wrapped in aluminium foil and kept frozen before further analysis. Chlorophyll-a concentration was analysed spectrophotometrically after extraction with 90.0% of acetone (Clesceri et al., Reference Clesceri, Greenberg and Eaton2005).
Phytoplankton samples were collected using a 1.70 l Nansen water sampler (Hydro- Bios, Germany, TPN Series). The samples were kept in 500 ml bottles and preserved in buffered formaldehyde 4.00%. The samples were gradually concentrated to 20.0 ml using Uterhmöhl Sedimentation Chambers for the sedimentation. The samples were then centrifuged (ALC-PK131R; Germany, No: 30206372) for 5 minutes at 3000 rpm and concentrated to a volume of 2–6 ml (average 4 ml). For the enumeration of the phytoplankton species, Neubauer and Sedgewick–Rafter counting slides were used in combination according to the dimensions of the organisms and counted under a phase-contrast microscope (cover slip 24 × 24 mm and with magnifications of 10×, 20× and 40×) (Vollenweider, Reference Vollenweider1974; Guillard, Reference Guillard and Sournia1978; Hasle, Reference Hasle and Sournia1978; Venrick, Reference Venrick and Sournia1978). The enumerations of phytoplankton were recurred three times. Phytoplankton taxonomic classification was performed based on Tregouboff & Rose (Reference Tregouboff and Rose1957), Tiffany & Britton (Reference Tiffany and Britton1971), Vinyard (Reference Vinyard1974), Prescott (Reference Prescott1976) and Sournia (Reference Sournia1986).
Statistical comparisons between months were made by using a statistical software (Statsoft) SPSS version 15 for Windows. One-way analysis of variance (ANOVA) comparisons for water parameters and a non-parametric test (Kruskal–Wallis) for phytoplankton number were used to identify the importance of variables between different seasons. Spearman rank correlation coefficients (R) were calculated to evaluate the relationships between biological and physicochemical parameters. Descriptive statistics (minimum, maximum, mean and standard deviation) were conducted using Biodiversity Professional Version 2 (McAleece et al., Reference McAleece, Lambshead, Paterson and Gage1999). Mean and standard deviation results in the text have been presented as ‘mean ±SD’. Moreover, in order to interpret characteristics of seasonal community structures, the Bray–Curtis similarity index analysis was used.
RESULTS
Hydro-physical characteristics
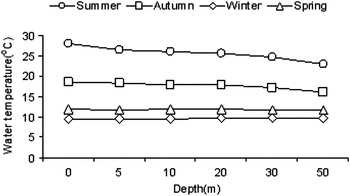
Temporal variations of temperature and salinity in the surface waters of the south-western Caspian Sea in the course of this study are shown in Table 1. Figure 2 presents the vertical profile of water temperature at Station A4 of the Anzali transect in the study area.
Vertical profiles of water temperature at Station A4 of the Anzali transect, south-western Caspian Sea during July 2009 and March 2010.

Hydro-physical variations in surface waters of the south-western Caspian Sea in the period July 2009 to March 2010.

DO, dissolved oxygen.
The surface temperature ranged between 9.05 and 28.5°C due to seasonal variations in weather temperature throughout the year. Although temperature values were vertically decreased in all seasons, the most pronounced decrease in temperature with depth was in summer (from 28.0°C at the surface to 23.0°C at the bottom) (Figure 2). However, vertical temperature variation in summer did not cause seasonal thermocline. In contrast to vertical variations, seasonal variations in temperature were significantly different (ANOVA, P < 0.01).
The minimum and maximum salinities recorded were 9.17 (in winter, Station A1) and 12.3 ppt, respectively (in summer, Station L4) (Table 1). Salinity in surface waters fluctuated due to variations in freshwater input from rivers and differences in surface salinities were significant between seasons (P < 0.05). Dissolved oxygen (DO) varied from 7.44 (in summer, Station A4) to 10.96 mg l−1 (in spring, Station L1) (Table 1). DO values were significantly different between the seasons (P < 0.05). The Secchi disc depth changed from 0.70 to 3.12 m (2.03 ± 1.31 m) during the study period (Table 1) and recorded values were significantly different between the seasons (P < 0.05).
Hydro-chemical characteristics
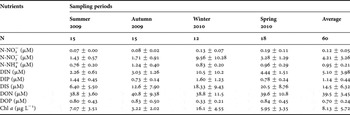
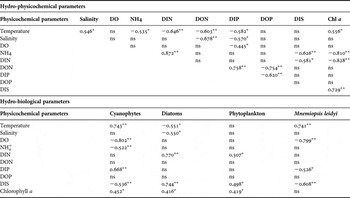
Hydro-chemical variations such as nutrient and chlorophyll-a in the surface waters of the south-western Caspian Sea during the study period are shown in Table 2. On the other hand, Spearman rank correlations between hydro-physicochemical and hydro-biological parameters in surface waters of the south-western Caspian Sea are presented in Table 3.
Hydro-chemical variations in surface waters of the south-western Caspian Sea in the period July 2009 to March 2010.

N, sampling number; DIN, dissolved inorganic nitrogen (N-NO−2+N-NO−3 + N-NH+4); DIP, dissolved inorganic phosphate (P-PO−34); DIS, dissolved inorganic silicate (Si-SiO4); DON, dissolved organic nitrogen; DOP, dissolved organic phosphate; Chl a, chlorophyll-a.
Spearman rank correlations between hydro-physicochemical and hydro-biological parameters in surface waters of the south-western Caspian Sea in the period July 2009 to March 2010 (*, significant relationships at level of P = 0.05; **, significant at level of P = 0.01; ns, non-significant relationships). Number of samples (N): 60.

DO, dissolved oxygen; NH4,, ammonium nitrogen; DIN, dissolved inorganic nitrogen; DON, dissolved organic nitrogen; DIP, dissolved inorganic phosphate; DOP, dissolved organic phosphate; Si, inorganic silicate; DIS, dissolved inorganic silicate; ns, correlation is not important.
The nutrients concentrations were strikingly high in the study area and showed great variations (Table 2). Although average dissolved inorganic nitrogen (DIN = N–NO−2 + N–NO−3 + N–NH+4) concentration was very high (10.5 µM) in winter (Stations A1 and S1), DIN concentration dropped drastically to 2.26 µM in summer (Station L4). DIN variations were strongly significant in different seasons (P < 0.01). Dissolved inorganic phosphorus (DIP = P–PO4) concentrations ranged between 0.73 (in autumn, Station L4) and 1.60 (in winter, Station A2) μM, with an average concentration of 1.14 ± 0.44 µM. DIP variations were seasonally significant (P < 0.01). Dissolved organic nitrogen (DON) and dissolved organic phosphorus (DOP) levels showed no important variations in the area except for DOP concentration in winter (0.33 ± 0.21) (Table 2). While DIN and DIP variations were strongly significant (P < 0.01), variations in DON and DOP were not important (P > 0.05). Dissolved inorganic silicate (DIS) concentrations changed from 6.40 in summer (Station L4) to 20.5 µM in spring (Stations A2 and S2) (14.5 ± 6.32 µM) and this seasonal variation was strongly significant (P < 0.01).
Chlorophyll-a concentrations varied between 3.22 (autumn, Station L3) and 16.1 µg l−1 (winter, Station A3) and this difference was important (P < 0.01). The average chlorophyll-a concentration was 8.13 ± 5.72 µg l−1 for the study period. In contrast to seasonally expected variations, there were seasonally some deviations in chlorophyll-a levels. For instance, the average chlorophyll-a concentration in winter (16.1 ± 4.55 µg l−1) was higher than in spring (5.95 ± 3.35 µg l−1). Hydro-chemical variations revealed that there were higher nutrient concentrations in the study area in winter (Table 2). This situation was supported by positive correlation between temperature and chlorophyll-a (r = 0.556) and negative correlation between chlorophyll-a with DIN (r = –0.828). However, correlation between chlorophyll-a and DIS was significantly positive (r = 0.729). This correlation also revealed that the system has been more affected by diatoms than the other taxonomic groups such as cyanophytes and dinoflagellates due to the utilization of dissolved inorganic silicate (DIS) by solely diatoms. According to the Spearman rank correlation analysis, there was a positive correlation between chlorophyll-a and total phytoplankton abundance (r = 0.419). Besides, although there were some important positive relationships between chlorophyll-a with cyanophytes (r = 0.452) and diatoms (r = 0.416), there was no relationship between chlorophyll-a and M. leidyi (Table 3).
Hydro-biological characteristics
QUALITATIVE PHYTOPLANKTON VARIATIONS
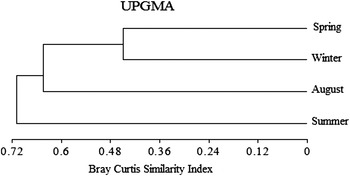
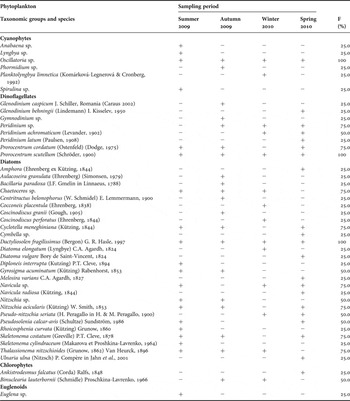
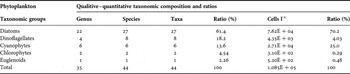
A phytoplankton list along with seasonal presence (+) or absence (–) indices in surface waters of the south-western Caspian Sea is shown in Table 4. Taxonomic composition of phytoplankton and contributions of different taxonomic groups to the total phytoplankton are presented in Table 5. Besides, in order to interpret characteristics of seasonal community structures, Bray–Curtis similarity index results are shown in Figure 3.
Bray–Curtis similarity index results of seasonal qualitative phytoplankton in the south-western Caspian Sea during July 2009 and March 2010.

Phytoplankton list in surface waters of the south-western Caspian Sea in the period July 2009 to March 2010 (1–20%: rare, 21–40%: common, 41–60%: abundant, 61–80%: very abundant, 81–100: continuous species, +: present, -: absent).

Taxonomic composition of phytoplankton and contributions of different taxonomic groups to the total phytoplankton in surface waters of the south-western Caspian Sea in the period July 2009 to March 2010.

According to the findings on the community structure and diversity, a total of 44 phytoplankton taxa were distinguished. Of these taxa, 27 taxa (61.4%) diatoms (22 genera and 27 species), 8 taxa (18.2%) dinoflagellates (4 genera and 8 species), 6 taxa (13.6%) cyanophytes (6 genera and 6 species), 2 taxa (4.54%) chlorophytes (2 genera and 2 species) and 1 taxa (2.26%) euglenoid (1 genus and 1 species) were distinguished in the south-western Caspian Sea (Tables 3 & 4). Seasonal qualitative phytoplankton community structures were quite different from each other in the Caspian Sea (Table 4; Figure 3).
According to the results of frequency of coefficients in the community structure of the phytoplankton species, 27 taxa (61.4% of total 44 taxa) were ‘common’ (frequency: 21–40%), 6 taxa (13.6% of total 44) were ‘abundant’ (frequency: 41–60%), 8 taxa (18.2%) were ‘very abundant’ (frequency: 61–80%) and 3 taxa (6.80%) were ‘continuous' (frequency: 81–100%) species during the year in the south-western Caspian Sea (Table 4).
QUANTITATIVE PHYTOPLANKTON VARIATIONS
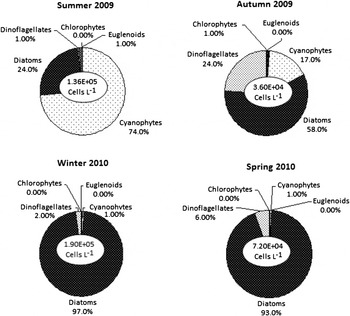
Seasonal contributions of different taxonomic groups to the total phytoplankton community during the sampling period are shown in Table 5 and Figure 4.
Seasonal contributions of different phytoplankton groups to the total phytoplankton abundance in the south-western Caspian Sea during July 2009 and March 2010.

In this study, while the minimum and maximum phytoplankton values were varied between 1.60E + 03 (Station L4) and 4.70E + 05 cell l−1 (Station A1), average number of phytoplankton was calculated as 1.085E + 05 ± 6.82E + 04 cells l−1 (Table 5). The phytoplankton number varied from 3.60E + 04 ± 3.10E + 04 cells l−1 in autumn (Station L4) to 1.90E + 05 ± 3.90E + 04 cells l−1 in winter (Stations A2 and S2) (Figure 4), but these seasonal phytoplankton variations were not significantly different (P > 0.05).
Among the phytoplankton groups, diatoms were the first critical group and formed more (70.2%) than two-thirds of the total abundance (1.08E + 05 cells l−1). Cyanophytes were the second most important group (25.0%) contributing to total phytoplankton (1.08E + 05 cells l−1). Dinoflagellates, chlorophytes and euglenoids were other contributors to total phytoplankton (4.03%, 0.29% and 0.48%, respectively) (Table 5).
The diatoms Dactyliosolen fragilissimus (Bergon) G.R. Hasle, and Skeletonema costatum (Greville) P.T. Cleve (27.6% and 28.2% of total diatom density, respectively) and the cyanophyte Oscillatoria sp. (98.7% of total cyanophyte density) were the dominant species in the south-western Caspian Sea. While diatoms were the dominant group in the winter (97.0%), spring (93.0%) and autumn (58.0%), cyanophytes were the dominant group in the summer (74.0%). However, even in the summer, the diatoms were the second important taxonomic group (24.0%). Besides, cyanophytes provided an important contribution in the autumn (17.0%). In the autumn, dinoflagellates had an important contribution to total phytoplankton (24.0%) (Figure 4). Seasonal variations of diatoms and cyanophytes which have a large contribution to total phytoplankton were more significant (Kruskal–Wallis; P < 0.05) than any other groups.
According to outcomes of Spearman rank correlation of bio-physicochemical parameters there were negative correlations between diatom density with temperature (r = –0.551) and salinity (r = –0.550) at levels of P = 0.05 (Table 3). This relationship between diatoms and temperature was supported by seasonal diatoms variations (Figure 4). We think that salinity likely indirectly affected the diatom abundance due to the increase in evaporation in parallel to increase in temperature. This indirect relationship between salinity and diatoms was supported by correlation between temperature and salinity (r = 0.546). Furthermore, diatoms showed strongly positive correlations with DIN (r = 0.770) and DIS levels (r = 0.744) at levels of P = 0.01. Otherwise, there were no significant relationships between diatoms and the other factors in the south-western Caspian Sea. On the other hand, there was a strongly positive relationship between cyanophytes with temperature (r = 0.743) and dissolved inorganic phosphorus (r = 0.668) at levels of P = 0.01. However, cyanophytes showed negative relationships with DO (r = –0.802) at level of 0.01, NH4+ (r = –0.522), and DIS (r = –0.536) at level of P = 0.05. Additionally, there were positive correlations between phytoplankton with DIN (r = 0.507) and DIS (r = 0.498) at level of P = 0.05 (Table 3). The relationship between cyanophytes and temperature was supported by seasonal cyanophyte variations (Figure 4). DO indirectly affected cyanophytes due to the decrease in DO concentration in parallel to increase in temperature and salinity. There were no correlations between dinoflagellates with environmental parameters during the study (data not shown). Regarding the correlations between chlorophyll-a and different taxonomic groups of phytoplankton, while chlorophyll-a revealed important positive correlations with diatoms (r = 0.416), cyanophytes (r = 0.452) and total phytoplankton (r = 0.419) (Table 3), it showed a lower positive correlation value with dinoflagellates (r = 0.104). These correlations revealed that chlorophyll-a was more controlled by diatoms and cyanophytes than dinoflagellates in the south-western Caspian Sea.
DISCUSSION
Hydro-physical characteristics
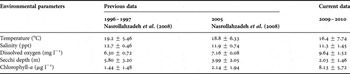
Comparative analysis of hydro-physicochemical parameters in different periods in surface waters of the south-western Caspian Sea showed that the annual average surface water temperature (16.4 ± 7.74°C) was exceptionally cold between July 2009 and March 2010 compared to values reported for 1996–1997 (19.2 ± 5.46) and for 2005 (18.8 ± 6.33) (Table 6). A strong thermocline was located between 20 and 50 m in the summer of 2003 with a 15oC temperature decrease together with an increase in depth. Zaker et al. (Reference Zaker, Ghaffari and Jamshidi2007) noted that the thickness of the thermocline in the beginning of autumn 2003 reduced to 15 m and the thermocline was located between 30 and 45 m depths in the southern Caspian Sea. Our study showed that there was no thermocline in the summer and autumn (Figure 2) as compared to previous years (Bagheri & Kideys, Reference Bagheri, Kideys and Yilmaz2003; Kideys & Moghim Reference Kideys and Moghim2003; Zaker et al., Reference Zaker, Ghaffari and Jamshidi2007; Roohi et al., Reference Roohi, Kideys, Sajjadi, Hashemian, Pourgholam, Fazli, Khanari and Eker2010) and the temperature of the water column was generally uniform and its variation in the water column in summer was about 5.00oC (Figure 2). In addition, surface temperatures in the summer were especially higher (28.5 ± 1.03°C) (Table 1; Figure 2) than those during the same periods of previous years (Bagheri & Kideys, Reference Bagheri, Kideys and Yilmaz2003; Yunev et al., Reference Yunev, Moncheva and Carstensen2005; Nasrollahzadeh et al., Reference Nasrollahzadeh, Din, Foonga and Makhlough2008). In the Guilan area (Anzali and Sefidrood regions), the fluctuations of water temperature and lack of thermocline could be related to high precipitation and increased freshwater inputs by rivers.
Comparative analysis of hydro-physicochemical parameters in different periods in surface waters of the south-western Caspian Sea.

The surface salinity in the south-western Caspian Sea varied between 9.17 and 12.3 ppt during the study (Table 1). There was a decreasing trend in the average salinity values of the surface water from summer to winter (Table 1). The average surface salinity value in this study was lower (11.3 ± 1.45 ppt) than those values reported for 1996–1997 (12.7 ± 0.46 ppt) and 2005 (11.9 ± 0.74 ppt) (Nasrollahzadeh et al., Reference Nasrollahzadeh, Din, Foonga and Makhlough2008), but were similar to those values reported by Kosarev & Yablonskaya (Reference Kosarev and Yablonskaya1994), Dumont (Reference Dumont1998), Kideys et al. (Reference Kideys, Soydemir, Eker, Vladymyrov, Soloviev and Melin2005) and Bagheri & Kideys (Reference Bagheri, Kideys and Yilmaz2003). Fluctuations in salinity were due to fresh water inputs from rivers.
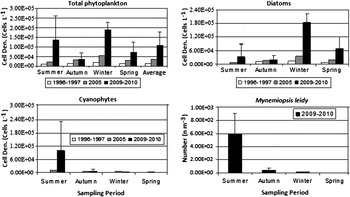
In this study, the average Secchi disc depth was recorded as 2.03 ± 1.46 m (Tables 1 & 6). Our findings revealed that there was a decrease in Secchi disc depth as compared to the average Secchi depths in 1996–1997 (5.80 ± 3.20 m) and 2005 (3.99 ± 2.05 m) (Table 6). Increase in anthropogenic inputs from the Lisar and Sefidrood Rivers, and the Anzali wetland caused an accumulation of suspended inorganic and organic materials in the south-western Caspian Sea. The reducing trend in Secchi disc depth compared to previous years (Table 6) could be related to the increase in phytoplankton density in the study period (average: 1.085E + 05 cells l−1) as compared to 1996–1997 (annual average: 1.40E + 04 cells l−1) and 2005 (annual average: 3.50E + 04 cells l−1) (Figure 5A).
Annual and seasonal fluctuations of total phytoplankton, diatoms, cyanophytes and Mnemiopsis leidyi in the southern Caspian Sea. The data in 1996–1997 and in 2005 have been provided by Nasrollahzadeh et al. (Reference Nasrollahzadeh, Din, Foonga and Makhlough2008). Data on M. leidyi in Figure 5D have been provided by Bagheri (in press).

The surface dissolved oxygen (DO) concentrations varied between 7.44 mg l−1 and 10.96 mg l−1 during the study. DO findings in the study were similar to those in 2004 (7.10–10.9 mg l−1) (Zaker et al., Reference Zaker, Ghaffari and Jamshidi2007). However, the average DO values were higher (9.64 ± 1.52 mg l−1) than the average values in 1996–1997 (6.30 ± 0.72 mg l−1) and 2005 (7.16 ± 0.08 mg l−1) (Table 6). Except for the summer period, higher DO values (>8.50 mg l−1) in the upper layers could be connected to high phytoplankton activity during the year. On the other hand, it is known that the variations of DO concentration across the depth were correlated with the vertical temperature structure and the characteristics of seasonal thermocline (Zaker et al., Reference Zaker, Ghaffari and Jamshidi2007). In our study, the low DO in summer could be related to lack of the thermocline in this period together with high water temperature values (Figure 2).
Hydro-chemical characteristics
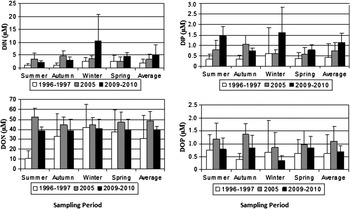
The nutrient findings indicated higher levels of nutrients, especially in DIN and DIP concentrations during the last two decades (Figure 6). Figure 6 shows that average increases in DIN and DIP concentrations in the last two decades were more than twofold due to eutrophication. However, there were decreasing trends in DON and DOP concentrations in the last two decades (Figure 6C, D). Average DIN (2.26–10.5 µM), DIP (0.73–1.60 µM) and DIS concentrations (6.40–20.5 µM) revealed very important temporal variations (Table 2) due to the fluctuations of river inflows rich in nutrients. In addition to the effects of anthropogenic nutrients from rivers, according to the various researchers, especially nitrate pollution from the air was significant in some local lakes, estuaries and offshore marine systems and on their living stocks (Kim et al., Reference Kim, Lee, Najjar, Jeong and Jeong2011; Palani et al., Reference Palani, Tkalich, Balasubramanian and Palanichamy2011). Furthermore, Paerl (Reference Paerl1997) showed the importance of groundwaters as an additional nitrogen source along with atmospheric deposition and other nutrient sources on coastal eutrophication and harmful algal blooms.
Annual and seasonal fluctuations of dissolved inorganic nitrogen (DIN), dissolved inorganic phosphorus (DIP), dissolved organic nitrogen (DON) and dissolved organic phosphorus (DOP) concentrations in the southern Caspian Sea. The data in 1996–1997 and in 2005 have been provided by Nasrollahzadeh et al. (Reference Nasrollahzadeh, Din, Foonga and Makhlough2008).

Our findings (Tables 1 & 6) revealed that there was a significant increase in chlorophyll-a (8.13 ± 5.72 µg l−1) compared to the values reported in 1996–1997 (1.44 ± 1.48 µg l−1) (Nasrollahzadeh et al., Reference Nasrollahzadeh, Din, Foonga and Makhlough2008), in 2001 (2.62 ± 1.48 µg l−1) (Kideys et al., Reference Kideys, Soydemir, Eker, Vladymyrov, Soloviev and Melin2005) and in 2005 (2.14 ± 1.94 µg l−1) (Nasrollahzadeh et al., Reference Nasrollahzadeh, Din, Foonga and Makhlough2008). Khodaparast (Reference Khodaparast2006) reported that in the south-western Caspian Sea, chlorophyll-a levels in 1994 and 2006 varied from 0.56 to 1.34 µg l−1 and 2.71 to 35.3 µg l−1, respectively. Recently, Kideys et al. (Reference Kideys, Roohi, Eker, Melin and Beare2008) reported that increases in chlorophyll-a levels in the last decade were also confirmed by satellite images. It seems that the striking rise in chlorophyll-a in 2009–2010 compared to previous years (Table 6) could be related to increasing nutrient level (DIN & DIP) (Figure 6A, B) due to the freshwater discharges from the Sefidrood River and Anzali wetland in the south-western Caspian Sea.
Hydro-biological characteristics
QUALITATIVE PHYTOPLANKTON VARIATIONS
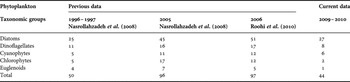
Compared to earlier surveys carried out in the southern Caspian Sea, there were fairly major changes in the phytoplankton community. Due to eutrophication, the number of phytoplankton species was drastically decreased (Nasrollahzadeh et al., Reference Nasrollahzadeh, Din, Foonga and Makhlough2008; Roohi et al., Reference Roohi, Kideys, Sajjadi, Hashemian, Pourgholam, Fazli, Khanari and Eker2010)—these authors listed 45 and 51 diatom taxa for 2005 and 2006, respectively in the southern Caspian Sea (Table 7). We found only 27 diatom taxa in 2009–2010. With regard to species number, not only was there a decrease in diatoms, but there were also strong decreases in dinoflagellates, cyanophytes, chlorophytes and euglenoids compared to those reported by Nasrollahzadeh et al. (Reference Nasrollahzadeh, Din, Foonga and Makhlough2008) and Roohi et al. (Reference Roohi, Kideys, Sajjadi, Hashemian, Pourgholam, Fazli, Khanari and Eker2010) (Table 7). However, except for diatoms and cyanophytes, although there was a decrease in species number compared to 1996–1997, this decrease was lower compared to 2005 and 2006 (Table 7). In total, 44 phytoplankton taxa were identified during the study and the total taxa were lower than the total phytoplankton taxa reported in 1983 (71 taxa), in 1996–1997 (50 taxa), in 2005 (96 taxa) and in 2006 (97 taxa) (Kosarev & Yablonskaya Reference Kosarev and Yablonskaya1994; Nasrollahzadeh et al., Reference Nasrollahzadeh, Din, Foonga and Makhlough2008; Roohi, Reference Roohi2009).
Comparative analysis of hydro-biological parameters (phytoplankton species numbers) in different periods in surface waters of the south-western Caspian Sea.

QUANTITATIVE PHYTOPLANKTON VARIATIONS
The seasonal quantitative variations of phytoplankton groups presented by Nasrollahzadeh et al. (Reference Nasrollahzadeh, Din, Foonga and Makhlough2008) for previous years (1996–1997 and 2005) and findings in this study indicated that there were remarkable changes of the phytoplankton stock in the southern Caspian Sea. Nasrollahzadeh et al. (Reference Nasrollahzadeh, Din, Foonga and Makhlough2008) reported prevalence of diatoms in all seasons in the period 1996–1997. They revealed that the contribution of diatoms to the total phytoplankton varied between 79.0 and 92.5% for that period. In spring 2005, the majority of identified species were diatoms (79.0%), while cyanophytes predominated in summer (62.0%), and the contributions of dinoflagellates in autumn and winter were 52.0% and 43.0%, respectively. In the present study, while the dominant phytoplankton group in summer was cyanophytes (74.0%), the dominant groups in other periods consisted of diatoms only (58.0–97.0%). Dinoflagellates were the second dominant group (24.0%) after the diatoms (58.0%) in autumn (Figure 3).
The striking changes in the phytoplankton community in the south-western Caspian Sea during the study compared to previous years could be related to several factors such as drastic anthropogenic impacts causing a heavy eutrophication, changes in the atmospheric and hydrological regimes of the basin since the early 1980s (Bilio & Niermann, Reference Bilio and Niermann2004) and thereby the south-western area of the Caspian Sea has become increasingly eutrophic (Salmanov, Reference Salmanov1999; CEP, 2006; Sharifi, Reference Sharifi2006; Stolberg et al., Reference Stolberg, Borysova, Mitrofanov, Barannik and Eghtesadi2006). In the eutrophic systems, the eutrophication process is followed by qualitative and quantitative exchanges between major taxonomic groups due to heavy nutrient pollution (Boalch, Reference Boalch1987; Turkoglu & Koray, Reference Turkoglu and Koray2000, Reference Turkoglu and Koray2002, Reference Turkoglu and Koray2004; Turkoglu, Reference Turkoglu2005, Reference Turkoglu2010; Nasrollahzadeh et al., Reference Nasrollahzadeh, Din, Foonga and Makhlough2008). It seems that this trend continued in the study period. The average nutrient concentrations in the system for the study period were higher than twofold of the average concentrations in 1996–1997 and 2005 (Nasrollahzadeh et al., Reference Nasrollahzadeh, Din, Foonga and Makhlough2008; Figure 6A, B). The high nutrient values in this period could be related to the high precipitation in autumn and winter due to the freshwater discharges such as the Sefidrood River and Anzali wetland in the south-western Caspian Sea. Similar findings were also reported by various researchers (McCarthy et al., Reference McCarthy, Yilmaz, Coban-Yildiz and Nevins2007; Bagheri et al., Reference Bagheri, Mansor, Wan Maznah, Negarestan and Chung2010). Thus, the rise in nutrient concentrations might have contributed to increases in phytoplankton number and changes in phytoplankton composition in this study as compared to outcomes in previous years (Figure 5A, B, C), so that, although the phytoplankton taxa number was lower than found in previous years, the average phytoplankton density was drastically higher in 2009–2010 (1.085E + 05 cells l−1) (Figure 5A) than in 1996–1997 (1.40E + 04 cells l−1) and 2005 (3.50E + 04 cells l−1) (Nasrollahzadeh et al., Reference Nasrollahzadeh, Din, Foonga and Makhlough2008; Figure 5A).
Another general change in the phytoplankton community of marine environments rich in nutrient has been the increase in the abundance of smaller species with generally a short life cycle, such as coccolithophorid Emiliania huxleyi (Lohmann) Hay and Mohler, 1967, dinoflagellate Prorocentrum spp., and diatoms D. fragilissimus and Leptocylindrus spp. in the eutrophicated systems such as the Black Sea (Turkoglu & Koray, Reference Turkoglu and Koray2004; Turkoglu, Reference Turkoglu2005) and Turkish Straits System (Turkoglu, Reference Turkoglu2008, Reference Turkoglu2010; Turkoglu & Erdogan, Reference Turkoglu and Erdogan2010; Turkoglu & Oner, Reference Turkoglu and Oner2010). Dactyliosolen fragilissimus, S. costatum and Thalassionema nitzschioides (Grunow) Mereschkowsky, 1902 among the diatoms and Oscillatoria sp. among the cyanophyte which have the highest abundance in the study area were comparatively smaller species in cell size.
In this study, Oscillatoria sp. was dominant during summer (Figure 3) and strongly positively correlated with temperature and DIP (Table 5). According to Loizzo et al. (Reference Loizzo, Sechi, Volterra and Contu1988), cyanophyte Oscillatoria sp. generally occur in summer when water temperatures rise. They reported that favourite environmental factors for cyanophyte blooms are high levels of nutrients (especially phosphate and nitrate) and high water temperature (20–30°C) for non-N2-fixing genera such as Oscillatoria sp. In this study, high densities of Oscillatoria sp. could be related to reasons such as lack of the seasonal thermocline blocking nutrient penetration from the lower layer to surface layers. In addition, increases in the water temperature and low silicate levels may favour cyanophytes to compete with diatoms in summer (Figure 2; Table 2). The low silicate concentration levels in summer were confirmed by negative correlation between cyanophytes and DIS (Table 5). Various researchers (Boalch, Reference Boalch1987; Justic et al., Reference Justic, Rabalais, Turner and Dortch1995; Eker et al., Reference Eker, Georgieva, Senichkina and Kideys1999; Kangro et al., Reference Kangro, Laugaste, Noges and Ott2005; Moncheva & Carstensen, Reference Moncheva and Carstensen2005) reported that extensive blooms of non-silicate phytoplankton were observed during periods of depletion in DIS levels in marine systems. In 2005, the abundance of non-silicate phytoplankton (cyanophytes) increased as DIS decreased in the Caspian Sea during the warm seasons (Nasrollahzadeh et al., Reference Nasrollahzadeh, Din, Foonga and Makhlough2008). It is known that diatoms require DIS for their cell wall structures in addition to other nutrients such as DIN and DIP. About 90% of the DIS in the global marine system is estimated to come from rivers (Sommer, Reference Sommer1994; Eker & Kideys, Reference Eker and Kideys2003; Humborg et al., Reference Humborg, Smedberg and Blomqvist2004; Moncheva & Carstensen, Reference Moncheva and Carstensen2005; Nasrollahzadeh et al., Reference Nasrollahzadeh, Din, Foonga and Makhlough2008). It is also known that diatoms are favoured when nitrogen is available at higher concentrations (Piehler et al., Reference Piehler, Twomey, Hall and Paerl2004) and large phytoplankton cells such as Rhizosolenia setigera Brightwell, 1858 and D. fragilissimus are better competitors for dissolved inorganic nitrogen because of their larger specific storage volume (Dauchez et al., Reference Dauchez, Legendre, Fortier and Levasseur1996; Kormas et al., Reference Kormas, Garametsi and Nicolaidou2002; Yurkovskis, Reference Yurkovskis2004).
In the present study, high diatom densities except during the summer period (Figure 3) were probably related to a rise in freshwater inflow by rivers which contain high nutrients concentrations and especially high silicate levels in the south-western Caspian Sea. The findings showed that DIS levels were high in all seasons except for the summer period (Table 2). We found that diatom abundance had a strong positive correlation with DIS and DIN (Table 5). On the other hand, Kideys et al. (Reference Kideys, Soydemir, Eker, Vladymyrov, Soloviev and Melin2005) showed that temperature was an important factor in the fluctuations of phytoplankton composition in the Caspian Sea and revealed that diatoms were dominant in the colder waters of the southern Caspian Sea similar to findings in this study. Besides, this situation was confirmed by a strictly negative correlation between diatom density and temperature in the study period (Table 5).
On the other hand, it is known that M. leidyi has a considerable impact on the seasonal fluctuations of phytoplankton, particularly dominant taxonomic groups such as diatoms and cyanophytes in the Caspian Sea. However, in this study, we observed that while there was an important positive correlation between cyanophytes and M. leidyi (r = 0.797) (Figure 5C, D), there was no important correlation between diatoms and M. leidyi (r = –0.353) (Figure 5B, D). In addition, excessive utilization of DIS due to the excessive diatom blooms during the winter and spring periods and in the following period (summer) thereby decreasing diatoms due to the DIS deficiency and also increasing temperature (Table 1), were important reasons for the increase of cyanophytes in the summer period (Figures 4 & 5C). The increase in M. leidyi along with the increase in cyanophytes was confirmed by positive correlation between temperature and M. leidyi and negative correlations between DO and M. leidyi, between DIS and M. leidyi and between DIS and cyanophytes (Table 5).
CONCLUSIONS
This study documented the spatial and temporal distribution of phytoplankton in the south-western Caspian Sea in 2009–2010 and attempted to assess fluctuations of phytoplankton in comparison with the previous literature. We believe that atmospheric and hydrologic variations such as water temperature, fluctuations of silicate and especially increased nutrient discharges by rivers have played important roles in the variation of phytoplankton composition and high phytoplankton abundance in the south-western Caspian Sea.
It is also known that the occurrences of increased atmospheric nitrogen deposition in South-east Asia during smoke haze episodes have undesired consequences on receiving aquatic ecosystems (Palani et al., Reference Palani, Tkalich, Balasubramanian and Palanichamy2011). The relative abundance of nitrate (N) over phosphorus (P) has increased significantly over the period since 1980 in the marginal seas bordering the north-western Pacific Ocean, located downstream of the populated and industrialized Asian continent. Palani et al. (Reference Palani, Tkalich, Balasubramanian and Palanichamy2011) revealed that the increase in N availability within aquatic systems may be mainly driven by increasing N concentrations and is most likely due to deposition of pollutant N from atmospheric sources. Kim et al. (Reference Kim, Lee, Najjar, Jeong and Jeong2011) also showed that the abundance of N relative to P in north-eastern Asian marginal seas has increased significantly since 1980. Air nitrogen deposition (ADN) has narrowed the deficiency of N relative to P across the marginal seas bordering the north-western Pacific Ocean, located downstream of the populated and industrialized Asian continent. ADN has even resulted in an N surplus in the East China Sea, Yellow Sea and East Sea, commencing in the mid-1990s. The findings of Kim et al. (Reference Kim, Lee, Najjar, Jeong and Jeong2011) may have broader implications including for the Caspian Sea. Indeed, the observed trends may be extrapolated to the coastal seas of the North American Atlantic Ocean and the North, Baltic and Mediterranean Seas which have received ever increasing amounts of atmospheric nitrogen deposition and river-borne nitrogen, comparable to those absorbed by coastal and marginal seas of the north-western Pacific Ocean (Galloway et al., Reference Galloway, Dentener, Capone, Boyer, Howarth, Seitzinger, Asner, Cleveland, Green, Holland, Karl, Michaels, Porter, Townsend and Vöosmarty2004; Duce et al., Reference Duce, LaRoche, Altieri, Arrigo, Baker, Capone, Cornell, Dentener, Galloway, Ganeshram, Geider, Jickells, Kuypers, Langlois, Liss, Liu, Middelburg, Moore, Nickovic, Oschlies, Pedersen, Prospero, Schlitzer, Seitzinger, Sorensen, Uematsu, Ulloa, Voss, Ward and Zamora2008; Doney, Reference Doney2010). All the evidence suggests that water soluble atmospheric ON is principally continental in origin and can contribute significantly to the total soluble nitrogen flux (Cornell et al., Reference Cornell, Rendell and Jickells1995, Reference Cornell, Jickells, Cape, Rowland and Duce2003), a significant fraction of which is available to phytoplankton growth as N source (Antia et al., Reference Antia, Harrison and Oliveira1991; Peierls & Paerl, Reference Peierls and Paerl1997).
We suggest that the effects of climate change, environmental degradation, changes in hydrology, atmospheric accumulation and groundwaters as new nitrogen sources along with other nutrient sources on coastal eutrophication and harmful algal blooms should be taken into account in future studies.
ACKNOWLEDGEMENTS
The authors are grateful to Sam Allen and Umur Onal for improving the English of the first and latest version of the manuscript, respectively. We would like to thank the Inland Waters Aquaculture Institute and Iranian Fisheries Research Organization (IFRO) for supporting this project. The Universiti Sains Malaysia (USM) is also gratefully acknowledged. We greatly appreciate the assistance received from M. Fallahi, A.R. Mirzajani, H. Khodaparast, J. Sabkara, E. Yosefzad, M. Saiyad-Rahim, Y. Zahmatkesh, H. Mohsen-Pour, J. Khoushhal and M. Iran-Pour in this study. This research received no specific grant from any funding agency, commercial or not-for-profit sectors.