


The rights of gays and lesbians, as part of the so-called “culture wars,” lie at the heart of recent political conflict in the United States, perhaps even affecting the outcome of the 2004 presidential election. Battles over gay rights have been fought most intensely at the subnational level—in legislatures, courtrooms, and direct democracy campaigns—yielding a complex policy mosaic. Some states have adopted numerous progay policies; others have few or none. What explains this variation? In particular, significant controversy has arisen over the role of public opinion and how well opinion majorities are respected.
This evokes a basic tension in democratic theory. Functioning democracy requires some minimal matching of government choice to citizen preference. However, normative concerns quickly arise. Too little responsiveness calls democracy into question, whereas complete popular sovereignty raises the spectre of “tyranny of the majority.” This is particularly true for civil rights because minorities might be unable to rectify grievances through electoral processes. A strong relationship between public opinion and policy may suggest successful representative democracy, but still be troubling if it leads to fewer protections or rights for minorities.
Struggles over minority rights have played a large role in U.S. history and are among the core conflicts in any diverse democracy. Such struggles have perhaps moved from race to sexual orientation, but basic tensions remain unresolved. Our inquiry sheds insight into how these tensions play out for gay rights, and, in particular, will allow us to assess the extent to which majoritarian responsiveness has thwarted the objectives of the gay rights movement. These questions are not answered by the existing literature, which tends to focus on traditional “New Deal” issues, such as welfare or regulatory policy, or a narrow set of Burger Court social issues, such as abortion and the death penalty (Burstein Reference Burstein2003). Responsiveness in those areas would by no means guarantee responsiveness for minority rights.
Indeed, some argue that progay policies are not responsive to opinion, but rather imposed against popular will by liberal elites, interest groups, and activist judges, pushing what Justice Scalia calls the “homosexual agenda” (Lawrence v. Texas 2003). Furthermore, federal and state constitutional law often limits public choice and possibly responsiveness in civil rights issues. Alternatively, it is argued that conservative religious voters exert an undue influence on policy making and have, through political activism and interest group pressure, successfully blocked popular laws extending government protections to gays and lesbians. Is there a liberal or conservative policy bias?
Another key concern for democratic theory is how best to translate popular will into government action. Political “engineers” still struggle with issues of institutional design that date back to the earliest debates in political theory and that continue to play a large role in constitutional design today. Can the quality of democratic performance be improved through such choices? Which features of political institutions do so? Does our federal structure itself enhance majoritarianism?
In total, we study eight policies of particular importance to the gay rights movement: same-sex marriage, civil unions, adoption by gay parents, hate crimes laws, employment and housing nondiscrimination laws, domestic partner health benefits, and sodomy laws. Some of these directly invoke the foundations of personal and familial relationships; others invoke equality in the marketplace. Some are about affirmative rights, such as the right to marry; others offer negative rights, such as protection against discrimination.
We present theoretical arguments as to when and how public opinion will shape gay rights policies, highlighting two potential trade-offs in policy responsiveness. First, we expect a trade-off between a legislator yielding to constituent preferences and pursuing his or her own policy goals. For more salient policies, he or she will prioritize constituent preferences. For less salient policies, it is both easier for the legislator to shirk constituent preferences undetected and less likely that constituents will care even if shirking is detected. Second, we anticipate a trade-off between paying attention to policy-specific opinion and following more general cues such as constituent ideology. Again, for more salient policies, legislators will respond more to policy-specific opinion. For less salient policies, when they have less information about constituent preferences, they will instead depend on cues, to the extent they respond to constituent preferences at all.
We seek to explain responsiveness variation across states, in terms of ideology, interest group pressure, and institutional features of the state government. First, we explore the degree to which voter or government ideology are instead the main drivers of policy making. Second, we consider the extent to which the differential strength of religious conservatives across states independently explains policy and responsiveness variation. Finally, we hypothesize that responsiveness will be enhanced by institutions that increase the capacity of government to respond to the public, such as legislative professionalization, and those institutions that empower opinion majorities, such as the direct election of judges or the availability of the citizen initiative. The empirical literature on gay rights policy making often ignores such institutional variation, despite the frequent claims that the gay rights movement is disadvantaged in states with majoritarian institutions.
To estimate state-level public opinion, we apply recent advances that allow us to produce measures of state-level policy-specific opinion using national surveys and multilevel modeling. We then test our hypotheses about the relationship between opinion and policy: whether each policy is responsive to policy-specific opinion, whether policy is congruent with the preferences of opinion majorities, whether responsiveness to opinion persists after controlling for other influences, and how responsiveness and congruence are conditioned by salience and these other influences.
Most studies of responsiveness consider only general measures of ideology or mood and aggregated policy indices. Studies that focus on individual policies are relatively rare and usually cannot connect policies to policy-specific opinion. Gay rights policies represent an excellent arena for parceling out the influence of each. We have a set of related policies, over which opinion varies greatly by policy and by state. Furthermore, because we focus on dichotomous policies (does the state have the policy in question or not?) and because we have survey response estimates directly tied to these dichotomous policies, we can estimate median voter policy preferences and consider their influence in contrast to general ideology, along with institutional and interest group variation. We also differentiate between responsiveness to opinion and congruence with opinion majorities.
Our results have implications for the understanding of American federalism. Responsiveness is not only one of the key metrics for evaluating the general success of democratic institutions, but can also be used to evaluate the efficacy of our federal system. The matching of policy to state, as opposed to national, majorities is the raison d’être of federalism, allowing decentralized control, rather than one-size-fits-all policy. Whether state control over gay rights policies actually produces policy reflective of state opinion majorities, therefore, tells us whether federalism produces majoritarian welfare gains. In addition, it sheds light on the long-standing struggle over which majority should govern, given that policy making is shared between federal and local control. But there are troubling normative implications as well, if civil rights and protections are simple accidents of geography. Although gays and lesbians may not face the limits on democratic participation faced by African Americans in their civil rights pursuits, they still need to worry about the tyranny of local majorities. Madison's Federalist 10 suggests that minorities will best be protected in a larger republic—in this context, has federalism been beneficial for the rights of gays and lesbians?
Our results also provide insights into the successes and failures of the gay civil rights movement, and how it might move forward. For example, is it a matter of shifting public opinion on or attention to the particular policies, or are more global ideological swings necessary? Should partisan politics be the focus or should institutional reform? Should advocates continue to fight at the state level or push for federal action? What is the trade-off between satisfying the goals of the gay rights movement and satisfying majority opinion? The answers to these questions may inform future civil rights movements and suggest new hypotheses for the study of past movements.
STUDYING RESPONSIVENESS
Earlier research raised significant doubts about public influence over policy making, based on the lack of substance in political campaigns and on the capacity of the public to play a minimally informed role. At the state level, stronger concerns about citizen attention, the existence of an electoral connection, and the sway of local interest groups led to the dismissal of state-level public opinion by many political scientists (see Treadway Reference Treadway1985). More recent scholarship has established a body of convincing evidence that national policy changes correspond to trends in public opinion (e.g., Page and Shapiro Reference Page and Shapiro1983; Stimson, MacKuen, and Erikson Reference Stimson, MacKuen and Erikson1995). Even after evidence at the national level accrued, state policy making was still often attributed to factors far removed from public opinion and electoral control (one exception being Page and Shapiro Reference Page and Shapiro1983). Erikson, Wright, and McIver strongly disagreed, concluding that “state opinion is virtually the only cause of the net ideological tendency of policy in the states” (1993, 81). Others have reached similar, if less dramatic, conclusions (e.g., Norrander Reference Norrander2000; Brace et al. Reference Brace, Sims-Butler, Arceneaux and Johnson2002; see Burstein Reference Burstein2003, 38–9).
As Burstein (Reference Burstein2003) points out, the central issues in public opinion research are now the degree to which opinion affects policy and the conditions under which it can. Answering these more nuanced questions has proven quite difficult. Work focusing on state-level responsiveness is complicated by the relative paucity of comparable polls across states. Researchers have had to limit themselves to survey questions that have been asked in dozens of compatible national polls. These tend to cover ideology as opposed to opinion on specific policies. Thus, “opinion” can usually only be invoked in the form of “aggregate liberalism” scores, such as those of Erikson, Wright, and McIver (Reference Erikson, Wright and McIver1993) or Berry et al. (Reference Berry, Ringquist, Fording and Hanson1998), which serve as indirect measures of opinion. Some policies, for that matter, map quite poorly to general ideology. This is in part why Norrander suggested that “direct measures of public opinion on specific policies will give investigators more valid and precise instruments with which to assess the influence of opinion on state politics” (2001, 122).
We thus move beyond the existing literature to tie policy making to opinion relating directly to the policies in question, considering both responsiveness to opinion and congruence with opinion majorities. We ask how much impact opinion has, how responsiveness varies across policies, the relative weight of general ideological attitudes and specific policy preferences, how and when opinion majorities can obtain their preferred policies, and how elected representatives trade across issues and within issues in balancing their own preferences and those of their constituents. All this would be difficult if not impossible without policy-specific opinion estimates.
We construct our estimates of state-level policy-specific opinion using a technique, multilevel regression and poststratification (hereafter, MRP), developed by Gelman and Little (Reference Gelman and Little1997) and Park, Gelman, and Bafumi (Reference Park, Gelman, Bafumi and Cohen2006), and systematically assessed by Lax and Phillips (Reference Lax and Phillips2009). By using these policy-specific estimates, we avoid problems of inference that arise when policy and opinion lack a common metric (Achen Reference Achen1978; Matsusaka Reference Matsusaka2001). A high correlation of policy and opinion can reveal a strong relationship between the two; however, without knowing the desired mapping of opinion to policy, one cannot tell if policy is over- or underresponsive to opinion and one cannot tell if there is bias in the liberal or conservative direction. That is, even if a positive correlation exists between policy and opinion, one could not tell if this relationship is biased upward or downward or if it has too steep or shallow a slope (see Erikson, Wright, and McIver Reference Erikson, Wright and McIver1993, 93).
Unlike most studies, we do have opinion and policy on a common metric. We study dichotomous policy choice, such as “Do you favor allowing gay and lesbian couples to marry legally?” Thus, we can directly assess whether policy is actually congruent with a state majority's preferred policy—or if it is instead more liberal or conservative than a majority wants. Furthermore, because our estimates are direct measures of the relevant preferences, rather than aggregate liberalism or some other indirect measure, we can evaluate causality and the role of institutions more cleanly.
A sizable literature has analyzed the adoption of individual or small sets of gay-related policies, but without access to policy-specific opinion. For example, many studies rely on demographic or socioeconomic indicators (e.g., population or wealth), and others use general ideology scores, sometimes in combination with interest groups or partisanship.Footnote 1 Brace et al. (Reference Brace, Sims-Butler, Arceneaux and Johnson2002) show a connection between attitudes toward homosexuality and public opinion on AIDS research funding. Haider-Markel and Kaufman (Reference Haider-Markel, Kaufman and Cohen2006) go further than most previous work in testing the relationship between specific policies and attitudes about the general issue area, showing a relationship to hate crimes laws but not to sodomy law repeals or same-sex marriage bans.
Overall, this literature has not found a consistent relationship between opinion and policy, nor fully incorporated the new institutionalism by considering how institutional variation explains policy and conditions opinion or other predictors.Footnote 2 Conclusions cannot be considered determinative without good measures of policy-specific opinion. Positive relationships between ideology and policy need not mean public opinion is truly affecting policy, and the lack of a relationship could be due to measurement error, to the extent general attitudes do not capture policy-specific opinion. Furthermore, it is difficult to explain policy variation within a state using policy-invariant attitudes.
THEORY AND HYPOTHESES
Opinion and Ideology. Should we expect gay rights policies to be responsive to policy-specific opinion? Should we expect majorities to prevail in the battles over such policies? Our answer to both questions is a conditional “yes.” There are numerous paths by which opinion can shape policy, but the most obvious is the “electoral connection.” Although goals may be multifaceted, the desire for reelection has long been established as a powerful driver, if not the primary driver, of the behavior of elected officials, creating a general incentive to do what the public wants (Mayhew Reference Mayhew1974). Even beyond reelection incentives for policy choice, there are selection effects; that representatives are elected means that we should expect them to already reflect their constituents’ views, on average. Also, the public can shape policy directly through the citizen initiative and indirectly through interest group pressure.
We generally expect the majority to get its way. In particular, the existing literature argues (e.g., Haider-Markel and Kaufman Reference Haider-Markel, Kaufman and Cohen2006) that “morality” issues such as gay rights will be highly responsive because they invoke general notions of right and wrong, can be framed in noncomplex ways, and have been at the heart of recent political debate.
Although we anticipate responsiveness for the gay rights policies we study, there are also reasons to anticipate imperfect and varying responsiveness across policies, institutional settings, and political environments. We would not expect representative democracy to perfectly capture majority will on every individual policy choice. Salience varies. Policy-making power is divided and shared among many actors, some of which may better represent majorities, whereas others, such as unelected courts, may have different incentives. Federal and state constitutional law can constrain policy choice, as in all civil rights battles. Furthermore, policy can be inherently slow to change. All these factors could limit responsiveness. Properly assessing the role of opinion means considering the factors that enhance or retard responsiveness. We now address the most important of these.
Salience. Legislators and other elected actors need not do what their constituents want on each and every issue, but rather need to be responsive “enough” or perhaps simply more responsive than their (likely) opponents. This means they face a trade-off in their reelection calculus: how do they meet their responsiveness “needs” trading across issues and within an issue area? To what extent do they represent their constituents and to what extent do they go their own way? We see one key predictor of how they will resolve these trade-offs to be issue and policy salience—that is, importance and visibility to the public at large, and prominence in public discourse.
Elites may also be unaware of their constituents’ views, especially regarding those policies that are less salient. As Burstein argues, we should expect the government to do “what the people want in those instances where the public cares enough about an issue to make its wishes known” (Reference Burstein1981, 295). For more salient policies, the electoral incentives are that much more clear: on one side, the legislators will have greater information about public opinion, and, on the other side, the greater visibility of policy choice should decrease ability to get away with shirking public will. (Page and Shapiro [1983] cite similar arguments for greater responsiveness in salient policy areas, particularly those of great social or moral concern.) By giving voters what they want on the more salient issues, legislators may be able to, in other policy areas, pursue their own policy goals, repay interest groups for prior and future support, satisfy core constituencies, and so on.Footnote 3
Indeed, legislators actually have two potential trade-offs to resolve, each relating to one aspect of salience. The first is to allow themselves greater leeway in terms of their own preferences, which they can follow to the extent low salience represents low importance to the public. The second response, induced to the extent that low salience means less information about their constituents’ specific policy preferences, is to follow cues in lieu of unknown specific policy opinion (see Druckman and Jacobs Reference Druckman and Jacobs2006). The most likely cue is general voter ideology.
Thus, we expect salience to condition not only the role of policy-specific opinion, but also the role of diffuse voter ideology. We expect that political actors will shift attention to opinion when salience is high and away from it when low. But the other salience trade-off could dampen this effect or even swamp it—when salience is low, the legislators could shift away from caring about the public's preferences overall, so that low salience instead means low responsiveness with respect to ideology (as well as to opinion). Given that all eight policies we study are reasonably salient, we expect the first effect to dominate such that high salience means less net attention to general ideological cues. We assess this empirically later in this article. Nonetheless, the prediction for opinion is clear: higher salience means greater responsiveness. Salience should also lead to greater congruence between state policy and state majorities (as Monroe [1998] finds for national policy and opinion).
Whereas the particular gay rights policies we study are not equally salient, they have all received a fair amount of attention, and they all continue to appear on state legislative agendas. The bottom line is that the salience of each issue we study should be sufficient to produce some degree of responsiveness; however, we predict that the most highly salient policies will be the most responsive and most likely to be congruent with opinion majorities. And there is sufficient variation in salience for us to explore such effects.
Interest Groups. Elected officials may feel it desirable or necessary to satisfy key interest groups instead of the median voter, for financial or other reasons. Although business groups tend not to take positions on gay rights issues, the most potent form of opposition is the religious right, in the form of both organized interest groups and conservative religious voters (Green Reference Green, Rimmerman, Wald and Wilcox2000; Haider-Markel and Kaufman Reference Haider-Markel, Kaufman and Cohen2006). We thus expect that such voters and religious interest groups will have influence over policy beyond their indirect effects on public opinion itself.
Institutions. Finally, institutional characteristics might affect the role of public opinion in two ways. First, institutions may enhance the capacity of government to assess and respond to public opinion. States vary widely in the professionalization of their legislatures; that is, some have longer legislative sessions, higher salaries, and more staff. Greater professionalization should increase responsiveness to public opinion. Awareness of public opinion should be higher (in part because they have greater resources to find out what the public wants); longer agendas allow more issues to be considered, including those of relatively lower salience; and outside employment is less likely to constraint a legislator's attention to constituent interest.
Second, institutions can enhance or limit majoritarianism. Professionalization should strengthen the electoral connection, in that seats in professionalized chambers are more valuable to hold onto (Maestas Reference Maestas2000). Another institution that is said to increase policy majoritarianism is the citizen initiative. Direct democracy allows the voters to circumvent the legislature and propose and adopt policy changes themselves. It is argued that this increases responsiveness directly, and even indirectly, by putting pressure on the legislature to respond rather than cede policy control to voters (Gerber Reference Gerber1996). The existing empirical evidence for institutional effects is, however, mixed (cf. Arceneaux Reference Arceneaux2002; Lascher, Hagen, and Rochlin Reference Lascher, Hagen and Rochlin1996).
Features of a state's judicial system might also enhance majoritarianism. Courts often limit public choice in civil rights issues, so that the responsiveness to public opinion might be thwarted, for good or ill. However, in those states where judges are elected, the judges themselves are tied to the public through an electoral connection: judicial decisions on social issues (e.g., gay rights, the death penalty, abortion) often play a role in judicial elections, even in retention elections. We thus expect greater responsiveness in states that elect their high court judges (see Huber and Gordon Reference Huber and Gordon2004). We look for a general effect of elected courts and also look policy by policy. For example, some policies, like adoption and sodomy law, seem heavily influenced by court decisions. In contrast, courts have played little to no role in the creation of employment, housing, or hate crimes protections. Relationship recognition policy (unions, marriage, and domestic partner benefits), meanwhile, has been split between legislative and judicial influence.
Institutions can also lead to “bias” in the sense that they are more or less likely to produce outcomes favoring the policies preferred by gays and lesbians than otherwise called for by public opinion. That is, setting aside responsiveness, they may push policy one way or the other. For example, Haider-Markel, Querze, and Lindaman (Reference Haider-Markel, Querze and Lindaman2007) argue that direct democracy contests are likely to lead to antigay outcomes. Or, if professionalized legislatures are more “elitist” in the sense of the “culture wars,” then they might be biased in the progay direction. We assess both claims.
DATA AND METHODS
We first give an overview of the techniques for estimating policy-specific opinion. See Appendix for further details.
Opinion Estimation: Methodological Overview
The most commonly used method for estimating state-level opinion is disaggregation, pioneered by Erikson, Wright, and McIver (Reference Erikson, Wright and McIver1993). Disaggregation involves combining a large set of national polls and then calculating the opinion percentages disaggregated by state. The principle disadvantage is that a large number of national surveys are required, usually over a very long time period (e.g., 25 years in Brace et al. Reference Brace, Sims-Butler, Arceneaux and Johnson2002), to create a sufficient sample size within each state. Even then, smaller states or those seldom surveyed must sometimes be dropped entirely. This often makes it impossible to collect a sufficient number of compatible or contemporaneous surveys. Indeed, we cannot use this approach here: most of the gay rights issues are too rarely polled, and opinion on these issues is not sufficiently stable for disaggregation over long periods of time (Brewer and Wilcox Reference Brewer and Wilcox2005).
Fortunately, an alternative exists—the simulation of state opinion using national surveys. Multilevel regression and poststratification, or MRP, is the latest implementation of such a method (Gelman and Little Reference Gelman and Little1997; Lax and Phillips Reference Lax and Phillips2009; Park, Gelman, and Bafumi Reference Park, Gelman, Bafumi and Cohen2006; see Gelman and Hill [2007] for a comprehensive review of multilevel models). In the first stage, a multilevel model of individual survey response is estimated, with opinion modeled as a function of demographic and geographic predictors: individual responses are modeled as nested within states nested within regions, and are also nested within demographic groupings (e.g., four education categories as one grouping). Instead of relying solely on demographic differences like older incarnations of the method, the state of the respondents is used to estimate state-level effects, which themselves are modeled using additional state-level predictors such as region or state-level aggregate demographics not available at the individual level. Those residents from a particular state or region yield information as to how much predictions within that state or region vary from others after controlling for demographics. MRP compensates for small within-state samples by using demographic and geographic correlations. All individuals in the survey, regard less of their location, yield information about demographic patterns that can be applied to all state estimates.
The second step is poststratification: the estimates for each demographic-geographic respondent type are weighted (poststratified) by the percentages of each type in actual state populations, so that we can estimate the percentage of respondents within each state who have a particular issue position. Such poststratification can correct for clustering and other statistical issues that may bias disaggregation estimates (see Norrander Reference Norrander2007, 154).
Comparisons of MRP with other techniques have demonstrated that it performs very well. Park, Gelman, and Bafumi (Reference Park, Gelman, Bafumi and Cohen2006) compare its results to two alternate ways of producing state estimates by modeling individual response. MRP, which partially pools information across states, does better than not pooling at all—that is, running a separate model for each state's respondents, the equivalent of using fixed effects and interaction terms for all predictors. And it does better than pooling all respondents across states—that is, using only demographic information and ignoring geographic differences. Lax and Phillips (Reference Lax and Phillips2009) systematically assess MRP, also comparing it to its main competitor, disaggregation. They establish the face and external validity of MRP estimates, by comparing them to actual state polls. MRP consistently outperforms disaggregation, even biasing the baseline toward disaggregation. Indeed, a single national poll and a simple demographic-geographic model (just race and state effects) suffice for MRP to produce highly accurate and reliable state-level opinion estimates. MRP estimates using small samples were roughly as accurate as disaggregation samples 10 times as large. Even if disaggregation were feasible for our gay rights polls, MRP has been shown to improve upon it.
Estimating Policy-Specific Opinion on Gay Rights
The survey questions are roughly as followsFootnote 4:
• Adoption—Do you think there should be adoption rights for gay and lesbian couples?
• Hate Crimes—If a hate crime law were enacted in your state, do you think that homosexuals should be covered?
• Health—Should there be health insurance and other employee benefits for gay spouses?
• Housing—Should there be laws protecting homosexuals from discrimination in housing?
• Jobs—Should there be laws to protect gays and lesbians from discrimination in job opportunities?
• Marriage—Do you favor allowing gay and lesbian couples to marry legally?
• Sodomy—Do you think homosexual relations between consenting adults should be legal?
• Unions—Do you favor allowing gay and lesbian couples to form legally recognized civil unions, giving them many of the legal rights of married couples?
We make the assumption that majority opinion on a survey question captures majority opinion on the target policy. We do not believe this to be problematic. The survey questions we use are particularly well connected to policy choice. Although framing or question wording effects might still shift levels of support up or down,Footnote 5 we address this in part by including poll effects in our estimation process. Our estimates of such effects usually turn out to be small.
We model survey response as a function of race, gender, age, education, state, region, aggregate state presidential vote choice, aggregate state religious conservatism, and poll. These are standard predictors of social attitudes, in general, and on gay rights, in particular (e.g., Cook Reference Cook1999). We find that demographic and geographic predictors preform quite well in explaining response at the individual level.
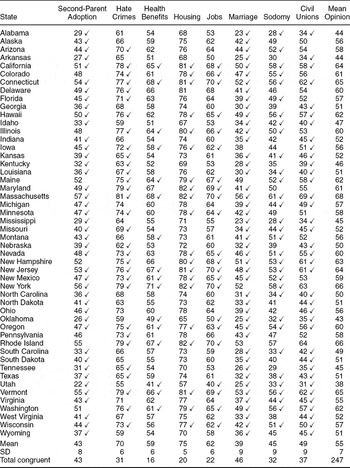
Table 1 shows our opinion estimates and descriptive statistics. There is significant variation in policy support across states and policies. Within states, opinion also varies quite a bit across issues. Across states, marriage has the lowest mean support and housing the highest. There is far greater support for marketplace equality issues than for policies regulating personal and familial relationships: for example, no state has lower than majority support for housing or hate crime protection, whereas marriage and adoption support hit the low 20s.
Opinion Estimates and Summary Statistics

Notes: Estimates of explicit progay policy support are shown by state (see the Appendix for details). The last column shows mean opinion across all eight policies by state. Checkmarks indicate policy congruence with opinion majorities (of the eight entries for which majority opinion is ambiguous due to rounding, only the following are strictly above 50%: Arkansas-Jobs, Illinois-Sodomy, and Alaska-Civil Unions).
Policy-specific opinion does correlate to Erikson, Wright, and McIver's (Reference Erikson, Wright and McIver1993) widely used measure of voter ideology by state. Opinion on job protection has the weakest correlation, at .74, and that on hate crimes the most, at .83. Clearly, our opinion estimates capture something more than simple ideology, as are seen when they are put head to head in the regression analysis.
State Policy
We gathered data on state policies from the Human Rights Campaign, except for sodomy law data, which came from the National Gay and Lesbian Task Force. State policy is coded as of June 2009, with the exception of sodomy laws, for which we code policy at the time of Lawrence v. Texas (2003), the Supreme Court decision that struck down the criminal prohibition of homosexual sodomy.
Policies are coded dichotomously, 1 for the progay policy and 0 otherwise: Adoption (9 states allow second-parent adoption in all jurisdictions); Hate Crimes (31 states include sexual orientation in hate crimes laws); Health (14 states give state employees domestic partner benefits, including health insurance); Housing (20 states prohibit discrimination in housing based on sexual orientation); Jobs (20 states prohibit discrimination in employment based on sexual orientation); Marriage (5 states allow same-sex marriage); Sodomy (35 states had no same-gender or opposite- and-same-gender sodomy law); and Unions (11 states have legal relationship recognition, including marriage, civil unions, or the provision of some spousal-like rights). We also construct a progay policy index counting the total score among the previous. Fewer than half the states have a value of 0 or 1. Massachusetts, Connecticut, and Vermont score 8. Four other states score 7.
RESULTS AND DISCUSSION
We begin by assessing the basic relationship between policy and policy-specific opinion. We next investigate whether this relationship persists even after controlling for other predictors.
Policy and Policy-Specific Opinion
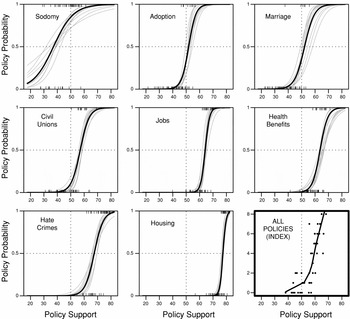
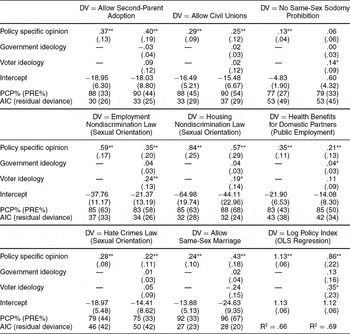
Responsiveness. We first present logistic regression analyses of each state policy against policy-specific opinion. The results are graphed in Figure 1, with numerical results shown in Table 2. Each graph plots the probability of policy adoption derived from the logistic regression curve given state-level policy-specific opinion. The last panel shows average opinion against the policy index, along with a “loess” (locally weighted regression) curve. For all policies, higher policy-specific opinion is associated with a higher probability of policy adoption, a relationship that is both substantively and statistically significant. The slope varies across policies; we explain this variation as follows. The policy index graph shows the aggregate relationship between average opinion and policy. Like the individual policies, the index is also responsive. The curve starts somewhat shallow, but once average opinion rises past 50%, the policy index curve begins to rise steeply. As a first cut, these results suggest policy-specific opinion matters. We can also take advantage of our common metric for policy and opinion to look at congruence with opinion majorities.
Logistic Regression Plots

Policy Responsiveness (Individual Policies and Policy Index)

Note: Alaska and Hawaii are excluded. PCP = percent correctly predicted; PRE = proportional reduction of error; AIC = Akaike information criterion. For the index model, we use average opinion within each state. Log policy index is the log of one plus a simple count within each state (0–8), using rescaled coefficients. One-tailed tests are used: *ρ < .10, **ρ < .05.
Congruence. The responsiveness models show that the slope of policy probability with respect to opinion is steep, but even a steep slope (high responsiveness in that sense) can yield noncongruence (a lack of majoritarian responsiveness). Figure 1 shows that responsiveness to housing opinion is high, higher (steeper) than that for sodomy opinion (which is verified by the coefficients in Table 2). However, housing policy is congruent in 12 fewer states. Table 1 indicates which states have congruent policies, with the total number at the bottom. Housing and job protection are congruent in only 20 and 22 states, respectively. Health care benefit policy is congruent in only 16 states. Meanwhile, marriage and adoption policy are highly congruent. Six states are fully congruent (California, Connecticut, New Jersey, Massachusetts, Oregon, and Vermont); two states (Alaska and Pennsylvania) tie for lowest at two congruent policies; the mean is five.
To further see how responsiveness and congruence can differ, return to Figure 1. Within each panel, mapping the point of intersection between the curve and the vertical dotted line over to the y-axis reveals the predicted probability of policy adoption at 50% support. And mapping the point of intersection between the curve and the horizontal dotted line down to the x-axis reveals the needed support level for the predicted probability of policy adoption to reach 50%. The cross-hair at the intersection of the two 50% lines marks the point at which 50% public support correlates to a 50% chance of policy adoption. For perfect majoritarian control, the slope of the curve would be very steep at 50% (effectively flat otherwise) and hit the cross-hair within each panel. But, in the policy graphs, whereas policy clearly correlates to opinion, the actual curves sometimes fall short of the cross-hair (to the left/above), sometimes hit it, and sometimes overshoot it (to the right/below). That is, policy adoption can be biased in the progay direction, on target, or biased in the antigay direction, given the preferences of the policy-specific opinion majorities. This explains the curious comparison between housing and sodomy—the sodomy curve is closer to the 50-50 cross-hairs despite being more shallow. Public opinion can matter strongly, without the majority getting its way much of the time.
For adoption and marriage, the 50-50 point is nearly hit, so that policy seems most in line with public support. For sodomy, however, where the curve is to the left of the cross-hair, roughly 40% support leads to a 50% chance of policy adoption and 50% support leads to roughly an 80% chance. For those curves that are to the right of the cross-hair—civil unions, jobs, housing, health, and hate crimes—policy is more conservative than majority opinion warrants. For all of these but civil unions, the probability of policy adoption at 50% support is roughly zero. Or, to flip this, for housing, a 50% chance of policy adoption is not reached until opinion is more than 75%. There is no consistent liberal bias; if anything, we observe a conservative bias.
The basic relationship between policy and specific relationship is clear: states with a higher level of policy support are more likely to have the policy. We next evaluate the relationship to policy-specific opinion after other influences on public policy are incorporated into the analysis. Is there truly responsiveness to policy-specific opinion? Is this finding robust? What conditions this relationship? Why are some policies more congruent with opinion majorities than others?
Adding Elite and Voter Ideology
We contrast the effects of policy-specific opinion with those of Voter Ideology, using updated scores based on Erikson, Wright, and McIver (Reference Erikson, Wright and McIver1993), and with the effects of state Government Ideology, using scores by Berry et al. (Reference Berry, Ringquist, Fording and Hanson1998). The former employ national survey data on self-identified liberal or conservative status. The latter measure the ideology of state governments, based on the partisan configuration of state government and the state congressional delegation's interest group scores (averaged over 1995–2005).Footnote 6 Higher numbers are more liberal for both measures, which correlate at .6.
Table 2 shows the results of including these other predictors in logit models. The more inclusive models show that policy-specific opinion has a consistently significant effect on policy adoption independent of elected elites or voter ideology, with the exception of sodomy policy. Specific opinion remains significant in all other models (albeit sometimes smaller in substantive magnitude). The other influences are inconsistent across policies. For some, we do find a significant impact of government or voter ideology, whereas for others we do not. When coefficients are standardized (results not shown), the magnitude of the policy-specific opinion effect is almost always much larger than either voter or government ideology (again, with the exception of sodomy policy). The policy index model in Table 2 again reveals clear effects of both policy-specific opinion and general voter ideology, but not government ideology (if the policy index is not logged, then opinion matters but not ideology).Footnote 7
Adding Salience, Interest Groups, and Institutions
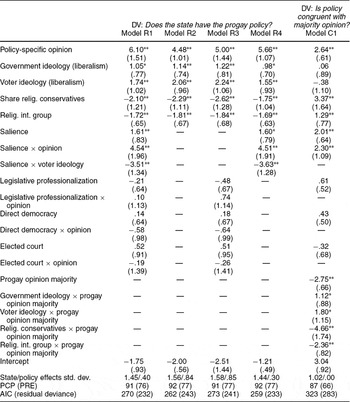
Sample size when running individual policy models precludes consideration of a larger set of predictors, so we next turn to multilevel models including all policy areas together, with separate intercepts by state and policy. Table 3 shows results.Footnote 8 As robustness checks, Models R2, R3, and R4, respectively, include no interactions, only interactions with institutions, and only the interaction between salience and opinion.Footnote 9 The most important conditional predictor is salience.
Policy Responsiveness and Congruence (All Policies)

Note: N = 384 (AK and HI are excluded). For congruence, opinion is measured as absolute size of the opinion majority (50–100). All continuous variables are standardized by subtracting the mean and dividing by 2 standard deviations, thus putting them on the same scale as each other and roughly the same scale as the dichotomous variables. Multilevel models are estimated using GLMER in R. Policy and state random effects (varying intercepts) are included in the models (standard deviations shown above), along with separate intercept/opinion slope for sodomy policy. PCP = percent correctly predicted; PRE = proportional reduction of error compared to the modal category; AIC = Akaike information criterion (lower is better). Directional predictions use one-tailed tests: * ρ < .10, ** ρ < .05.
There is again a very strong relationship between policy and policy-specific opinion, independent of other influences. The average substantive impact of opinion remains high; the impact of a marginal increase of one point of policy-specific opinion around the middle of the probability range is an increase of 6 points in policy probability. The effect of policy-specific opinion is far larger than that of government ideology or of general voter ideology, although both ideology measures perform as expected and are statistically significant. (For sodomy policy, there is still no significant effect of opinion.) We draw out a full set of predicted probabilities later in this article, including significance tests.
Salience. To measure salience across policies, we conducted a search of New York Times articles (2000–2005) using Proquest to count the number of times that the policy was mentioned in conjunction with the words “gay,” “homosexual,” or “same sex.” Salience is the log of the number of such stories. The scores meet standards of face validity: the numbers by policy are second-parent adoption (254), hate crimes (149), health benefits (49), housing (53), jobs (143), marriage (2098), sodomy (170), and civil unions (1558). Marriage and unions receive the highest degree of attention by far, with health benefits at the other extreme, and adoption in the middle.
Although crude, this measure performs quite well and similar measures have been used with prior success in studying gay rights policies (Haider-Markel and Meier Reference Haider-Markel and Meier1996). This measure is not designed to capture variation in state media coverage because such coverage might be endogenous to policy adoption by state, whereas the national measure will more cleanly capture the relative visibility of each issue. We interact this measure with our policy-specific opinion estimates. This allows us to test our hypothesis that greater salience will increase the likelihood that political actors will be aware of and yield to policy-specific opinion. Note that one cannot interpret the coefficients directly without taking interaction effects into account: the raw “base terms” are set up to give the effect of opinion at average salience and of salience at average opinion respectively.
Consistent with our expectations, there is a strong interaction effect between salience and opinion and between salience and voter ideology. The coefficient on the former interaction term shows that the marginal effect of opinion is greater for higher salience; the coefficient on the latter interaction terms shows that the marginal effect of voter ideology is smaller for higher salience.Footnote 10 That is, greater salience induces greater responsiveness to policy-specific opinion and reduces the impact of general attitudes. We draw out these results in detail later in this article.
Interest Groups. We include both the state Share of Religious Conservatives (the percent of evangelical Protestants and Mormons; American Religion Data Archive 1990) and a dummy variable for the existence of at least one powerful socially conservative Religious Interest Group functioning within the state (Thomas and Hrebenar [2008], based on interviews with local public officials and political scientists; data from Hrebenar).Footnote 11 These two variables are only correlated at .36, so a large number of religious conservatives does not guarantee a strong organized interest group.
Table 3 shows that the impact of opinion is far larger than that of either religious conservative predictor, but both have a clear effect on policy adoption—independent of the direct contribution they make to state policy-specific opinion and to voter ideology, and independent of their indirect effect on government ideology. The fact that the religious conservative predictors have strong influence suggests overrepresentation of such interests.Footnote 12
Institutions. We also interact our opinion estimates with each institutional variable to test whether they condition the effects of policy-specific opinion. Legislative Professionalization scores come from Squire (Reference Squire2007); they range from 0 to 1 and are a weighted combination of measures of salary, days in session, and staff per legislator, as compared to those in Congress the same year. Direct Democracy is an indicator for states that allow either constitutional or statutory citizen initiatives. Elected Court is an indicator for states that elect the judges in their highest court (including partisan, nonpartisan, and retention elections; other codings yielded the same results). Table 3 shows no evidence of institutional effects on policy adoption or on the influence of public opinion. None of the institutional coefficients are significant at default values, but we conducted hypothesis tests at other values of the predictors, and still found no effects. We return to this finding later.Footnote 13
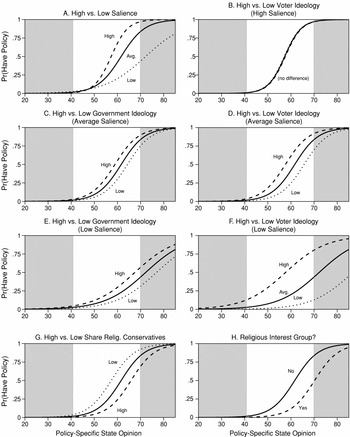
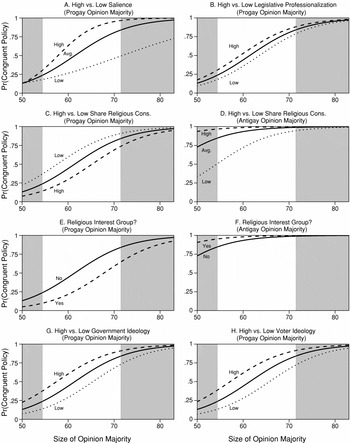
Marginal Effects and Predicted Probabilities of Policy Adoption. To understand these results, we calculated predicted probabilities of policy adoption under various conditions, using Model R4, graphing some results in Figure 2 (results are similar for Model R1). The solid line in each panel shows the predicted probability (y-axis) across the range of policy-specific opinion (x-axis) for average/default values of each predictor other than those indicated. Low to high is a two standard deviation shift. The effects of opinion on all policies other than sodomy are striking. Moving from low opinion (41%) to average opinion (55%) to high opinion (70%), the predicted probabilities of having the progay policy move from 2% to 23% to 84%. The marginal effect of one additional point of policy support on the probability of policy adoption is 3 percentage points (significant at 95%). These shift up or down given the values of other predictors, of course.
Predicted Probability of Policy Adoption Given Policy-Specific Opinion

Greater liberalism (voter or elite) increases the probability of progay policy; conservative religious pressures decrease it. The impact of the predictors on policy adoption can be compared. At average opinion, each of these four predictors has a statistically and substantively significant effect on the probability of policy adoption. At low opinion, the impacts are smaller.
The effects of salience are more nuanced: there is a clear interaction effect between opinion and salience and between voter ideology and salience. We start by leaving voter ideology at its mean. Panel A shows the striking pattern: the slope with respect to opinion is relatively shallow at low salience, but gets steeper for higher salience. At all levels of salience, opinion has a clear positive and statistically significant effect on policy adoption: the marginal effects of one point of opinion around average opinion are 1 (low salience), 3 (average salience), and 6 points (high salience). As expected, low salience decreases the influence of policy-specific opinion, and high salience increases the influence. To get a 50% chance of policy adoption, you need roughly 57% support if salience is high, roughly 62% if salience is average, and a whopping 73% if salience is low.
The effect of salience on the impact of general voter ideology, meanwhile, is almost exactly opposite that on opinion. In Figure 2, panels B, D, and F show the impact of high vs. low voter ideology at different levels of salience. As predicted, high policy salience dulls the impact of general voter ideology. The lower salience is, the flatter the curves (less responsive to policy-specific opinion), and the wider the spread between them (more responsive to voter ideology). The effect of salience on opinion impact can also be seen in panels C and E, although government ideology's effect is not directly increased by low salience, which is why the spread between high and low does not increase as dramatically as for voter ideology.
Congruence
As noted previously, you can have responsiveness without congruence. Therefore, we must explain not only which factors increase responsiveness to policy-specific opinion, but also which factors increase congruence. Institutions might not, for example, increase responsiveness (increase the slope) but might shift the responsiveness curves leftward or rightward toward the 50-50 mark. Indeed, perfect congruence would occur if all other predictors had no effect, responsiveness had a steep slope, and this slope went through the 50-50 point.
We now make congruence the dependent variable, with our opinion measure now the absolute size of the majority, whether pro- or antigay, ranging from 50 to 100 (if we omit this variable, our other results remain similar). The larger the opinion majority, the stronger the signal sent to political actors. We include salience, which can directly increase congruence with majority opinion and interact with size of the majority to further strengthen the opinion signal. Other interactions with opinion are no longer needed, because the coefficients on institutions now show their direct relationship to congruence. However, we now need to interact Progay Opinion Majority (a dichotomous variable) with predictors that have an ideological direction but that would not otherwise have a direction with respect to congruence itself.
Model C1 in Table 3 shows the results, with predicted probabilities graphed in Figure 3. The results reinforce our previous findings. The same forces that drive responsiveness to public opinion also drive congruence with opinion majorities, with some subtle distinctions.
Predicted Probability of Policy Congruence Given Policy-Specific Opinion

As predicted, the strength of the opinion signal (size of the opinion majority) increases the probability of congruence, as does salience. There is also a mutually reinforcing interaction effect between the two.Footnote 14 In Figure 3, panel A, the the predicted congruence curve is steeper when salience is high. For smaller majorities, congruence likelihood is largely the same regardless of salience, but for larger majorities, salience makes a much larger difference. At average opinion, salience makes a large significant difference in the likelihood of congruence.
Next, when the opinion majority is liberal, more liberal government or voter ideology increases congruence, as shown in panels G and H. There is no difference for conservative majorities, for which congruence is highly likely no matter the nature of voter or government ideology. Panels C, D, E, and F show that either a powerful conservative religious interest group or a higher share of religious conservatives increases congruence with conservative majorities and decreases congruence with liberal ones. Note that the “base” term of Progay Opinion Majority is negative and statistically significant, so that when there is no conservative religious interest group and all other predictors such as salience are set to average/default values, conservative majorities are much more likely to obtain their desired policy (which may in part simply reflect a status quo bias).
Having shifted our lens from responsiveness to congruence, we now find some slight evidence that institutions matter. Higher legislative professionalization has a moderate effect on congruence, shown in panel B, that approaches significance (at 90%). Using an index model, counting congruent policies within each state, professionalization does have a significant effect: the difference between low and high professionalization is on the order of one additional congruent policy (out of eight, with a mean of 4.9).
Elected courts and direct democracy do not have statistically significant effects on congruence (and that of courts is incorrectly signed).Footnote 15 If we run separate and simplified congruence models for each policy (not shown), the estimated effect of having elected courts is usually in the wrong direction (it is significant and in the wrong direction in the congruence index model). However, it can have a significant positive effect on congruence for same-sex marriage, depending on how many additional predictors are included. At most, this is limited evidence of such an effect.
Is Federalism Welfare Improving? One question that motivated this article was whether federalism, that is, decentralized decision making, produces welfare improvements over uniform national policies. Because we find strong responsiveness to state-level opinion, federalism seems to be working well, but there is still a great deal of policy incongruence. Does federalism truly lead to more congruence than nationally imposed policy would? How congruent is national policy with state opinion majorities? Across all eight policy areas, 62% of the state-level policies are congruent. If we exclude adoption policy, in that no provision exists at the federal level one way or the other regarding second-parent adoption, congruence occurs in 58% of the state-level policies. Suppose current national policy preempted state policies—then congruence would be reduced to 26%.Footnote 16 By this metric, federalism is welfare improving for state majorities.
Despite what Madison might have expected, it is even welfare improving for gays and lesbians (perhaps better than federalism was for the rights of African Americans). This finding corresponds nicely to Justice Brennan's view that “one of the strengths of our federal system is that it provides a double source of protection for the rights our our citizens (Reference Brennan1977, 503).” National policy has indeed been more resistant to progay opinion than state-set policy. Indeed, federal policy (again excluding adoption) is only congruent with national majorities in one of seven issues. This suggests that the federal government has been worse at translating majority opinion into policy than the state governments.
There are clear welfare-improving actions the federal government could take—a national policy protecting gays and lesbians from discrimination in employment and housing, a protection supported by opinion majorities in all but two states, would increase congruence with state majorities from 62% to 75%. In fact, if each policy were set by national majority opinion, then congruence with state majorities would be 84% (still short of the 100% if state-by-state majorities won).
A Comment on “Reverse” Causality
As Erikson, Wright, and McIver note, “conceivably it is the policy tendency of the state that drives public preferences rather than the other way around” (1993, 88). In this context, perhaps public support for progay policies rises after the exposure to the policy itself. Although we acknowledge the general problems of assessing causality in responsiveness research, we offer four brief responses. First, Erikson, Wright, and McIver themselves find no such effect. Second, as they argue, there are strong theoretical reasons to suppose that opinion affects policy and the choices of policy makers—would we expect a New York legislator who was moved to the Alabama state house to continue to vote the way he did in New York?—but at best limited theoretical reasons to think that people simply adopt the preferences that match their state's policy.
Third, demographic characteristics, which are (relatively) fixed by state, explain a significant amount of the variation in support for progay policies. This is demonstrated elsewhere in the political science literature (e.g., Haider-Markel and Kaufman Reference Haider-Markel, Kaufman and Cohen2006) as well as by our individual response models. We inspected the state random effects—these are the intercept shifts for each individual state beyond the effects of demographics. For some policies, there is effectively zero residual state-level variation after we control for demographics and region. Therefore, it is highly unlikely that having a progay policy is causing higher progay opinion (state-level effects would have to be large enough to shift national correlations between demographics and opinion). Even though small residual state variation exists for other policies, demographics still explain much variation in opinion, so policy adoption can still only have a relatively small effect on state estimates by affecting intercept shifts or national correlations. Moreover, if having the progay policy caused higher opinion, then having the policy would be correlated with positive intercept shifts (higher state opinion after controlling for demographic and regional effects). There was no such systematic relationship.
Finally, for civil unions and hate crimes, we have sufficient polling data before policy adoption to generate estimates that cannot have been influenced by respondents’ exposure to the policy. (For hate crimes, we dropped the two states that had already adopted hate crimes protection.) We then retested the relationship between these estimates and policy adoption. The effects of policy-specific opinion were robust, remaining statistically and substantively similar.
CONCLUSION
This article is one salvo in larger debates on the effectiveness of democratic institutions, on the merits of federalism, and on the relative roles of ideology and opinion in policy making. We conclude, in agreement with Erikson, Wright, and McIver, “state political structures appear to do a good job in delivering more liberal policies to more liberal states and more conservative policies to more conservative states” (1993, 95). We move beyond their seminal work by demonstrating responsiveness in the arena of gay rights policies and identifying factors that profoundly shape the relationship between opinion and policy adoption. Indeed, we find a deeper form of responsiveness to policy-specific opinion and not only ideology. Policy is responsive to opinion even controlling for voter ideology, the ideology of elected officials, and the interest group and issue environment. Furthermore, policy-specific opinion generally has the largest substantive impact on policy.
Still, some of our findings do raise concerns for democratic theory. We observe that the strength of the relationship between opinion and policy varies significantly across issues. And, despite responsiveness to opinion, majorities certainly do not always get their way. Some policies consistently reflect opinion majorities; for others, even clear supermajority support seems insufficient for policy adoption. This is most true for hate crime laws and policies that address marketplace equality (e.g., employment, housing protections).
Interestingly, most noncongruence is in the conservative direction. Majority will is not trumped by progay elites—rather, opinion and policy are disconnected in a way that works against the interests of gays and lesbians. In other words, we do not find any evidence suggesting a consistent progay bias in policy making, as is often argued by opponents of gay rights. Nor is there evidence that governmental elites override conservative opinion majorities (although government ideology does independently affect policy where liberal majorities exist). Furthermore, we do not find tyranny of local majorities, in which antigay majorities trump minority rights. For adoption, marriage, and civil unions, conservative state majorities can win out. But for hate crimes, health benefits, housing protection, and job protection, there is no tyranny of the majority blocking minority rights. Indeed, here, the majority seems to favor these civil rights protections. A bias toward the status quo cannot alone explain these results; the most glaring instances of incongruence are policies, job, and housing protections that have been debated in the states since the 1970s and for which progay majorities are not a new phenomenon. It may not be surprising that minority rights suffer when the majority is opposed to them—but our results show that representative institutions do a poor job protecting minority rights even when the public supports the prominority position.
Why might this be so? Democratic performance depends on context. Responsiveness and congruence are high for salient policies, but when policies are less salient, voters are less likely to get their way. The clearer the signal sent to policy makers, due to a larger opinion majority or higher salience, the more likely is congruence. When signals are less clear, there is a troubling amount of incongruence. To be sure, voter ideology still has an impact; however, as a second-best substitute for true policy preferences, this only goes so far to rectify shortfalls in majoritarian control.
It is also notable that the preferences of religious conservatives are “overrepresented.” Their share of the population shapes policy even beyond directly affecting public opinion and the composition of state governments. Powerful conservative religious interest groups also strongly affect gay rights policy at the expense of majoritarian congruence.
Despite the hopes of political engineers, the “shortfalls” in majoritarian congruence that we find are not so easily fixed. There is little evidence that the institutions studied herein will do so. However, it is also true that gay and lesbian rights are not particularly disadvantaged in states with majoritarian institutions: having elected courts or direct democracy does not significantly affect the adoption of gay rights policy one way or the other. The attention paid in the discourse surrounding gay rights to the role of state political institutions in hindering or advancing the gay rights movement may be misplaced. There is some evidence that legislative professionalization might have a small to moderate effect on congruence (although we do not find an effect on responsiveness).
For gay rights groups, our findings suggest that opinion and salience should be considered strategically. The higher policy salience, the more important is shifting policy-specific opinion. And the higher public support, the more important it is to increase attention to the policy debate. Although it has been argued that keeping the scope of conflict small and lobbying discretely is the most likely path to success (e.g., Haider-Markel and Maier Reference Haider-Markel and Meier1996), this may not be true for gays and lesbians. There are also “cheap” gains to be had in that adoption of employment and housing protection would actually have majoritarian support in almost all states. Employment and housing protection have received far less attention, perhaps because there is such widespread agreement. Ironically, then, the lack of disagreement and hence attention might have yielded policy not matching opinion majorities, given our salience results. It does not seem particularly fruitful to worry about institutional reform. One would also want to consider Rosenberg's (Reference Rosenberg2008) finding that seeking such rights in the courts is not likely to be successful. However, if bringing suit increases salience, there might be indirect effects on responsiveness.
Moving from politics to political science, this study has demonstrated the value of estimating policy-specific opinion. Policy-specific analysis can thus be an important and useful complement to aggregate-level analysis, in that it allowed us to study over- and underresponsiveness, to study congruence, to explain variation across policies and within states, to address the causality-versus-correlation debate, and to disentangle influences on policy. Future studies of the opinion-policy linkage might be remiss if they ignore policy-specific opinion, particularly if studying issues with high salience. Furthermore, although we studied trade-offs in responsiveness given salience in the context of gay rights issues, it might be fruitful to extend this approach to other issues. Next, it remains to be seen whether the lack of institutional effects we found herein is unique to this context and whether a different set of policies might show greater effects. A final substantive question for the future is whether the determinants of responsiveness and congruence in gay rights policy are similar to those that explain state-level variation in the rights of African Americans before these policies were trumped by federal legislation in the 1960s.
APPENDIX: ESTIMATING POLICY-SPECIFIC OPINION
To estimate the determinants of individual-level opinion, we gathered 41 national polls from the Roper Center's iPoll archive that contain questions on gay policy issues, dating from 1999 through 2008, yielding approximately 80,000 responses divided among the various policies. The polls are random national samples conducted by Gallup, Pew, ABC News, CBS News, AP, Kaiser, and Newsweek. We then combined these polls into a single internally consistent data set. For each respondent, we have sex, race (black, Hispanic, or white and other), one of four age categories (18–29, 30–44, 45–64, and 65+), and one of four education categories (less than a high school education, high school graduate, some college, and college graduate). Race and gender are combined to form six possible categories (from male-white to female-Hispanic). State and region are included (Washington, DC, as a separate “state” and separate region, along with Northeast, Midwest, South, and West). For each state, we have the percent of evangelical Protestants and Mormons (American Religion Data Archive 1990) and the Democratic presidential election share in 2004.
The policy question answers are our dependent variables in the individual response model, coded 1 for progay support and 0 for all others (a negative response, “don't know,” or “refused”). This captures positive support among all respondents, not simply those expressing an opinion. There are, of course, slight variations across polls in question wording and ordering (although each polling firm tends to use the same wording over time). We control for average differences across polls (firms and years) in the model by making the poll itself another grouping variable.Footnote 17
We run a separate model for each policy question. We use a multilevel logistic regression model, estimated using the GLMER (“generalized linear mixed effects in R”) function (Bates Reference Bates2005). For data with hierarchical structure (e.g., individuals within states within regions), multilevel modeling is generally an improvement over classical regression. Rather than using “fixed” (or “unmodeled”) effects, the model uses “random” (or “modeled”) effects, at least for some predictors. The effects within a grouping of variables (say, state-level effects) are related to each other by their grouping structure and thus are partially pooled toward the group mean, with greater pooling when group-level variance is small and for less-populated groups. The degree of pooling within the grouping emerges from the data endogenously. This is equivalent to assuming errors are correlated within a grouping structure. (See Gelman and Hill Reference Gelman and Hill2007, 244–8, 254–8, 262–5.)
We model the response of individual i, with indexes j, k, l, m, s, and p for race-gender combination, age category, education category, region, state, and poll, respectively, and including an age–education interaction.Footnote 18 There is more than one way to write such a model (see Gelman and Hill Reference Gelman and Hill2007), but the following seems the most intuitive (omitting error terms):

The terms after the intercept are modeled effects for the various groups of respondents:
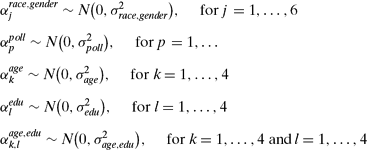
That is, each is modeled as drawn from a normal distribution with mean zero and endogenous variance. The state effects are in turn modeled as a function of the region into which the state falls and the state's conservative religious percentage and Democratic 2004 presidential vote share (group-level predictors reduce unexplained group-level variation, leading to more precise estimation; Gelman and Hill Reference Gelman and Hill2007, 271), and the region variable is, in turn, another modeled effect:
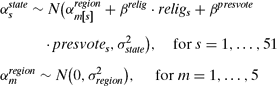
We calculate predicted probabilities of policy support for each demographic-geographic type. Because we controlled for poll effects, we must choose a specific poll coefficient when generating these predicted values using the inverse logit. We use the latest poll effect where possible.
There are 4,896 possible combinations of demographic and state values (96 within each state), ranging from “White,” “Male,” “Age 18–29,” “Not high school graduate,” in “Alabama,” to “Hispanic,” “Female,” “Age 65+,” “College degree or more,” in “Wyoming.” For any specific cell j, specifying a set of individual demographic and geographic values, the results allow us to make a prediction of progay support, θj. Specifically, θj is the inverse logit given the relevant predictors and their estimated coefficients based on equation (1).
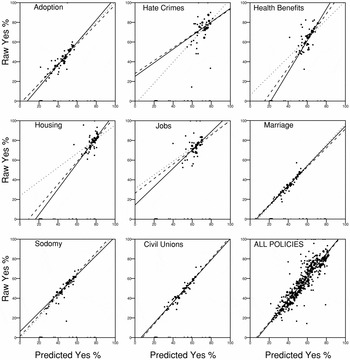
We next poststratify by population percentages; the prediction in each cell needs to be weighted by the actual population frequency of that cell, Nj. For each state, we then can calculate the percentage who support the policy, aggregating over each cell j in state 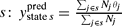 . We calculate the necessary population frequencies using IPUMS “5-Percent Public Use Microdata Sample” from the 2000 census, which has demographic information for 5% of each state's voting-age population. See Table 1 and Figure 4 for estimates and comparisons to raw data.
Plots of Raw Percentages vs. MRP Estimates by State




Comments
No Comments have been published for this article.