Dialectal features are acquired within the peer group and not by transmission from parent to child (Weinreich, Labov, & Herzog, Reference Weinreich, Labov and Herzog1968:184–185). A consequence of peer group transmission is that the parents’ origin does not always have the biggest impact on the formation of a child's linguistic system; it might not even be the parents’ language that turns out to be the child's strongest one. This difference in language proficiency between parent and child is common among immigrant children who grow up in a country where the majority language is different than the main language used by their parents. This raises the question of whether (and how) dialectal features spread in segregated areas where a large part of the population does not have a connection to the local majority dialect. At the same time, we might expect that the younger part of the population in these areas will have a connection to more leveled variants of Swedish due to interaction with mainstream institutions such as schools and mainstream media.
Labov (Reference Labov2014:16) argued that the reason we often find variation between different ethnic groups in the United States can be explained by the “amount of communication across racial lines” echoing Bloomfield's (Reference Bloomfield1933:46) principle of density (of communication), which argues that the more contact there is between speakers the more similar their language will be. Labov's (Reference Labov2014) study is by no means the only one that connects differences between speakers with segregation or density of communication: Boberg (Reference Boberg2004) explained the differences he found in Montreal and judged to be typical of different ethnic groups stemmed from residential segregation and the minority status of English; Cameron (Reference Cameron2010) showed that, when the social distance increased between boys and girls as they grew older, they started to diverge in their speech; Oushiro (Reference Oushiro2016) argued that lectal cohesion was a function of the density of communication among peers; and Khon (Reference Khon, Reaser, Wilbanks, Wojcik and Wolfram2018) found that spatial segregation influenced Afro-American informants in European American sound changes.
In the case of Gothenburg, Sweden, we do not find segregated ethnic groups clustering together into ethnic enclaves in the way that is common in North America. In Sweden, it is not possible based on official statistics to know how people define themselves in terms of ethnicity, because these statistics never record ethnicity, only country of origin (birthplace).Footnote 1 In cities such as Gothenburg, we find a mixture of people originating from different countries in all neighborhoods, where the most important difference between the neighborhoods is the proportion of people with a Swedish background. Some neighborhoods have a high proportion of Swedish background residents; other neighborhoods have extremely low proportions. The segregation is to a large degree predicted by a combination of socioeconomic status, educational level, and foreign background (FB), which tend to covary, such that the lower the socioeconomic status and educational level, the fewer people with a Swedish background who live in the area. This tendency is clear in the northeastern suburbs (NE), where patterns of settlement differ from the rest of Gothenburg (Andersson, Bråmå, & Hogdal, Reference Andersson, Bråmå and Hogdal2009). These suburbs are characterized by major in-migration of people (often with FB) from other parts of the country and from abroad, while at the same time people with a Swedish background (and to some extent those with a FB who are upwardly mobile) move away to other neighborhoods. Andersson et al. (Reference Andersson, Bråmå and Hogdal2009) showed that this pattern is different from the rest of Gothenburg, where people are more prone to move between different areas in Gothenburg, though not into the NE, or to the neighboring middle-class suburbs in other municipalities outside of the city. The patterns of settlement have created a situation whereby the NE are segregated, not because people have chosen to live or move there, but rather because upwardly mobile people have moved away (Andersson et al., Reference Andersson, Bråmå and Hogdal2009). In such a case, we can expect that the amount of communication between those who remain in the suburb and those who leave it will be relatively low, and the question is raised whether dialectal features from the variety typical of the rest of the city are less influential in the speech of those who remain in the suburb.
How do these demographics affect the linguistic situation in the city? If the principle of density is correct, we might expect differences in the way people speak to be related to where they live and not just to their Swedish or FB. To test this hypothesis, I investigated how the vowels of Gothenburg youth are produced and distributed in the linguistic system and whether there is a difference that can be captured by considering residence in the NE. Three questions are therefore addressed in this paper:
1. How are the vowels structured among young Gothenburg speakers?
2. Does housing segregation influence the structuring of the vowels and, if so, how?
3. Is the variation in vowel pronunciation connected to traditional dialectal features and, if so, in what way?
Research on language variation in multilingual urban areas of Sweden has focused on the distribution of single variables, such as word order (Ganuza, Reference Ganuza2008; Kotsinas, Reference Kotsinas, Androutsopoulos and Scholz1998), discourse particles (Svensson, Reference Svensson2009), and pronouns (Tingsell, Reference Tingsell2007). In this paper, I consider vowel variation that displays coherence (Guy, Reference Guy2013:64; Wiese & Rehbein, Reference Wiese and Rehbein2016:46): that is, in general terms, variables that are connected in a way that implies systematic covariation and where the distribution of one variable can predict the distribution of the other.
GOTHENBURG
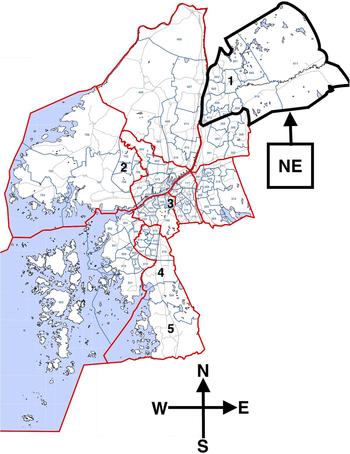
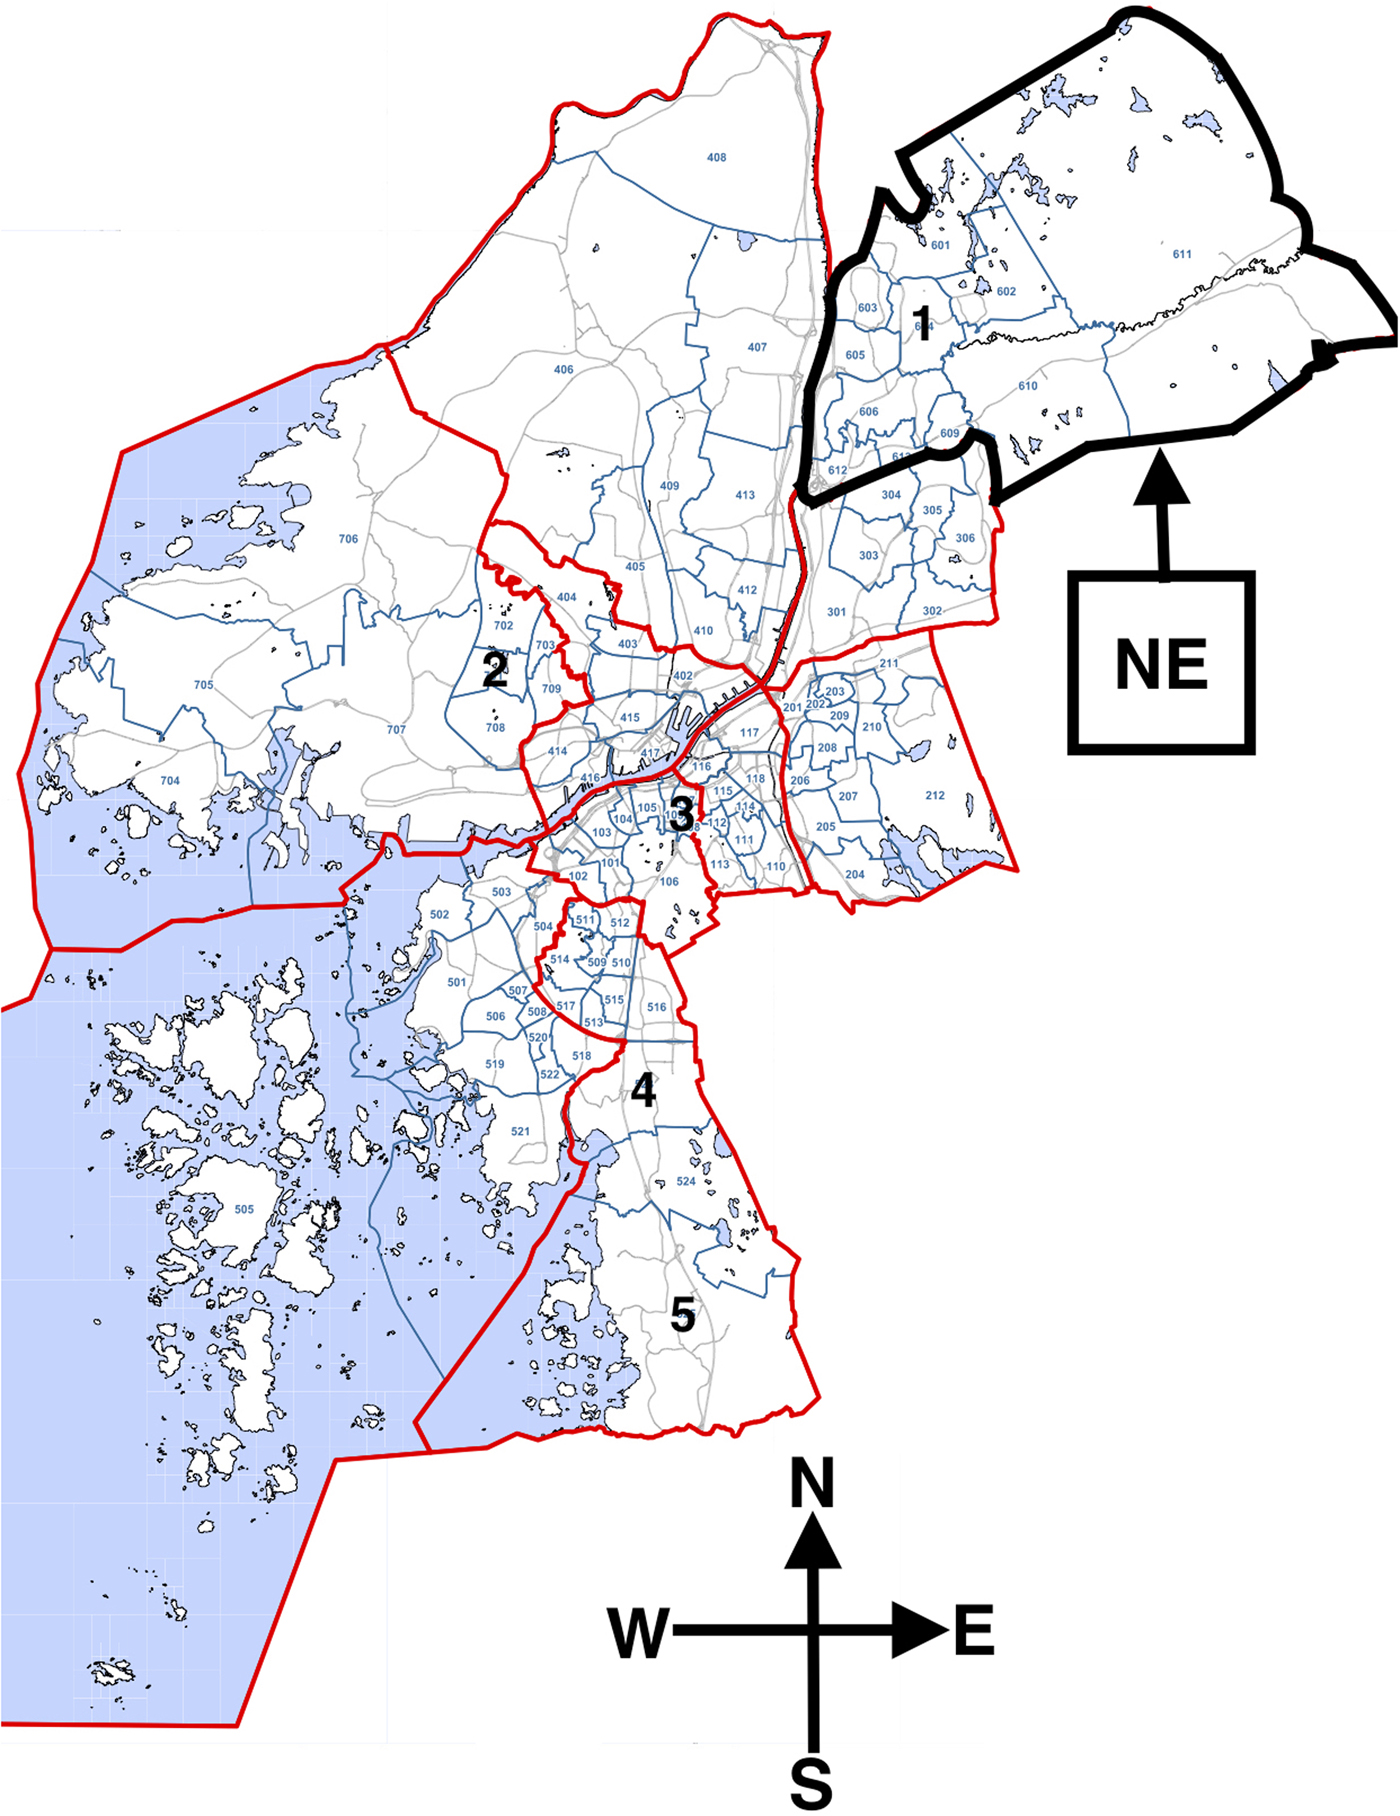
Gothenburg has since the beginning of the 20th century seen a rapid increase in population, from 152,172 inhabitants in 1900 (Kungliga statistiska centralbyrån, 1900) to 443,843 in 1960, and surpassing 500,000 inhabitants at the turn of the millennium. At 556,640 inhabitants in 2016, Gothenburg is now the second largest city in Sweden (Statistik och Analys stadsledningskontoret Göteborgs Stad, 2017). The city has always attracted people of different linguistic and dialectal backgrounds since its founding in 1620. People first came mainly from adjacent provinces (Bohuslän, Västergötland, and Halland) and nearby countries such as Holland and Germany. However, there was an increase in the city's diversity starting in the 1970s such that, by 2015, about 33% of the inhabitants had FB (Statistik och Analys stadsledningskontoret Göteborgs Stad, 2017). For a long time, immigration mainly came from other Nordic countries (in particular Finland) or continental Europe, but this has changed since 1980. We now find people originating from a broader range of countries: from Europe (especially the Balkans), Africa (especially Ethiopia and Somalia), and Asia (especially the Middle East), but the geographic distribution of people with different backgrounds in the city is skewed. As an example of this skewedness we can look at neighborhoods such as Angereds Centrum and Norra Biskopsgården (neighborhoods 1 and 2 in Figure 1), where the population with FB is 77% to 86% and compare this with central areas such as Haga and Annedal (neighborhood 3), where the figures are reversed and 77% to 82% have a Swedish background. In Haga, these numbers mean that 23% have FBs, which is actually not too far from the average FB for the entire city, but somewhat more than Sweden as a whole, with 18% of persons with FB (Statistics Sweden, 2017). Looking to the most segregated areas of the city, we find Billdal and Askim (southwestern suburbs, neighborhoods 4 and 5) where 92% to 93% have a Swedish background (Statistik och Analys stadsledningskontoret Göteborgs Stad, 2017). However, the difference between the NE and the southwestern suburb comes down to the opportunity to choose: only those who can afford to buy a large house can move to the southwestern suburbs, while available northeast accommodation is cheaper, provided by municipal housing authorities or more affordable to those with a lower income (Andersson et al., Reference Andersson, Bråmå and Hogdal2009).
Map of Gothenburg showing major residential areas (thick red boundaries) and smaller neighborhoods (thin blue boundaries): Angereds Centrum (neighborhood 1), Norra Biskopsgården (neighborhood 2), Haga and Annedal (neighborhood 3), Billdal (neighborhood 4), and Askim (neighborhood 5).
Although Gothenburg has always been a place where dialects and languages meet, there is also a distinct dialect associated with the city, which differs from the adjacent dialects. The older traditional dialect was characterized as including many features that separated it from descriptions of standard Swedish, such as a three-way division of grammatical gender (e.g., masculine en stol, stolen ‘a chair’, ‘the chair’; feminine e dörr, dörra ‘a door’, ‘the door’; neuter ett bord, bordet, ‘a table’, ‘the table’—today only the non-neuter and neuter remain), a different form of the masculine pronoun in singular (e.g., jag såg'en ‘I saw him’ instead of the standard jag såg honom), as well as considerable lexical and phonological variation regarding vowels, consonants, and prosody (Holmberg, Reference Holmberg1976). The speech of people born in the 1980s has lost most of the features of the traditional Gothenburg dialect, except for a few phonological and lexical features strongly associated with Gothenburg (Andersson, Reference Andersson, Nelson, Larsson and Lööf2006).
LONG VOWELS IN GOTHENBURG SWEDISH
According to the description of standard Swedish, the vowel system is composed of nine long vowels: six front, /i:, y:, e:, ε:, ø:, ʉ:/, and three back, /u:, o:, ɑ:/. Figure 2 shows Riad's (Reference Riad2014) description of the standard Swedish vowel system. Note that /ε:/ and /ø:/ have a more open realization ([æ:] and [œ:], respectively) before rhotic consonants. We can also see in Figure 2 that /ø:/, the open-mid, front, rounded vowel, is closer to the open-mid vowel /ε:/ and might more accurately be described as an open front rounded vowel. Riad characterized the close central rounded vowel /ʉ:/ as [ʉ̞:]. Acoustically it shares properties with the front vowel /y:/, but it is produced with a narrow labialization, which is more similar to /u:/ than to /y:/, and is described as a close-mid, front vowel in Figure 2.
The long-stressed vowels in the description of standard Swedish (Riad, Reference Riad2014:19).

For the vowels of the Gothenburg dialect, Björseth (Reference Björseth1957:2–3) distinguished between two local varieties, which he calls “Gothenburg local standard” (GLS) and “Gothenburg dialect” (GD).Footnote 2 He characterized typical speakers of GLS as middle class and speakers of GD as lower class.
One of the most salient vowels in the Gothenburg dialect is /i:/, called Gothenburg-i (“Göteborgs-I”) by Björseth (Reference Björseth1957), who described it as produced with a slight buzzing sound. Even though the buzzed or “damped” /i:/ has been observed in other dialects of Swedish (e.g., Närke and neighboring Bohuslän [Elert, Reference Elert2000:44]), Björseth argued that this salient feature in the GD is not the result of dialect contact but rather of a general tendency for the vowels in GD and GLS to be peripheral. In contrast, Elert (Reference Elert2000) argued that the Gothenburg-i is basically the same as that in Närke and Bohuslän. He described the vowel as auditorily similar to a closed, central, unrounded vowel ([ɨ:]), but he argued that it should be described as being produced with a slightly retracted and lowered tongue body with the apex in close proximity to the alveolum ([iz:]). The best evidence of place of articulation (albeit from a small sample) is an articulographic study by Schötz, Frid, Löfqvist, Gustafsson, & Eklund (Reference Schötz, Frid, Löfqvist, Gustafsson, Eklund and Bimbot2013), who showed that speakers from Gothenburg had a lower retracted tongue body and higher tongue tip and who described /i:/ as a centralized vowel.
Björseth (Reference Björseth1957) noted that Gothenburg-i is most common among female speakers and without social stratification in this “group” and among men who aspire to be more well-spoken (e.g., priests and teachers). In other words, Gothenburg-i is seen as a feature associated with high status and overt prestige. According to Holmberg (Reference Holmberg1976), there is a sharp gender division in the production of the Gothenburg-i among the “more dialectal” speakers (i.e., the lower classes), such that the variant is present only in the speech of girls. However, Andersson (Reference Andersson, Nelson, Larsson and Lööf2006) described Gothenburg-i as a feature that has gained ground among the dialect-speaking youth (both women and men) born in the late 1970s and early 1980s, that is, from being a feature used mostly by speakers who did not speak as much dialect, it is now part of the dialect. Like /i:/, its rounded counterpart /y:/ is described as a centralized vowel used by the same speaker groups that have the Gothenburg-i (Björseth, Reference Björseth1957; Elert, Reference Elert2000; Holmberg, Reference Holmberg1976), although Holmberg (Reference Holmberg1976) noted a less prominent tendency for buzzing.
The vowel /ε:/ in GD is described as relatively closed, close to but not merged with /e:/ (Björseth, Reference Björseth1957). The realization of /ε:/ before /r/ in GD is also described as slightly more closed than in other varieties of Swedish, while GLS has incorporated the allophonic rule /ε:/ → [æ:] / _ /r/. The closed production of /ε:/ is rare today, and Andersson (Reference Andersson, Nelson, Larsson and Lööf2006) speculated that young people born in 1980 and later are moving in the direction of a more open realization of /ε:/, closer to [æ:]. In other words, they are dropping the allophonic rule in favor of an open pronunciation in all contexts, not just before /r/. However, Gross, Boyd, Leinonen, and Walker's (Reference Gross, Boyd, Leinonen and Walker2016) analysis of recordings made in 2002 showed that the allophonic rule was still used by Gothenburg youth with Swedish-born mothers and that boys in this group had a tendency to a more closed pronunciation in both contexts, although the allophones were kept separate. They also found that the group with the highest degree of variation in the realization of /ε:/ were girls with Swedish-born mothers. These results might indicate a change toward a more open form, although some girls with Swedish-born mothers still kept the allophones apart. This sound change is a general tendency in a large part of the country, especially around Gothenburg and Stockholm (Leinonen, Reference Leinonen2010). Gross et al. (Reference Gross, Boyd, Leinonen and Walker2016) showed that the adaptation of this sound change was most obvious in the speech of youth with foreign-born mothers, where the open [æ:] production was prevalent and the allophonic rule was more rarely applied (Gross et al., Reference Gross, Boyd, Leinonen and Walker2016).
Just as /i:/ and /y:/ are grouped together, /ε:/ and /ø:/ share many articulatory and social characteristics. In older forms of the Gothenburg dialect, /ø:/ had a more closed pronunciation, which seems to be the case for the prerhotic allophone as well (Björseth, Reference Björseth1957). A more recent impressionistic observation points to a change of /ø:/ among younger speakers in the same direction as for the /ε:/ vowel, which suggests that the open non-prerhotic allophone is gaining ground (Andersson, Reference Andersson, Nelson, Larsson and Lööf2006).
Apart from the reports on the four above-mentioned vowels, the descriptions do not reveal any major difference from the Swedish standard language description more than minor variation connected to lexical features. From this lack of reports, I assume that /e:, ʉ:, ɑ:, o:, u:/ are not in any radical way affecting the system as a whole as compared to the standard description.
To summarize, earlier descriptions of Gothenburg vowels provide some clues as to where we might expect variation or differences from standard Swedish. Especially four vowels /i:, y:, ε:, ø:/ stand out, in the sense that much more is written about these. There appear to be two reasons for this; the first is that the realizations differ from that of the standard description, and the second is that there is social variation connected to these vowels. The vowel /i:/ has received the most attention, and the fact that it has a nickname, Gothenburg-i, shows a certain awareness of this variable. The opinions of the quality of the different variants are divided between those claiming it is fronted (Björseth, Reference Björseth1957; Holmberg, Reference Holmberg1976) and those claiming it is more centralized (Elert, Reference Elert2000; Schötz et al., Reference Schötz, Frid, Löfqvist, Gustafsson, Eklund and Bimbot2013), although they agree on its buzzing quality. There are also indications of a change (Andersson, Reference Andersson, Nelson, Larsson and Lööf2006) where the buzzing form is becoming the dominant feature in the dialect. We cannot say much about the actual character of this change, since most of the reports on /i:/ are impressionistic (apart from Schötz et al., Reference Schötz, Frid, Löfqvist, Gustafsson, Eklund and Bimbot2013), but the different opinions on the pronunciation of /i:/ could be explained by /i:/ having become more centralized. The reports on /y:/ are sparser, but they indicate that /i:/ and /y:/ exhibit coherence.
The /ε:/ vowel is probably the best described of all the vowels (Gross et al., Reference Gross, Boyd, Leinonen and Walker2016). It seems as though there has been a change from a closed position to a more open one, but there is also evidence of social differentiation, where adolescents with FBs have the most open vowels and do not make a distinction between the allophones, whereas there is a division based on gender in the group with Swedish-born parents such that girls tend to orient toward the standard dialect and boys toward the more traditional dialect. There are fewer reports for /ø:/ but, just as for /i:/ and /y:/, there seems to be coherence between /ε:/ and /ø:/ with regard to allophonic rules and how they are changing. However, the coherence between /ε:/ and /ø:/ is not just a phenomenon in the dialect but a more widespread phenomenon in the central Swedish dialect area.
If this interpretation of coherence between /i:/-/y:/ and /ε:/-/ø:/ is to be taken seriously, we should assume that, for those people who interact with each other and acquire some kind of dialectal speech, we will find that these vowels have a similar distribution. Oushiro (Reference Oushiro2016) showed that lectal cohesion is a function of density of communication, that is, the more interaction there is between speakers of a group, the stronger the lectal cohesion, and the other way around: the less interaction, the weaker the lectal cohesion. If this is the case, then we might expect two things: that the dialectal features might not cluster together if you live in an area where the number of dialectal speakers is low, and that the coherence between the vowels will be weaker.
THE SPRÅKBRUK I STOCKHOLM OCH GOTEBORG CORPUS
The data analyzed in this paper were drawn from the corpus Språkbruk i Stockholm och Göteborg (Language Use in Stockholm and Gothenburg) which is a corpus of young urban speech in Stockholm and Gothenburg collected by Julia Forsberg and myself in 2014 at two upper secondary schools in each of the two cities. The schools were chosen so that one was located in a suburb and one in the center of the city and to reflect the demographical differences that exist between different neighborhoods in the cities with regard to socioeconomic status, educational background, and parents’ birthplace. The age of the informants ranged between 16 and 20, with an average of 17.5. To be included in the study, each person had to have attended school in the city since at least the third grade (at the age of eight or nine).
All of the informants were recorded on two occasions: first, an interview was conducted by the researcher to collect background data on the informants and, then, informants carried out a map-task with a friend. The interview was intended to be carried out prior to the map-task for two reasons. First, we wanted the informants to do the map-task together with a friend of their own choice, which was done by asking the informant at the end of the interview to choose someone they wanted to work with and a time that suited them. Second, even though the researcher may always influence the recording situation to become more formal, this arrangement made it possible to let the informants acquaint themselves with one of the researchers who would record the interaction during the map-task, which we hoped would reduce the formality of the recording situation somewhat (Labov, Reference Labov1972:79).
In total, 111 informants were interviewed in the two cities: 59 informants in Stockholm and 52 informants in Gothenburg. We strove to get as even a distribution as possible with regard to gender and parents’ birthplace in all of the schools. However, in the suburban school in Gothenburg (HumeFootnote 3) 85% to 100% (depending on the program) of the pupils had FBs compared with the inner-city school (Descartes) where the figures are 12% to 34% (depending on the program), which made it impossible to get an even distribution of this factor in Hume. In this paper, I focus on data from the map-task recordings in Gothenburg. Ten informants in the current study were removed due to technical problems with the recordings, too low token production (because they participated in only one of the three map-tasks and had to leave for different reasons), or suspected speech impediments/colds, leaving 42 informants in the final analysis.
THE SAMPLE AS A REFLECTION OF SEGREGATION IN GOTHENBURG
As mentioned, the two schools were chosen to reflect the demographic differences that we find in Gothenburg. As no statistics are available on the socioeconomic status of inhabitants in specific residential areas, we can study the socioeconomic status of the informant's parents in the sample to illustrate the gap connected to the housing segregation in Gothenburg. While we keep in mind that the sample is not representative of Gothenburg as a whole, it gives us a sense of the situation in the NE. (In this paper, I consider as “northeastern suburbs” the residential areas within the major area with thicker boundaries in the northeastern area indicated with NE in Figure 1.) Worth underlining here is also that, in both groups of NE or non-NE, we find youths with foreign-born parents but only in the non-NE group do we find informants with two Swedish-born parents, as shown in Table 1. We find informants from both groups in both schools; in Descartes there are 5 NE informants and 19 non-NE informants, and in Hume there are 16 NE informants and 2 non-NE informants.
Informants with foreign-born, Swedish-born, or one of both parents, by neighborhood group (n = 42)

There have been many different proposals as to how to best divide a population into social groups (Savage, Devine, Cunningham, Taylor, Li, Hjellbrekke, Le Roux, Friedman, & Miles, Reference Savage, Devine, Cunningham, Taylor, Li, Hjellbrekke, Le Roux, Friedman and Miles2013). In this paper, I have chosen to use the classification of socioeconomic group (SEG) used by Statistics Sweden since the beginning of 1980 (Bengtsson, Börjesson, Gustavsson, & Hörnqvist, Reference Bengtsson, Börjesson, Gustavsson and Hörnqvist2012). The division into different categories can be described in four steps: employer versus employee, manual labor versus nonmanual labor, union affiliation (this separation is somewhat contradictory, however, since union affiliation in some cases correlates badly with the actual choice of union of the employee), and the number of years of education beyond compulsory school required to qualify for the job (Bengtsson et al., Reference Bengtsson, Börjesson, Gustavsson and Hörnqvist2012). By applying this division, we get a classification of socioeconomic groups in 12 different categories, along with an additional category “other” to classify people who do not work for various reasons. Because this classification system is based on four steps, the resulting categories cannot be easily ordered from lowest to highest.
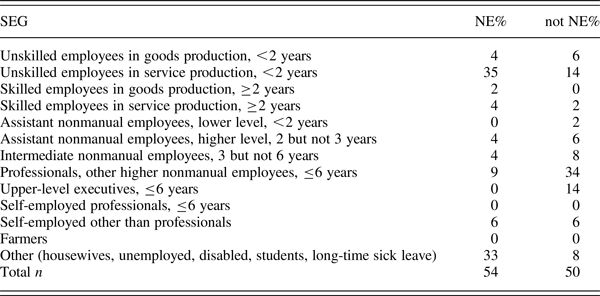
Table 2 shows a clear division between what SEG the parents belong to and whether they live in the NE suburbs or somewhere else in the city, In NE, 45% belong to the four lowest SEGs and 33% do not work. However, we have information about the parents’ previous work for the people who were on long-term sick leave or were unemployed, who would all fall into one of the two unskilled SEGs. For non-NE, 56% of parents belong to the three highest SEG categories. These numbers, together with the fact that the majority of the informants in Hume have FBs, illustrate how the segregation in Gothenburg is structured and distributed. Segregation in Gothenburg is thus not dependent on FB only, but rather on the combination of three social factors: ethnic background, low SEG, and limited education (Andersson et al., Reference Andersson, Bråmå and Hogdal2009). Or, framing it the other way: there are people of FB in most of the other areas of the city as well, but these tend to have a higher SEG status or educational background.
Informant parents (step-parents included) according to SEG, in the Swedish four-step system, by neighborhood group

RECORDINGS, ACOUSTIC ANALYSIS, AND NORMALIZATION
The interviews and map-tasks were recorded in quiet rooms in the two schools using Sennheiser HSP 4 EW-3 headsets connected to an M-Audio: ProFire 610 soundcard, using Audacity recording and editing software 2.1.2 (Audacity Team, 2014) to record each speaker on a separate channel. This recording system was used to capture the interaction without polluting the individual productions with overlapping speech.
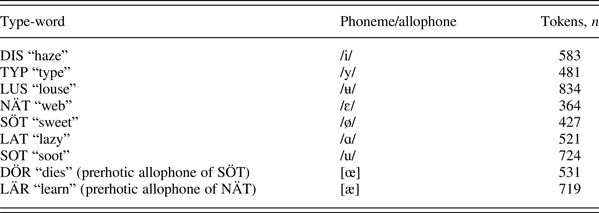
The recordings were segmented in Praat (Boersma & Weenink, Reference Boersma and Weenink2016), where the first boundary was placed at the start (zero amplitude in the oscillogram) of the second stable period of the vowel and the last boundary was placed at the end of the second to last stable period of the vowel (where the period reaches zero amplitude in the oscillogram). All vowels were coded for type-word, and an impressionistic transcription was carried out. The type-words, which will be used when reporting and discussing the results, are taken from the wordlist used in the SweDia 2000 project (Eriksson, Reference Eriksson and Henrichsen2004) and are presented in Table 3 with the associated phoneme or allophone.
Type-words and their corresponding phoneme/ allophone (n = 5184)

The acoustic analysis was performed by application of principal component analysis to a band-pass filteredFootnote 4 spectra (Plomp, Pols, & Van de Geer, Reference Plomp, Pols and Van de Geer1967). The two first components (PC1 and PC2) can be taken as equivalent to F1 and F2 and are thus the two most important articulatory components. This method was further developed by Jacobi (Reference Jacobi2009), who showed that, by applying band-pass filters (or Bark filters, because this was the defining scale), where the pass band had a bandwidth of 1 Bark, overlapped with −3 dB and with a cutoff point at 18 Bark, she could isolate the frequency range where we find the three first formants. The output from the Bark filter was then reduced to articulatory meaningful components with the aid of principal component analysis performed in R (version 3.4.2; R Core Team, 2017). The Jacobi (Reference Jacobi2009) method was chosen because it is more reliable when automated as compared to formant-based methods (i.e., linear predictive coding), which has a relatively high error rate and where hand corrections are necessary (Di Paolo, Yaeger-Dror, & Beckford Wassink, Reference Di Paolo, Yaeger-Dror, Beckford Wassink, Di Paolo and Yaeger-Dror2011; Jacobi, Reference Jacobi2009; Leinonen, Reference Leinonen2010). The PC values from the temporal midpoints of the vowels were then normalized with the Lobanov method using the R package vowels (Kendall & Thomas, Reference Kendall and Thomas2014). Because this normalization method assumes an even distribution of tokens, mean values of PC1 and PC2 were calculated for each vowel and speaker before normalization. The normalized mean values were then used in the analysis.
FB OR RESIDENTIAL AREA?
Research on language variation in multilingual urban areas has focused on ethnicity or the FB as a single factor (e.g., Ganuza, Reference Ganuza2008; Gross et al., Reference Gross, Boyd, Leinonen and Walker2016; Kotsinas, Reference Kotsinas1988, Reference Kotsinas, Androutsopoulos and Scholz1998). However, Andersson et al. (Reference Andersson, Bråmå and Hogdal2009) showed that FB and socioeconomic status intersect in these multilingual urban areas in Gothenburg. This intersection involving SEG, FB, and residential area raises the question of what factors should be chosen as independent variables when analyzing the vowel variation among youth in Gothenburg.
To explore how FB and socioeconomic status intersect and decide on the best way of grouping speakers, a bottom-up approach was used in the form K-mean clustering which is a nonhierarchical clustering method.Footnote 5 The K-mean algorithm aims to group n number of observations into k number of predefined clusters with as little error variation as possible (Hartigan & Wong, Reference Hartigan and Wong1979). In this study, the acoustic measurements from all the vowels were analyzed with the help of the K-mean clustering algorithm; the analysis was run in R (version 3.4.2; R Core Team, 2017) following the instructions of Kodali (Reference Kodali2015). There is no straightforward way of deciding on the number of clusters; for this reason, the algorithm was run with four different settings in two, three, four, and five clusters. The clusters were inspected with regard to FB and residential area. Apart from the setting with two clusters, all of the clusters showed similar distributions. However, the output from the run with four clusters was easiest to interpret, which is why this will be used in the following analysis.
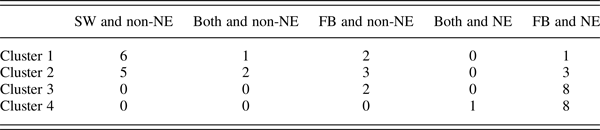
The four clusters are displayed in Table 4. The first and second clusters are dominated by informants that do not live in the NE; the only exceptions are two FB non-NE (in cluster 3) and four FB NE informants (one in cluster 1 and three in cluster 2). The third and the fourth clusters are dominated by the NE informants. The conclusion from this analysis is that residential area is a better predictor of vowel variation than FB, SEG, or educational background alone. It will capture the intersecting nature of SEG, education, and FB, which conflate in housing segregation. I will therefore use NE versus non-NE to operationalize the interaction of FB, social class, and residence in the upcoming tests. This grouping results in two equally large groups where 21 live in the NE and 21 in other parts of the city.
The distribution of the informants in the four clusters based on background and residential area (see note 1) (n = 42)

Note: SW, southwest.
RESULTS
To test whether there is a difference between those adolescents that have grown up in the NE and those from the other parts of Gothenburg, all informants were coded into one of the two categories NE and non-NE. The normalized mean values of each person's type vowel's PC1 and PC2 were then used as dependent variables and the categories NE and non-NE as independent variables in a t-test (i.e., nine vowels × two PC values per vowel), to a sum of 18 t-tests, testing the null hypothesis that there is no difference between the two groups when it comes to the pronunciation of the vowels.
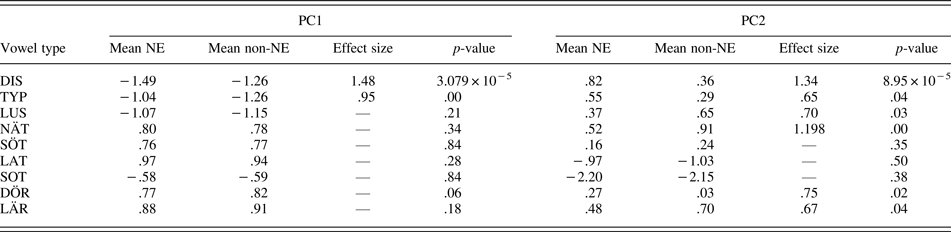
The first thing that we can notice in Table 5, which shows the results of the t-test, is that the two close fronted vowels DIS and TYP stand out as significantly different in both PC1 and PC2, indicating that they differ significantly in both fronting and height for the two speaker groups. However, the different effect sizes indicate that the difference in height and fronting between the two groups is bigger for DIS than for TYP.
Group means and p-values from the t-test of PC1 and PC2 as the dependent variable with NE versus non-NE suburbs as the independent variable

Note: The effect size (Cohen's d) is reported for the significant vowels, unit of mean values = z-scores. PC1, PC2, from principal component analysis of band-pass filtered spectra, are equivalent to F1 and F2.
Moving on to the closed central rounded LUS vowel, we find a significant difference in PC2 and an effect size of d = .70, which means there is a medium difference (i.e., approximately 43% overlap) in mean values for fronting but none in height between the two groups. Just as for the LUS vowel, there is no difference for the NÄT vowel in PC1 but a large difference in PC2 (e.g., the front back dimension). For the phonemic vowels SÖT, LAT, and SOT, there are no significant differences between the two speaker groups. However, the two prerhotic allophones DÖR and LÄR show significant differences in PC2. NE has a higher PC2 mean for DÖR, indicating that this vowel is somewhat more fronted than for non-NE, while the opposite is the case for LÄR: non-NE has a more fronted pronunciation than NE.
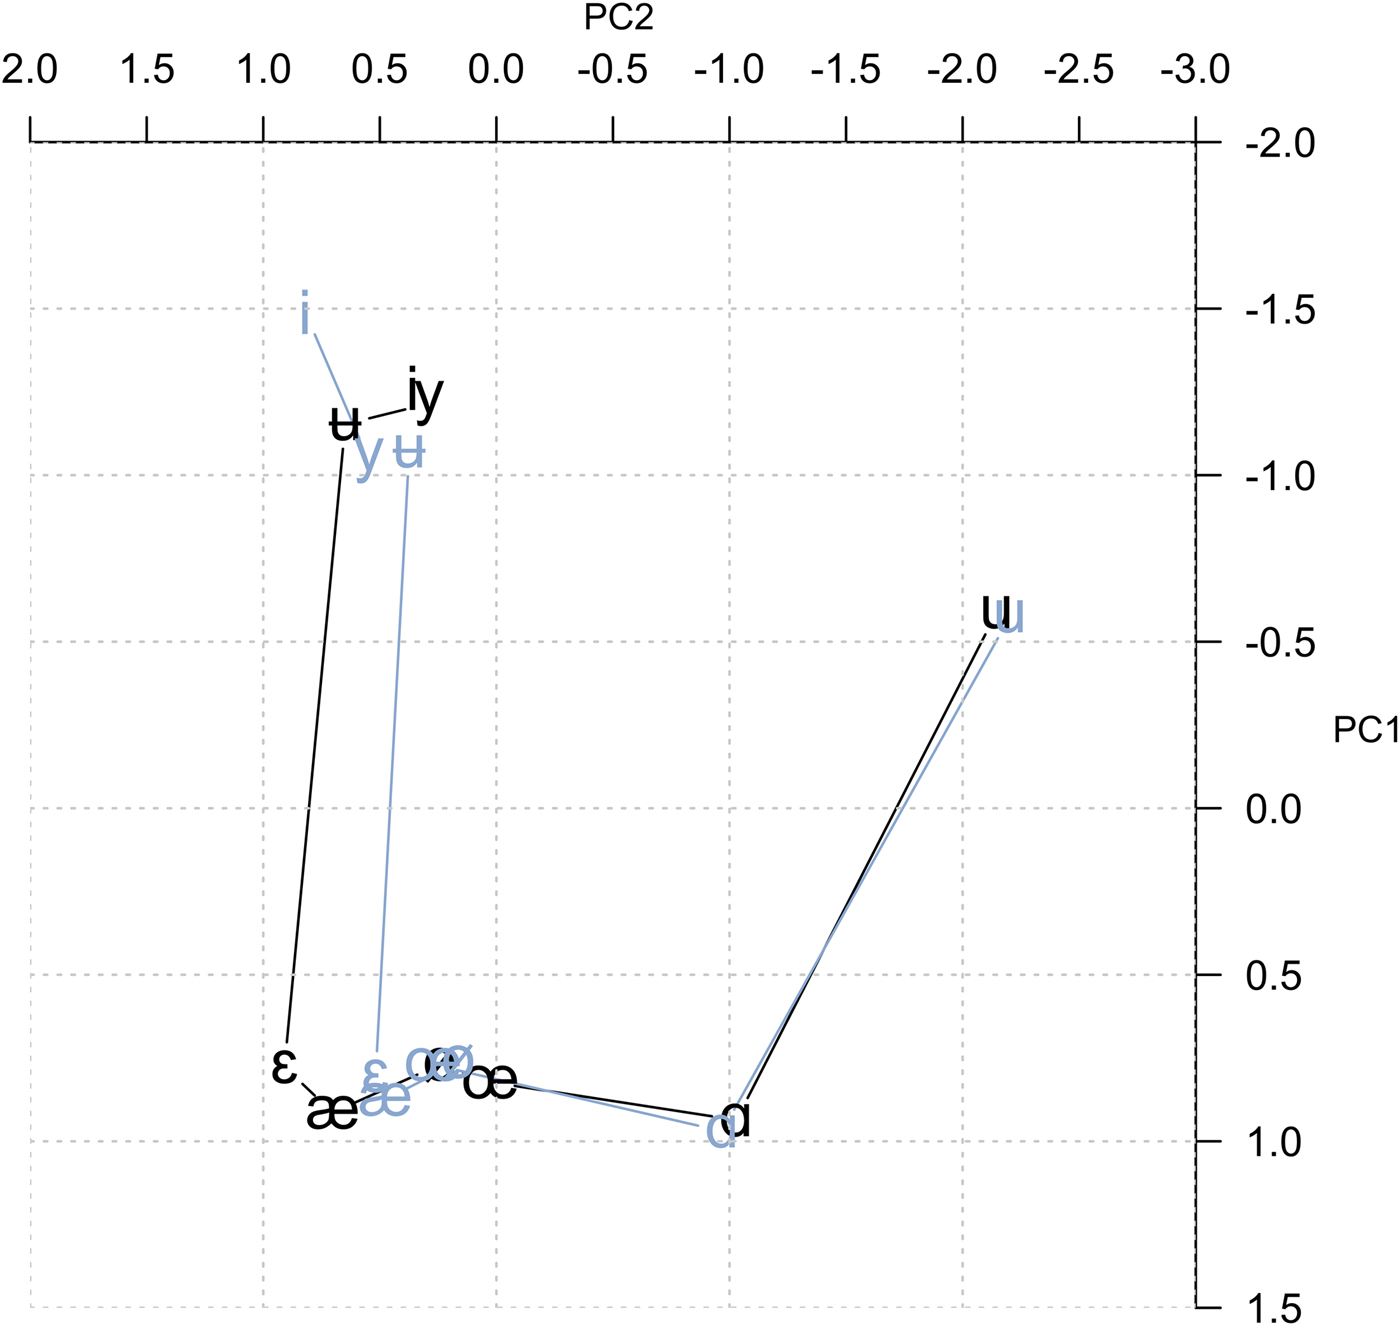
The mean values of the two groups’ vowels were plotted to get a clearer picture of the statistically significant variation, that is, one plot was made for the NE group and one for the non-NE group. Figure 3 plots the mean value of each type of vowel for the two groups (gray = NE, black = non-NE). As already noted in the statistical testing, the largest difference is found for the DIS (/i/) vowel, where the NE group has a much more fronted and closed DIS vowel than the non-NE group, which has a somewhat lowered and centralized production of this vowel. It is also clear from the plot that there is an overlap of the DIS and TYP (/y/) vowel for the non-NE group while the NE group keeps the two vowels apart, especially in the PC1 dimension, resulting in a lower and to some degree more fronted vowel than for the non-NE group. There is a significant difference in PC2 for the LUS (/ʉ/) vowel and, here, the non-NE group has a slightly more fronted LUS vowel than the NE group does.
The vowels plotted into the two groups NE (gray) and non-NE (black) according to PC1 and PC2 Lobanov z-score values.

The next vowel with a significant variation is the NÄT (/ε/) vowel, which we know from previous studies is undergoing a widespread change in the central Swedish dialect area, resulting in a more open pronunciation that might result in a possible loss of the allophonic rule (Gross et al., Reference Gross, Boyd, Leinonen and Walker2016; Leinonen, Reference Leinonen2010). What we can see here is that this vowel is realized as an open vowel for both groups, but that the NÄT vowel is slightly retracted for the NE group. Worth noticing here is also the fact that there seems to be a difference in allophonic contrast of NÄT and LÄR among the non-NE group but not in the NE group; for the SÖT (/ø/) DÖR ([œ]) contrast, we can see that the distance seems to be smaller for both groups but that there is still a somewhat greater difference for the non-NE group. (However, I will return to this distinction in a separate section and test whether this is a significant difference.) Looking at the system in this way also reveals that most of the differences in the two groups seem to be concentrated in the three closed vowels. It is also clear that the “open-mid” vowels NÄT and SÖT are better described as open vowels, which is in line with the predictions in Gross et al. (Reference Gross, Boyd, Leinonen and Walker2016), which were based on data from 2002.
The prerhotic contrast of NÄT and SÖT
Since there is a significant difference in the t-test for NÄT, LÄR, and DÖR (but not SÖT), and they are connected to the same phonological rule, it makes sense to consider the significant results in PC2 of these three vowels together with the testing of the phonological rule. To test whether the groups apply allophonic rules (/ε:/ → [æ:] / _ /r/ and /ø:/ → [œ:] / _ /r/), the difference between the two vowels and their allophones’ PC1 and PC2 values were calculated (e.g., nätPC1 − lärPC1). For PC1, this means that a negative mean value indicates that the group is applying the phonological rules in the opening dimension, whereas, for PC2, a positive value indicates that the rule is used on the front-back dimension. This calculation was chosen instead of the Euclidean distance since some of the informants had a reversed order of the allophones, that is, the prerhotic allophone was less retracted and less open. The inversion of the allophones can only be interpreted as the phonological rule not being applied by these informants, since the rule has a direction such that the prerhotic allophone should be more open and retracted, which the Euclidian distance cannot capture.
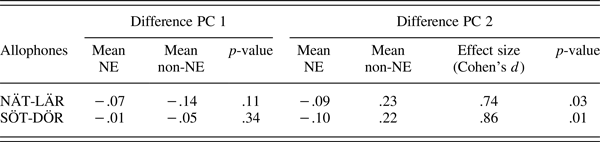
Table 6 shows the results of the t-test, testing the null hypothesis: there is no difference in the difference of the non-prerhotic and prerhotic allophone's PC values between the NE and non-NE groups. As we can see in Table 6, the hypothesis is confirmed for PC1 for both vowel pairs. Thus, there is no difference between the groups in the opening contrast of the two allophones. However, the groups differ in PC2, which means that there is a difference in degree of contrast with regard to how retracted the vowels are. The effect sizes are quite large for both of the vowel pairs, and the mean is positive for the non-NE group, indicating that they apply the phonological rule in this dimension and that the overlap between the groups is rather small. This result indicates two things: first, the non-NE group more commonly applies the allophonic rules and more commonly maintains the SÖT-DÖR distinction than the NÄT-LÄR distinction, and second, since there is no difference in PC1, it appears that the rules are being reinterpreted such that the allophonic contrast has diminished.
Results of the t-test for the difference between PC values of NÄT-LÄR and SÖT-DÖR in the NE and non-NE groups.

Note: Effect size (Cohen's d) is only given for the significant PC values, unit of mean values = z-scores.
DISCUSSION
The structuring of the vowels among young Gothenburg speakers is clearly affected by the intersection of FB, education, and socioeconomic status manifested in housing segregation in the city. The features that stand out as separating the two groups are those that are described in the literature as separating the local Gothenburg dialect of today from the standard description of Swedish. The greatest differences have to do with the realization of the closed front vowels, DIS and TYP. The non-NE group behaves in accordance with what would be expected from previous descriptions of the Gothenburg dialect: both vowels have a centralized realization and display coherence. This coherence between DIS and TYP is not displayed by the NE group, where we instead find that the DIS vowel is closer to the Swedish standard description and the TYP vowel has a more open articulation and is closer to the LUS vowel. In fact, the two vowels were sometimes used interchangeably by some of the NE speakers, for example, the word myra [my:ra] ‘ant’ was sometimes realized as [mʉ:ra], although never consistently by any speaker. The non-NE group, on the other hand, show a tendency toward a merger of /i:/ and /y:/ toward /i:/ (Gross & Forsberg, unpublished data). The analysis in this paper shows that it is not the FB by itself that is the reason that the adolescents in the NE group do not acquire the dialectal features; rather, it is the housing segregation that makes them less likely to interact with peers from other areas of the city where the dialect is spoken and thereby get an opportunity to incorporate the dialectal feature into their vowel system. If FB were the single factor that predicted dialect acquisition, we would not find informants in the non-NE group with FB using the dialectal features in a systematic way, but we do. When Kotsinas (Reference Kotsinas1988) raised the question of whether immigrant children's Swedish could be considered a new variety, she was not wrong in concluding that what she found in Rinkeby (a Stockholm suburb demographically similar to the ones in the northeastern parts of Gothenburg) could be a new variety. However, since she did not consider the fact that FB interacts with other social factors, because of housing segregation, she introduced the factor of the parents’ FB that was too general to actually capture how a variety is acquired, as the local variety is acquired in the peer group (Weinreich et al., Reference Weinreich, Labov and Herzog1968:184–185), while the parents’ background plays a relatively minor role.
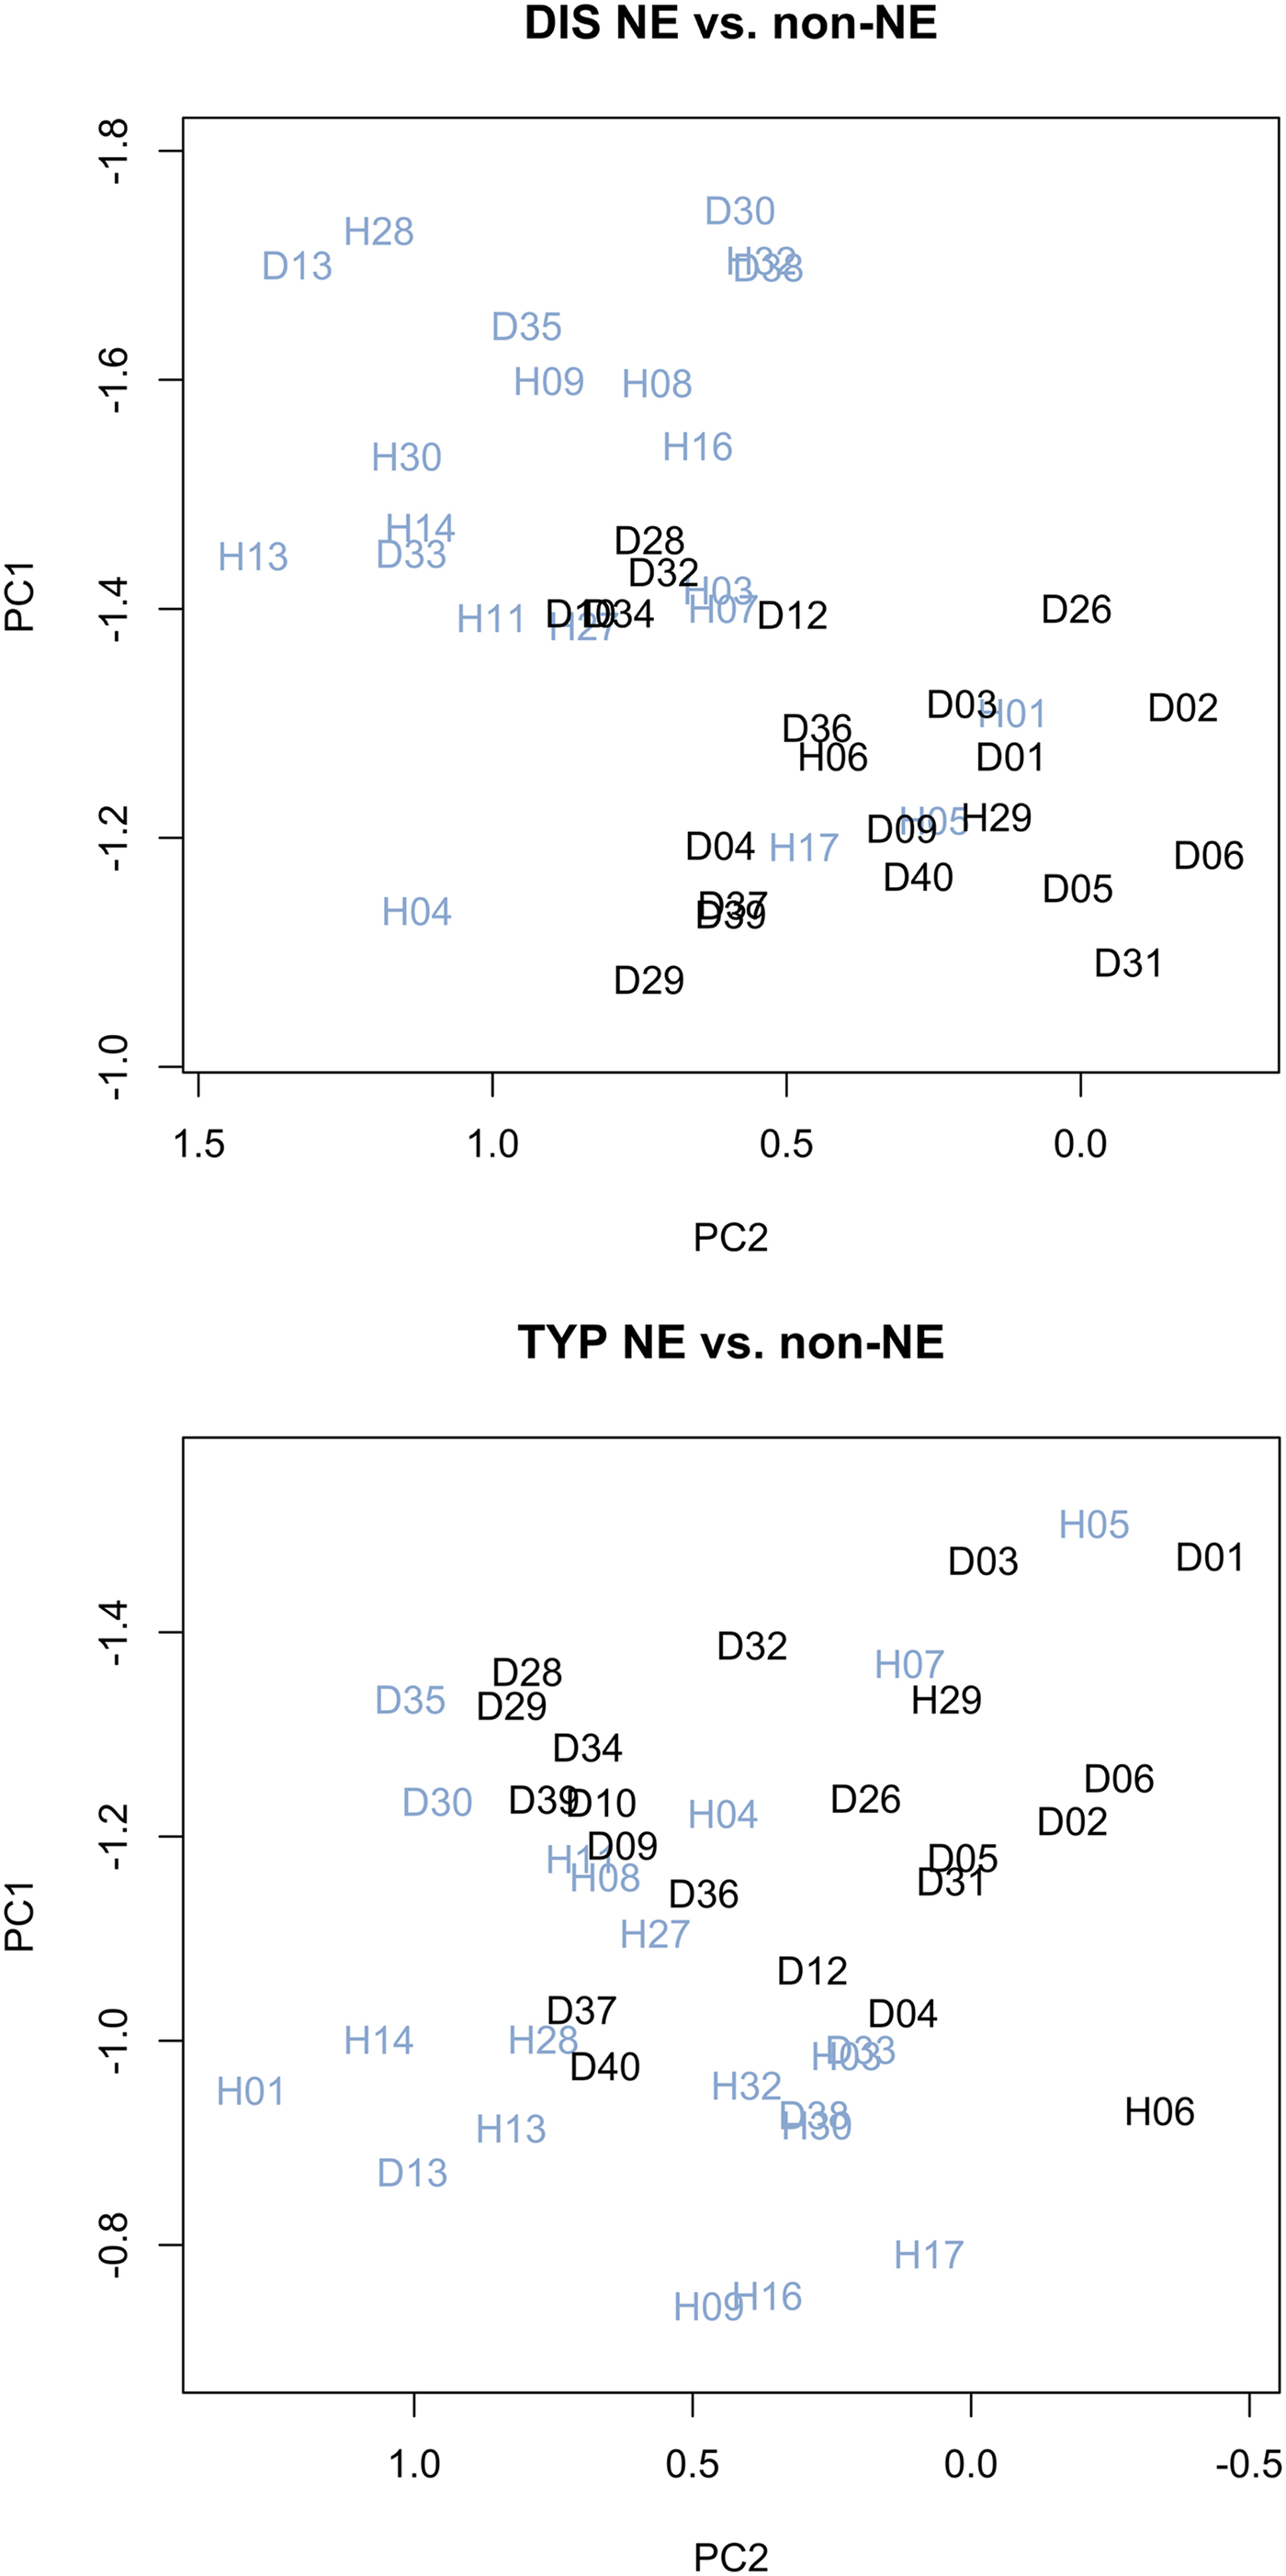
The segregation is far from total, however, and we find speakers in the NE group that do use some dialectal features. One such example is H05, who grew up in the NE and has lived there her whole life. She is a clear outlier from the NE group when both the DIS and the TYP vowels are plotted, in Figure 4. Here, the adolescents from the northeastern suburbs are plotted in gray and those that are not from there are plotted in black. The first thing that we can observe is that the two groups cluster together with very little overlap for the DIS vowel and slightly more for the TYP vowel, and the few outliers that we find are members of the NE group. H05 is in the middle of the non-NE cluster for the DIS vowel but has one of the most extreme values for the TYP vowel. She did the map-task together with a friend, H29; he has FB but grew up in the city center (Linnéstaden) and just recently moved to Hisingsbacka (not a part of the NE). Although the case of H05 is an exception, it indicates that there are cases where NE speakers and non-NE speakers are part of the same social network, which means that there can be a transmission of some features.
Each speaker's mean value of the DIS (top) and TYP (bottom) vowels plotted with the informants’ code. The letter in the code indicates the school (D = inner-city, H = suburb), the number indicates whether it is a girl (01–25) or a boy (26–50), and the color is NE = gray and non-NE = black.

It is important to emphasize that, not only do some NE informants use a centralized /i:/, the realization of /i:/ also displays coherence with that of /y:/ for some of them. This coherence indicates that we need to consider not only a single feature but also a phonological phenomenon if we want to know whether it is a single variable or a more abstract phonological structure that has been acquired. Guy (Reference Guy2013) showed that different variables associated with a variety might be used in different combinations and to different degrees by different members of the same speech community; that is, the lectal cohesion might be weak between individuals but individual speakers can still use single variants of a variable. Although the lectal cohesion in the two groups under investigation in this study seems to be fairly strong, we find individuals that display a different pattern; two examples are H17 and H01 (Figure 4), who both have a centralized /i:/ but a fronted /y:/, and consequently do not produce the two vowels in the same way as the rest of the NE group does, but neither converge to the non-NE group. These speakers use /i/ as a single variable but do not tap into the system of the Gothenburg dialect. As Labov (Reference Labov2014:18) put it, “Words and sounds may diffuse from one community to another, but systems do not”; in other words, to know whether the dialect is acquired, we need to consider the linguistic feature under investigation in the linguistic system and not as single variables taken out of their social and linguistic contexts.
Research on /ε:/ (Gross et al., Reference Gross, Boyd, Leinonen and Walker2016) showed, when recordings collected in 2002 were analyzed, that the allophonic rule was still used by youth with Swedish-born mothers, but also that the group with the highest variation was girls with Swedish-born mothers. This result was interpreted as indicative of a change in progress, with youth with foreign-born mothers leading, followed by the girls with Swedish-born mothers and boys with Swedish-born mothers lagging behind. The results in this paper support this interpretation with newer and more comprehensive data. Although I do not deal here with the exact same background variable as in Gross et al. (Reference Gross, Boyd, Leinonen and Walker2016), there is only one group with Swedish-born mothers (the non-NE group) in the current study, and this is the group that lags. However, there is a difference between the 2016 study, where both F1 and F2 were significant, and the present one, where only PC2 is significant. The change seems to have come close to completion as concerns the lowering of the vowel, but the two groups still exhibit differences, since the NE group seems to have moved to a complete merger of the two allophones to [æ:]. This situation, where the contrast is lost in the PC1 dimension but kept in the PC2 dimension, is reminiscent of the general characteristics of a near merger, as pointed out by Labov, Karen, and Miller (Reference Labov, Karen and Miller1991:45), although we do not observe the merger of two phonemes but rather two allophones.
There is a dearth of research on /ø:/, even though the results concerning /ø:/ in this paper indicate that the coherence between /ε:/ and /ø:/ is quite strong. It therefore makes sense to consider both vowels at the same time: that is, either speakers apply the phonological rule for both vowels or the vowels are both merged and realized as the more open and retracted form. However, there is a difference between /ε:/-/ø:/ and /i:/-/y:/ in that the first pair is undergoing a widespread change (Gross et al., Reference Gross, Boyd, Leinonen and Walker2016; Leinonen, Reference Leinonen2010) and the other is connected to the local Gothenburg dialect coherence. So, in the case of /ε:/-/ø:/, what we might see is leveling, that is, a change that is accessible in more cases than the local dialectal features are. In this respect, it might not be so strange that the youth who are exposed to the dialect seem to lag behind somewhat, since they might acquire a norm orientating away from the leveled one while still being exposed to the change.
CONCLUSION
In this paper, I have approached the language variation among youths in Gothenburg by studying their long vowels as a system and not as single variants of a variable. In analyzing the data in this way, patterns of coherence between /i:/-/y:/ and /ε:/-/ø:/ have become clearer. This patterning can be predicted by the housing segregation connected to different geographical areas of the city, although the segregation is not determined by one specific factor but rather by a number of intersecting social factors. Another important aspect to acknowledge is the two vowel pairs’ connection to the system of the dialect and to changes in the Swedish language. The centralization and coherence of /i:/ and /y:/ are clearly connected to the local dialect, whereas the change of /ε:/ and /ø:/ toward more open forms where they are merging with their allophones is a widespread change in the central Swedish dialect area (Gross et al., Reference Gross, Boyd, Leinonen and Walker2016; Leinonen, Reference Leinonen2010). This results in two different outcomes: first, the dialectal forms of /i/ and /y/ are not (fully?) transmitted to the NE group, and, second, the NE group is leading the widespread change of /ε:/ and /ø:/, while being mostly excluded from changes in /i:/ and /y:/, since the transmission of linguistic norms from the dialectal speakers is weaker because of the housing segregation.
The focus of this study has been on the group level and the more abstract linguistic properties that we can find here. Other factors such as “coolness” or gender that can be used in the construction of an identity have not been discussed here. I do not claim that these factors do not play a role on a meso or micro level. However, on the macro level, we need to take a step back from the idea of ethnicity or FB as the sole predicting factor and consider that a combination of social factors might contribute to the development of new ways of speaking in multilingual urban neighborhoods, since this combination of factors results in less dense communication between speakers of the different groups.