





1. Introduction
The study of rotor-stator flows has a long history. Early investigations of the laminar flow regime in the flow between two infinite discs, one of which is rotating, questioned the structure of the laminar velocity field. Many co-existing steady solutions with a self-similar spatial structure were reported (Holodniok, Kubicek & Hlavacek Reference Holodniok, Kubicek and Hlavacek1977; Zandbergen & Dijkstra Reference Zandbergen and Dijkstra1987), among them the well-known solutions by Batchelor (Reference Batchelor1951) and Stewartson (Reference Stewartson1953). In the presence of a radial shroud, the system is thought to admit only one steady solution existing for all rotation rates, which will be considered as the base flow. It features a closed meridional recirculation of the Batchelor type including a boundary layer on the stator and another one on the rotor. This base flow solution departs increasingly from the self-similar solutions as the distance from the axis and the rotation rate increase (Brady & Durlofsky Reference Brady and Durlofsky1987), which questions the quantitative relevance of all instability studies of self-similar solutions for the finite geometry.
We address here the mechanisms through which rotor-stator flows transition towards unsteady regimes interpreted as precursors of turbulent flow. Global linear stability analysis of the base flow (Gelfgat Reference Gelfgat2015) predicts, for large enough aspect ratios, the linear instability of non-axisymmetric spiral modes, usually in quantitative agreement with concurrent experimental observations (Gauthier Reference Gauthier1998; Schouveiler, Le Gal & Chauve Reference Schouveiler, Le Gal and Chauve1998) and later numerical simulations (Serre, Crespo Del Arco & Bontoux Reference Serre, Crespo Del Arco and Bontoux2001; Serre, Tuliszka-Sznitko & Bontoux Reference Serre, Tuliszka-Sznitko and Bontoux2004). The azimuthal wavenumber  $m$ of these spirals is typically large and comparable to the radius-over-gap ratio
 $\varGamma$. The spiral modes and their onset were reported as experimentally robust, independent of the noise level (Gauthier Reference Gauthier1998). The nonlinear saturation of these spiral modes follows a simple supercritical scenario followed by turbulent transition (Launder, Poncet & Serre Reference Launder, Poncet and Serre2010).
The spiral arms are, however, not the coherent structures appearing at the lowest rotation rates. Concentric rolls of finite amplitude have been frequently reported as the earliest manifestation of unsteadiness at moderate-to-large aspect ratios. This phenomenon was first reported in spin-down experiments (Savas Reference Savas1987) and then in most experimental studies (Gauthier, Gondret & Rabaud Reference Gauthier, Gondret and Rabaud1999; Schouveiler, Le Gal & Chauve Reference Schouveiler, Le Gal and Chauve2001), but has been missed by most computational stability analyses. The presence of these additional flow structures can potentially undermine all predictions from linear stability analysis. The concentric rolls were first reproduced in direct numerical simulations following impulsive perturbations, but they were reported to convect towards the centre and to vanish, being hence short transients rather than sustained coherent structures (Lopez et al. Reference Lopez, Marques, Rubio and Avila2009). This is consistent so far with the convective instability viewpoint put forward in the recent review by Martinand, Serre & Viaud (Reference Martinand, Serre and Viaud2023), although such a viewpoint is intrinsically limited in finite geometries. As shown by Daube & Le Quéré (Reference Daube and Le Quéré2002) and recently confirmed by Gesla et al. (Reference Gesla, Duguet, Le Quéré and Martin Witkowski2024) in a strictly axisymmetric context, the base flow is linearly unstable to the axisymmetric mode for much higher Reynolds number,  $Re$, than suggested from experimental observation. This agrees with previous linear stability studies that predict spirals as the first mode of linear instability. Chaotic subcritical solutions were actually identified by Daube & Le Quéré (Reference Daube and Le Quéré2002). However, their continuation towards lower
 $Re$ has failed to reach the low values relevant for circular rolls in experiments (Gesla et al. Reference Gesla, Duguet, Le Quéré and Martin Witkowski2024). The riddle of the dynamical origin of the circular rolls reported in these experiments thus remains unsolved.
Continuous efforts have been made in the past to link the stability of enclosed rotor-stator flows to the results of local stability analysis of one-dimensional similarity solutions. All these studies rely on boundary layer profiles and imply unbounded domains in the radial direction for one- or two-disc set-ups. In the latter case, large enough Reynolds numbers are also necessary so that the boundary layers are well separated. A recent review of transition scenarios in finite- and infinite-radius rotor-stator configurations based on a local stability analysis can be found in Martinand et al. (Reference Martinand, Serre and Viaud2023). The local stability analysis is necessarily approximative for enclosed rotor-stator flow but nevertheless very useful to understand the physical mechanism of instabilities. The Reynolds number range where the circular rolls first appear does not, however, correspond to separated boundary layers, which questions the quantitative relevance of local stability analysis.
A first hint about the origin of the circular rolls comes from the experimental study by Gauthier et al. (Reference Gauthier, Gondret and Rabaud1999). They observed that a change of motor in their experimental set-up lowers the threshold of appearance of rolls by roughly half. This pointed in turn to a high sensitivity of the rolls to external disturbances. Following these observations, numerical computations were performed where the system was continuously forced with a sinusoidal libration of the rotor (Lopez et al. Reference Lopez, Marques, Rubio and Avila2009; Do, Lopez & Marques Reference Do, Lopez and Marques2010). This forcing also proved to sustain a roll-like response, although the exact temporal dynamics remains to be compared with its experimental counterpart. Based on direct numerical simulation, Do et al. (Reference Do, Lopez and Marques2010) demonstrated that nonlinear effects contributed to the global dynamics of the rolls. We present results of the optimal forcing from the resolvent analysis that complement the direct numerical simulations and bring new insights. Since the form of the forcing in Do et al. (Reference Do, Lopez and Marques2010) is fixed, their study can be understood as optimisation in the forcing frequency only. The form of the optimal response resulting from the resolvent analysis can be understood as a spatial optimisation and forms a novelty with respect to Do et al. (Reference Do, Lopez and Marques2010). More recently, it was demonstrated in Gesla et al. (Reference Gesla, Duguet, Le Quéré and Martin Witkowski2024), at least for the case  $\varGamma =10$, that the axisymmetric system features, independently of any external forcing, a self-sustained nonlinear regime coexisting with the base flow below the critical threshold. The existence of this subcritical regime is reminiscent of other subcritical shear flows such as Poiseuille flows and plane Couette flow (Eckhardt Reference Eckhardt2018; Avila, Barkley & Hof Reference Avila, Barkley and Hof2023). This leads to the dilemma as to whether the circular rolls observed in experiments should be interpreted as a response to external forcing, in other words a noise-sustained state, or as the footprint of a self-sustained coherent state of nonlinear origin. Formulated differently, does the flow follow a resonance scenario or does it oscillate autonomously independently of the way it is forced? Even in the case where the flow is externally forced, is the response linear or are nonlinear interactions important?
The present study aims at answering these questions by means of resolvent analysis and numerical simulations. Although the circular rolls were reported experimentally only at low values of  $Re$ where the flow stays axisymmetric, we propose to consider
 $Re$ as the main governing parameter for the purely axisymmetric rotor-stator configuration, regardless of whether the experimental dynamics stays axisymmetric or not, and to investigate the effect of varying
 $Re$ on both the linear receptivity scenario and the fully nonlinear one. Due to the assumed axisymmetric configuration the present study does not bring any insight into optimally forced three-dimensional (3-D) structures. Our receptivity approach to external forcing follows several complementary approaches. Classical optimal linear response theory, through resolvent analysis, directly yields the optimal forcing eliciting the strongest response of the flow. By design, however, this forcing is applied within the bulk of the flow, away from the solid walls. Parasite vibrations of the set-up are rather expected to act at the fluid–solid interface and, thus, bulk-based optimisation might not capture them, especially when the forcing is modelled as an additive force. For this reason, as well as for the freedom of incorporating nonlinear fluid interactions, direct numerical simulation of fluid flow in the presence of well controlled boundary oscillations is also considered without any optimisation. As we shall see, the scenario most consistent with experimental observations is the boundary forcing. For higher
 $Re$, we demonstrate numerically how circular rolls of finite amplitude can be elicited and sustained by nonlinear forcing, whereas, depending on the value of
 $Re$, they correspond either to super-transients or to an attracting dynamics, should the forcing be turned off. Beyond the immediate analogy with subcritical shear flows, it is also of strong general interest as it yields a concrete example of nonlinear receptivity whereas receptivity is traditionally investigated using linear tools.
The structure of the paper is as follows. Section 2 introduces the governing equations and the discretised ones. Section 3 is a description of the axisymmetric base flow. Section 4 is devoted to finding optimal forcing using resolvent analysis. A comparison of the identified states with experimental evidence is presented in § 5. The validity of the linear response assumption is verified in § 6 by considering both linearised and nonlinear time integration. Also, the amplitudes of forcing at which the nonlinearity plays an important role are characterised. The main findings of the paper are summarised in § 7.
2. Governing equations and numerical methods
The system consists of two coaxial disks of radius  $R$, separated by a gap
 $H$. One of the disks, the rotor, rotates at a constant dimensional angular velocity
 $\varOmega$, while the stator is at rest, see figure 1. We chose to non-dimensionalise all lengths by the gap
 $H$ and time using
 $(\varOmega )^{-1}$. Assuming a constant kinematic viscosity
 $\nu$ for the fluid, two non-dimensional parameters characterise this system, namely the geometric aspect ratio
 $\varGamma =R/H$ and the (gap-based) Reynolds number
 $Re=\varOmega H^2/\nu$. Other possible definitions for the Reynolds number
 $Re$ include
 $Re_R=\varOmega R^2/ \nu$, built on the length scale
 $R$ or
 $Re_{RH}={\varOmega R H}/{\nu }$. In the current work the definition of
 $Re$ based on
 $H$ is preferred since it can be defined in both finite and infinite radial extent set-ups, as it facilitates a straightforward comparison with other studies.
Rotor-stator geometry with rotating shroud. The set-up is characterised by the Reynolds number  $Re= {\varOmega H^2}/{\nu }$ and an aspect ratio
 $\varGamma =R/H$ fixed in most of this article to 10.

2.1. Governing equations
The non-dimensional velocity  $\boldsymbol {v}=(v_r,v_{\theta },v_z)$ and the non-dimensional pressure
 ${\rm \pi}$ obey the incompressible Navier–Stokes equations (2.1–2.4). Throughout the whole paper we assume that the flow is strictly axisymmetric. We consider the Navier–Stokes equations in the cylindrical coordinate system
 $(\boldsymbol{e}_r,\boldsymbol{e_{\theta }},\boldsymbol{e_{z}})$
 $$\begin{gather} \frac{\partial v_r}{\partial t} + v_r \frac{\partial v_r}{\partial r} + v_z \frac{\partial v_r}{\partial z} -\frac{v^2_{\theta}}{r}={-}\frac{\partial {\rm \pi}}{\partial r} + \frac{1}{Re}\left(\frac{1}{r}\frac{\partial}{\partial r} \left(r\frac{\partial v_r}{\partial r}\right) - \frac{v_{r}}{r^2} + \frac{\partial^2 v_r}{\partial z^2}\right), \end{gather}$$
 $$\begin{gather}\frac{\partial v_{\theta}}{\partial t} + v_r \frac{\partial v_{\theta}}{\partial r} + v_z \frac{\partial v_{\theta}}{\partial z} +\frac{v_rv_{\theta}}{r}= \frac{1}{Re}\left(\frac{1}{r}\frac{\partial}{\partial r} \left(r\frac{\partial v_{\theta}}{\partial r}\right) - \frac{v_{\theta}}{r^2} + \frac{\partial^2 v_{\theta}}{\partial z^2}\right), \end{gather}$$
 $$\begin{gather}\frac{\partial v_z}{\partial t} + v_r \frac{\partial v_z}{\partial r} + v_z \frac{\partial v_z}{\partial z} ={-}\frac{\partial {\rm \pi}}{\partial z} + \frac{1}{Re}\left(\frac{1}{r}\frac{\partial}{\partial r} \left(r\frac{\partial v_z}{\partial r}\right) +\frac{\partial^2 v_z}{\partial z^2}\right), \end{gather}$$
 $$\begin{gather}\frac{1}{r} \frac{\partial (r v_r)}{\partial r} + \frac{\partial v_z}{\partial z}=0. \end{gather}$$
The coupled system of partial differential equations is complemented with the no-slip boundary conditions expressed as (2.5)
 \begin{equation} \begin{cases} \boldsymbol{v}=r\boldsymbol{e_{\theta}}, & \text{at the rotor}\ (z=0), \\ \boldsymbol{v}=\varGamma \boldsymbol{e_{\theta}}, & \text{at the shroud}\ (r=\varGamma), \\ \boldsymbol{v}=\boldsymbol{0}, & \text{on the stator}\ (z=1). \end{cases} \end{equation}
2.2. Discretisation
The continuous problem is discretised using a second-order finite volume method on a staggered grid. The details of the discretisation as well as the staggered arrangement can be found in Appendix A of Faugaret et al. (Reference Faugaret, Duguet, Fraigneau and Martin Witkowski2022). Two types of mesh, uniform and non-uniform, are used. The non-uniform mesh is refined in the regions near the rotor, the stator and the rotating shroud. Details on the non-uniform mesh set-up can be found in Gesla et al. (Reference Gesla, Duguet, Le Quéré and Martin Witkowski2024).
Details on the spatial discretisation used are given in table 1. In both uniform and non-uniform cases, the number of pressure cells in the radial direction  $r$ (respectively the axial direction
 $z$) is noted
 $N_r$ (respectively
 $N_z$). For the application of the boundary conditions a layer of ghost cells is added outside the physical domain.
Mesh resolutions used in the study (DOF is degrees of freedom).

2.3. Numerical methods
The nonlinear system of (2.1–2.4) admits for all  $Re$ a steady solution. Once the system is discretised, the solution of the large algebraic nonlinear system of equations is determined numerically using a Newton–Raphson algorithm (see e.g. Appendix B in Faugaret et al. Reference Faugaret, Duguet, Fraigneau and Martin Witkowski2022). The
 $O(4N_rN_z)$ unknowns are the velocity and pressure values at each discretisation point. Due to the presence of the thin boundary layers close to each disk, the set of equations resulting from the discretisation of the continuous system is in general poorly conditioned. Sparse direct solvers will be therefore preferred over the iterative solvers for solving the linear systems in each Newton–Raphson iteration.
A technical remark concerning the geometry can be made at this point: at the junction between the rotating shroud and the stationary disc, the sudden change in  $u_{\theta }$ imposed in the boundary condition induces a discontinuity of the velocity field in the
 $(r,z)=(\varGamma,1)$ corner. This singularity can have an impact on the accuracy of the numerical solutions. In order to avoid singular boundary conditions and the well-known associated Gibbs phenomenon, several teams using pseudospectral solvers (Serre et al. Reference Serre, Tuliszka-Sznitko and Bontoux2004; Lopez et al. Reference Lopez, Marques, Rubio and Avila2009) proposed to smooth out the discontinuous boundary condition between the stator and the shroud. Whenever finite volume discretisation is used the singular corner does not degrade the second order of spatial accuracy of the scheme, as demonstrated in Gesla et al. (Reference Gesla, Duguet, Le Quéré and Martin Witkowski2024).
The linear stability of the base flow is evaluated using the Arnoldi method based on a well-validated ARPACK package (Lehoucq, Sorensen & Yang Reference Lehoucq, Sorensen and Yang1998). A generalised eigenvalue problem can be constructed using the Jacobian matrix used in the procedure for finding the base flow stemming from linearisation of the governing equations around a base flow (§ 4). For a generalised eigenvalue problem
 \begin{equation} \boldsymbol{A} \boldsymbol{w}=\lambda \boldsymbol{B} \boldsymbol{w}, \end{equation}
the shift-and-invert method finds a subset of eigenvalues closest to a complex shift  $s$ through repeated Arnoldi iteration
 \begin{equation} \nu \boldsymbol{w}=( \boldsymbol{A}-s \boldsymbol{B})^{{-}1}\boldsymbol{B}\boldsymbol{w}, \end{equation}
where the original eigenvalues  $\lambda$ can be retrieved with
 \begin{equation} \nu=\frac{1}{\lambda-s}. \end{equation}
The time integration of the governing equations uses a prediction–projection algorithm in the rotational pressure correction formulation, as described in Guermond, Minev & Shen (Reference Guermond, Minev and Shen2006). The prediction step combines a backwards differentiation formula 2 scheme for the diffusion terms and an explicit treatment of the convective terms, resulting in a Helmholtz problem for each velocity component increment. These Helmholtz problems are solved using an alternating-direction implicit method in incremental form which preserves the second-order accuracy in time. In the projection step the velocity field is projected onto the space of divergence-free fields by solving a Poisson equation for the pressure. This Poisson equation is solved using a direct sparse solver. Once the base flow solution is found, the time-stepping code can be adapted to evolve the perturbation to the base flow rather than the full velocity field itself, at the expense of a triple evaluation of the convective terms.
3. Base flow
The base flow is the steady axisymmetric velocity field  $\boldsymbol{U_b}$ solution to the governing equations (2.1–2.4) compatible with the boundary conditions (2.5). It is associated with a pressure field
 $p_b$ defined up to an additive constant. It consists, for high enough
 $Re$, of two boundary layers, one on each disk, and a core region. Fluid is forced into circulation around the cavity by the rotation of the bottom disc. It is advected towards the rotating shroud and returns towards the axis along the stationary disk. In figure 2(a) isocontours of
 $u_{\theta }$ fields are plotted for increasing
 $Re$. The meridional recirculation plane is shown using meridional streamlines in figure 2(b). Streamfunction
 $\psi (r,z)$ is defined implicitly by
 $v_r=({1}/{r})({\partial \psi }/{\partial z})$ and
 $v_z=-({1}/{r})({\partial \psi }/{\partial r})$. For high enough
 $Re$ the core region between the boundary layers appears almost independent of
 $z$.
Axisymmetric base flow solution for  $\varGamma =10$. Visualisations in a meridian section for (a–h)
 $Re=70$ (panels a,b), 150 (panels c,d), 250 (panels e,f), 3000 (panels g,h). (a,c,e,g) Azimuthal velocity
 $u_{\theta }(r,z)$. The colour map divides the interval (0,10) into 8 equal subintervals. (b,d, f,h) Streamfunction
 $\psi (r,z)$. Plotted values:
 $\psi _{Re=70}=1,(1),4$;
 $\psi _{Re=150}=0.5,(0.5),2.5$;
 $\psi _{Re=250}=0.5,(0.5),2$;
 $\psi _{Re=3000}=0.1,(0.1),0.6$;
 $\psi =0$ corresponds to the wall. Numerical resolution R1.

For the case  $\varGamma =10$, a linear instability of the base flow in the axisymmetric configuration was found for
 $Re\approx 3000$, due to the destabilisation of a wavepacket of counter-rotating circular rolls in the Bödewadt layer at
 $r\approx 2$ (Daube & Le Quéré Reference Daube and Le Quéré2002). This result was recently confirmed quantitatively by Gesla et al. (Reference Gesla, Duguet, Le Quéré and Martin Witkowski2024). The threshold for axisymmetric instability is one order of magnitude larger than the experimental threshold of
 $Re\approx 200$ reported e.g. in Gauthier (Reference Gauthier1998).
The analysis of Gesla et al. (Reference Gesla, Duguet, Le Quéré and Martin Witkowski2024) can be extended to the non-axisymmetric case by using an exponential ansatz with an integer wavenumber  $m$ in the azimuthal direction (Gelfgat Reference Gelfgat2015). The instability investigation of Gesla et al. (Reference Gesla, Duguet, Le Quéré and Martin Witkowski2024) becomes spatially two-dimensional (2-D) with an additional parameter
 $m$ (azimuthal wavenumber) and a critical value of
 $Re=528.91$ for
 $m=32$ (numerical resolution
 $N_r\times N_z=600\times 128$ for
 $\varGamma =10$ set up with a rotating shroud). It is noted that the critical
 $Re$ for non-axisymmetric modes is around six times lower than for axisymmetric modes (
 $Re\approx 3000$). The results for
 $m\neq 0$ concern spiral rolls rather than circular rolls. Since this work focuses only on circular rolls, it is assumed that the flow is strictly axisymmetric in what follows.
The base flow being linearly stable in the  $Re$ interval of interest for this study, it can in principle be found by asymptotic time integration. Nevertheless, in order to avoid strong transient growth effects (Daube & Le Quéré Reference Daube and Le Quéré2002; Gesla et al. Reference Gesla, Duguet, Le Quéré and Martin Witkowski2024) it is safest to converge the base flow using the dedicated Newton–Raphson solver to machine precision (i.e. when the Euclidean norm of the residual drops below
 $10^{-11}$). As shown in § 6, for high enough
 $Re$ even a small perturbation will evolve to a top branch chaotic solution. Such a perturbation occurs for instance following an instantaneous change in
 $Re$. It was in particular found that the base flow cannot be found in a reasonable time using time integration for
 $Re>2100$.
In the rest of the paper, once the base flow is known, we deal exclusively with axisymmetric perturbation  $\boldsymbol{u}(r,z,t)$ to the base flow, i.e.
 $\boldsymbol{u}=\boldsymbol{v}-\boldsymbol{U_b}$ and
 $p={\rm \pi} -p_b$, the equations for which can be deduced directly from the governing equations by subtraction. The associated boundary conditions are homogeneous of Dirichlet type, i.e.
 $\boldsymbol{u}=0$ at all walls. At the axis (
 $r=0$)
 $u_r$ and
 $u_{\theta }$ vanish while
 $u_z$ verifies a Neumann condition.
4. Linear response to forcing
4.1. Optimal response theory
In this subsection the linear response of the flow to the forcing is analysed using optimal response theory. Following Cerqueira & Sipp (Reference Cerqueira and Sipp2014) we conduct the input/output analysis and show that the optimal response of the flow is for most relevant values of  $Re$ in the shape of circular rolls, and that associated with high levels of optimal gain. The nonlinear system of (2.1–2.4) can be linearised around the base flow when perturbation velocities are small enough. If a forcing field
 $\boldsymbol{f}$ is introduced, the resulting system for the perturbation field
 $(\boldsymbol{u},p)$ can be rewritten
 $$\begin{gather} \frac{\partial \boldsymbol{u}}{\partial t} + (\boldsymbol{U_b}\boldsymbol{\cdot} \boldsymbol{\nabla})\boldsymbol{u}+ (\boldsymbol{u}\boldsymbol{{\cdot}} \boldsymbol{\nabla})\boldsymbol{U_b}={-}\boldsymbol{\nabla}p + \frac{1}{Re}\boldsymbol{\nabla}^2 \boldsymbol{u} + \boldsymbol{f}, \end{gather}$$
 $$\begin{gather}\boldsymbol{\nabla} \boldsymbol{\cdot} \boldsymbol{u}=0. \end{gather}$$
The coupled system in (4.1)–(4.2) is linear in  $\boldsymbol{u}$,
 $p$ and also
 $\boldsymbol{f}$, which suggests to use the resolvent formalism. The theory by Trefethen & Embree (Reference Trefethen and Embree2005) forms the ideal framework except that the original linear system needs be rewritten in a form
 $\partial \boldsymbol{q}/\partial t=\boldsymbol{L q} + \boldsymbol{f_q}(t)$, where the unknown field
 $\boldsymbol{q}$, a linear operator
 $\boldsymbol{L}$ and a forcing
 $\boldsymbol{f_q}(t)$ need to be specified. We introduce the new variable
 $\boldsymbol {q}=(u_r,u_{\theta },u_z,p)$ which contains the values of the fields
 $u_r$,
 $u_{\theta }$,
 $u_z$ and
 $p$ at all the points of the discretised domain. The size of
 $\boldsymbol {q}$ is
 $O(4N_rN_z)$. We also introduce the rectangular prolongation operator
 $\boldsymbol{P}$ of size
 $O(4N_rN_z \times 3N_rN_z)$ which maps
 $\boldsymbol{u}$ into
 $\boldsymbol{q}$, so that
 $\boldsymbol {P}^{T}\boldsymbol {q}=\boldsymbol {u}$ with the property
 $\boldsymbol {P}^{T}\boldsymbol {P}=\boldsymbol {I}$, see e.g. Jin, Symon & Illingworth (Reference Jin, Symon and Illingworth2021). The linear system (4.1–4.2) can then be rewritten into the new form
 \begin{equation} \boldsymbol{B}\frac{\partial \boldsymbol{q}}{\partial t}=\boldsymbol{A}\boldsymbol{q}+\boldsymbol{P}{\boldsymbol{f}}, \end{equation}
where  $\boldsymbol {B}=\boldsymbol {P}\boldsymbol {P}^{T}$. After a Fourier transform in time, each Fourier component
 $\hat {\boldsymbol {q}}$ of
 $\boldsymbol {q}$ satisfies
 \begin{equation} ({\rm i} \omega \boldsymbol{B}-\boldsymbol{A}) \hat{\boldsymbol{q}}=\boldsymbol{P}\hat{\boldsymbol{f}} , \end{equation}
resulting in the Fourier components  $\hat {\boldsymbol {u}}$ of the velocity field
 $\boldsymbol {u}$ as the action of a matrix
 $\boldsymbol {R}$ on the forcing
 $\hat {\boldsymbol {f}}$
 \begin{equation} \hat{\boldsymbol{u}}=\boldsymbol{R}\hat{\boldsymbol{f}}, \end{equation}
where
 \begin{equation} \boldsymbol{R}=\boldsymbol{P}^{T}( {\rm i} \omega \boldsymbol{B}-\boldsymbol{A})^{{-}1}\boldsymbol{P}, \end{equation}
is the resolvent operator associated with the (real) angular frequency  $\omega$.
An optimal gain can be evaluated by identifying an optimal forcing for a suitable norm of the resolvent  $\boldsymbol {R}$. A positive symmetric linear operator
 $\boldsymbol {Q} \neq \boldsymbol {I}$, associated with the cylindrical coordinate system, can be used to define the inner product
 \begin{equation} \langle\boldsymbol{u},\boldsymbol{v}\rangle_{\boldsymbol{Q}}=\boldsymbol{u}^*\boldsymbol{Q}\boldsymbol{v} =\int_0^1 \int_0^{\varGamma} (u_r^*v_r+u_{\theta}^*v_{\theta}+u_z^*v_z)r \,{\rm d}r \,{\rm d}z, \end{equation}
where the asterisk denotes complex conjugate. The associated vector norm is defined by
 \begin{equation} \| \boldsymbol{u} \|_{\boldsymbol{Q}} =\sqrt{\boldsymbol{u}^*\boldsymbol{Z}^{T}\boldsymbol{Z}\boldsymbol{u}}=\| \boldsymbol{Z}\boldsymbol{u} \|_2, \end{equation}
where  $\boldsymbol {Q}=\boldsymbol {Z}^{T}\boldsymbol {Z}$. Here,
 $\boldsymbol {Q}$ can be also used to define the following norm for the resolvent operator:
 \begin{equation} \| \boldsymbol{R} \|_{\boldsymbol{Q}}=\| \boldsymbol{Z}\boldsymbol{R}\boldsymbol{Z}^{{-}1} \|_2=\sigma_{1} (\boldsymbol{Z}\boldsymbol{R}\boldsymbol{Z}^{{-}1}), \end{equation}
where  $\sigma _{1}$ denotes the largest singular value in the SVD (singular value decomposition). Note that finding the largest singular value of
 $\boldsymbol {ZRZ^{-1}}$ is equivalent to finding the largest eigenvalue of the eigenvalue problem (Cerqueira & Sipp Reference Cerqueira and Sipp2014)
 \begin{equation} \boldsymbol{R}^*\boldsymbol{Q}\boldsymbol{R}\hat{\boldsymbol{f}}=\lambda\boldsymbol{Q}\hat{\boldsymbol{f}}, \end{equation}
where
 \begin{equation} G=\lambda=\sigma_{1}^2=\frac{\hat{\boldsymbol{u}}^*\boldsymbol{Q}\hat{\boldsymbol{u}}}{\hat{\boldsymbol{f}}^*\boldsymbol{Q}\hat{\boldsymbol{f}}}, \end{equation}
is interpreted as the optimal energy gain.
4.2. Optimal response: results
For a range of angular frequencies  $\omega$ the eigenvalue problem (4.10) is solved numerically in MATLAB with the eigs() function. The resulting eigenvalue
 $G=\sigma _1^2$ from (4.11) is plotted in figure 3(a) as a function of the (real) angular frequency of the forcing. The optimal values
 $\sigma _{max}^2$ over all angular frequencies obtained for various values of
 $Re$ are compared in figure 3(b), with the case
 $\omega =0$ singled out. The optimal value of
 $G$ gain over all
 $\omega$ values, i.e. the optimal gain, is also listed in the table 2 together with the values obtained with different mesh resolutions.
Optimal response for bulk-based forcing. (a) Optimal energy gain as a function of forcing angular frequency  $\omega$, given by the largest singular value of the resolvent operator (4.6). (b) Optimal gain across all
 $\omega$ values as a function of
 $Re$. Numerical resolution R0. The inset shows the optimal forcing angular frequency as listed in table 2.

Optimal forcing gain. The last column shows the optimal angular frequency  $\omega$ associated with the largest energy gain (the computations are performed with a step of 0.1 in angular frequency). Four mesh resolutions (see table 1) are used to find the optimal gain value. While for
 $Re\approx 250$ results can be considered as satisfactory for resolution R1, increased resolution is needed for larger
 $Re$. This is due to increasingly thin boundary layers required to resolve the optimal forcing mode.

For low  $Re<150$ the optimally amplified frequency is always
 $\omega =0$. This corresponds to a steady forcing
 $f$ in (2.1–2.4). Forcing a given flow at
 $\omega =0$ can be interpreted in different complementary ways. It can first be understood as the smooth
 $\omega \rightarrow 0$ limit of a given harmonic forcing at frequency
 $\omega$. It can also be understood, in the unforced problem, as the steady streaming component associated with the nonlinear self-interaction of arbitrary oscillatory perturbations (see e.g. Mantič-Lugo, Arratia & Gallaire Reference Mantič-Lugo, Arratia and Gallaire2014). In both cases the optimal response at
 $\omega =0$ is interpreted as an optimal steady mean flow correction, which justifies the special focus on
 $\omega =0$. As seen in figure 4 the most amplified steady forcing is always localised in the region near the axis. For
 $Re>1800$ it inherits the characteristics of the base flow in the sense that it is composed of two boundary layers and with an invariant core in between.
Azimuthal perturbation velocity  $u_{\theta }(r,z)$ for optimal forcing and optimal response for vanishing forcing frequency
 $\omega =0$. For
 $Re=70$ and 150 the optimal forcing at
 $\omega =0$ is also optimal across all
 $\omega$ values. The colour map spans 8 equal subintervals of
 $[0,0.5]$. Both optimal forcing and response are normalised such that
 $\| \hat {\boldsymbol {f}} \|_{\boldsymbol {Q}}=\| \hat {\boldsymbol {u}} \|_{\boldsymbol {Q}}=1$.

For  $Re\approx 150$ the optimally forced structures change radically as unsteady (
 $\omega \neq 0$) forcing takes over steady forcing. This is clearly seen in figure 3(b), where for
 $Re \gtrsim 150$ non-zero forcing frequencies
 $\omega$ start to dominate the optimal gain curve. The structure of the associated optimal forcing lies entirely within the Bödewadt layer, see figure 5, which focuses on
 $\omega \approx 1.7$ close to the optimal angular frequency (see table 2). For all velocity components these structures are tilted by the mean shear into the streamwise direction. While the amplitude of optimal forcing is similar in the three spatial components, the corresponding optimal response may differ from component to component (Jovanović & Bamieh Reference Jovanović and Bamieh2005), and in the present geometry it is clearly dominated by the azimuthal component. The signature of the circular rolls can be also seen in the azimuthal response although the corresponding structures should more realistically be labelled as azimuthal streaks. Their position (
 $r\approx 4\unicode{x2013}6$) is perfectly consistent with the experimental observations by Schouveiler et al. (Reference Schouveiler, Le Gal and Chauve2001) and the numerical studies of Lopez et al. (Reference Lopez, Marques, Rubio and Avila2009) and Do et al. (Reference Do, Lopez and Marques2010). Most importantly, and this constitutes one of the main findings of the current work, the optimal response is in the shape of circular rolls in the Bödewadt layer.
Optimal forcing and response for  $Re=250$. (a–f) Perturbation velocity components
 $u_r$,
 $u_{\theta }$ and
 $u_z$ for the optimal angular frequency
 $\omega =1.7$. The colour map spans 8 equal subintervals of
 $(-0.15\ 0.15)$ for the optimal forcing, and
 $(-0.6\ 0.6)$ for the optimal response plots. The optimal forcing and response are normalised such that
 $\| \hat {\boldsymbol {u}} \|_{\boldsymbol {Q}}=\| \hat {\boldsymbol {f}} \|_{\boldsymbol {Q}}=1$.

The evolution of the optimally forced structure is now described as  $Re$ increases beyond 250. It is first noted that, as shown in figure 3(b), the optimal gain
 $G_{opt}(Re)$ grows exponentially with
 $Re$. Other examples of an exponential scaling of gain include a backward-facing step (Blackburn, Barkley & Sherwin Reference Blackburn, Barkley and Sherwin2008) and an oscillatory pipe flow (Xu, Song & Avila Reference Xu, Song and Avila2021). We note that the experimental study of Gauthier et al. (Reference Gauthier, Gondret and Rabaud1999), performed for
 $\varGamma \approx 20$, has suggested a supercritical bifurcation as the origin of the observed rolls. Our observations do not corroborate this hypothesis since the angular frequency content of the response features that a continuum of frequencies can be excited externally, at odds with the dominant frequency stemming from a Hopf bifurcation. Moreover, the steep exponential increase of
 $G(Re)$ reported above might be responsible, in experimental conditions where external forcing stays uncontrolled, for the apparent bifurcating behaviour where the amplitude of the response increases rapidly with
 $Re$. As
 $Re$ continues to increase, as shown in figure 6 the optimal forcing evolves with
 $Re$ from a wide support within the Bödewadt layer to thinner structures in both the Bödewadt and the shrouding wall, and even, for
 $Re=3000$, also in the Ekman layer. For such high
 $Re$ values the respective supports of the forcing and the response are almost disjoint.
Azimuthal perturbation velocity  $u_{\theta }(r,z)$ for the optimal forcing and response for
 $\omega \neq 0$. For
 ${Re=250}$, 1800 and 3000 the optimal forcing is also optimal across all
 $\omega$ values. The colour map spans 8 equal subintervals of
 $(-0.15\ 0.15)$ for the optimal forcing and
 $(-0.6\ 0.6)$ for the optimal response.

The results above unambiguously point towards an unsteady response in the shape of circular rolls for all  $Re \gtrsim 150$. We emphasise that the crossing of the gain curves for
 $\omega =0$ and
 $\neq 0$ in figure 3(b) does not define a threshold value for
 $Re$ because, as for any linear receptivity mechanism, the response depends linearly on the spectral content of the forcing history. Defining a threshold value for
 $Re$ is demanding because it is highly dependent on the amplitude levels that an experimentalist can detect in practice. By focusing on the value of the optimal gain (
 $G=4.9\times 10^2$) at
 $Re=250$ the following evaluation can be made. Any parasitic vibration present in the experiment projected on the orthogonal basis of the optimal modes will have a non-zero component that will be optimally forced. If the amplitude of this component is, say, of order
 $O(10^{-2})$ it will be amplified by the linear mechanism by
 $\sqrt {G}\approx 20$ to yield an
 $O(10^{-1})$ response, which can be detected in experiments.
4.3. Boundary forcing
While the previous section offers an elegant formal manner to explain the circular rolls from (linear) optimality arguments, we note that, at the experimentally relevant values of  $Re$, the optimal forcing protocol corresponds to a force field that needs to be applied to the flow away from the solid boundaries. Set-up imperfections are expected to induce forcing at the boundaries rather than away from them. For this reason, it is unlikely that the observed linear response corresponds to truly optimal forcing, and it might be more relevant to concentrate on sub-optimal forcing. Instead, we consider a forcing protocol which without being energetically optimal affects directly the flow through unsteady motion of the boundaries (and is hence not a suboptimal from the previous bulk-based optimisation). Modulations of the instantaneous (dimensional) angular velocity are considered in the form
 $\varOmega (t)=\varOmega _0(1+A\ \varepsilon (t))$, where
 $\varepsilon (t)$ represents a normalised unsteady forcing and
 $A \ge 0$ is a measure of its amplitude. This is similar to Lopez et al. (Reference Lopez, Marques, Rubio and Avila2009), Poncet, Serre & Le Gal (Reference Poncet, Serre and Le Gal2009) and Do et al. (Reference Do, Lopez and Marques2010), except that
 $\varepsilon (t)$ is not monochromatic. The Reynolds number, now based on
 $\varOmega _0$ rather than
 $\varOmega$ (which depends on time), remains by definition unaffected by the value of
 $A$.
4.3.1. Time integration
The time modulation is simulated in practice by updating, at the end of each timestep after the prediction–projection step, the value of  $v_{\theta }$ imposed on the shroud and the rotor as
 \begin{equation} v_{\theta}(r,t)=r(1+A\ \varepsilon(t)). \end{equation}
The modulation  $\varepsilon (t)$ can be chosen in many ways. For most of this study, it is chosen as a Gaussian white noise of zero mean and standard deviation 1. The parameter
 $A$, which multiplies the white noise signal, is therefore the root mean square value of the forcing. All simulations are initiated with a zero perturbation field.
Figure 7 shows representative azimuthal velocity snapshots obtained from nonlinear time integration of the forced flow. As will be clear later in § 6, for the aspect ratio  $\varGamma =10$ and
 $Re<300$, nonlinearity plays a negligible role and the observations are independent of whether the time integration is linear or nonlinear. This is why those results are discussed in the context of linearly optimal results. The response to the unsteady white noise forcing is localised, for low
 $Re\approx 70$, next to the rotor and the shroud. For
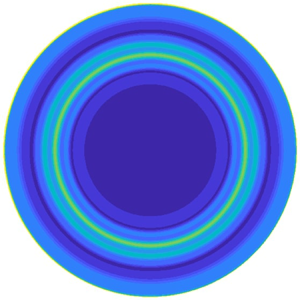
 $Re \gtrsim 150$ and beyond, wavetrains of increasingly smaller circular rolls form inside the Bödewadt layer, as is visible for
 $Re=250$ and
 $Re=400$.
Nonlinear time integration in the presence of white noise forcing at the  $z=0$ and
 $r=\varGamma$ boundary with amplitude
 $A=10^{-2}$. Snapshots of the azimuthal perturbation velocity
 $u_{\theta }(r,z)$. Panels show (a–d)
 ${Re=70},\ 150,\ 250,\ 400$. A wavetrain of circular rolls is seen for
 $Re>250$.

Interestingly, the response to boundary forcing is similar to the response to the optimal forcing in the sense that the response consists also of wavetrains of circular rolls located inside the Bödewadt layer. Due to the wide frequency content this response is, however, more widespread than in the case of optimal forcing (e.g. for  $Re=250$ the wavetrain is detected for
 $r\in (2,7)$). A pronounced response near the rotor and especially the shroud is also seen, as a signature of the imposed forcing.
4.3.2. Resolvent approach to boundary forcing
The connection between the linearised time integration and the resolvent approach from (4.4) is the Fourier transform of the linearised governing equations. Selecting the additive forcing term  $\hat {\boldsymbol {f}}$ corresponding to the forcing protocol of (4.12), and then solving (4.5) for
 $\hat {\boldsymbol {u}}$ will therefore yield directly the Fourier transform of the response. It can be in turn compared against the Fourier transform of the probe signals extracted from linearised time integration. The same analogy has been exploited by Cerqueira & Sipp (Reference Cerqueira and Sipp2014) in order to validate their input/output analysis. In our case, beyond immediate validation, this comparison is useful as it shows the quantitative consistency between boundary forcing (although based on linear time integration rather than the nonlinear integration allowing for spectral mixing) and the inherently bulk-based resolvent approach.
We therefore select a specific, non-optimal forcing term  $\boldsymbol {P}\hat {\boldsymbol {f}}$ corresponding to the Fourier transform of the boundary forcing (4.12). Solving (4.4) with prescribed
 $\boldsymbol {P}\hat {\boldsymbol {f}}$ yields
 $\boldsymbol {P}\hat {\boldsymbol {u}}$, the real part of which is plotted in figure 8. The (squared)
 $\boldsymbol {Q}$-norm of
 $\hat {\boldsymbol {u}}$ is shown in the same figure. Due to the forcing being suboptimal, its dependence on
 $\omega$ differs from the gain curve in figure 3(a). Again, starting with
 $Re=250$, a hump visible in figure 8(a) around
 $\omega =2$ marks the preferred response of the flow in the shape of rolls.
Response to the boundary forcing obtained by the resolvent approach in § 4.3.2. (a) The  $\boldsymbol {Q}$-norm (squared) of the velocity response. (b–e) Real part of
 $\hat {u}_{\theta }(r,z)$ for
 $\omega =2$ for
 $Re=70,\ 150,\ 250,\ 400$. The
 $\hat {\boldsymbol {u}}$ response is normalised so that
 $\| \hat {\boldsymbol {u}}\|_{\boldsymbol {Q}}=1$. Colour map spans
 $-0.3,(0.075),0.3$.

More insight into the preferred response frequencies of the flow is possible through the analysis of the probe signals extracted from linear time integration. The raw signals, corresponding to four radial positions  $r=1,3,5,7$ along the Bödewadt layer, are shown in figure 9(a). The forcing is again white in time with equal amplitude for each frequency. The Fourier transform of the probe signal confirms, as already visible from the fields in figures 7 and 8, that the strength of the response to boundary forcing depends on the radial position. The radially inwards flow in the Bödewadt layer suggests that the distance to the shrouding wall, and therefore the varying thickness of the boundary layer, are the physically meaningful variables to explain this dependency, as also suggested by Gauthier et al. (Reference Gauthier, Gondret and Rabaud1999) (we will, however, stick to the variable
 $r$ for commodity). The preferred response frequency evolves also with the radial position. It is close to
 $\omega =0$ for the probe at
 $r=1$, but close to
 $\omega =3$ for the probe
 $r=7$. The Fourier amplitude can be directly compared with the pointwise amplitude of
 $\hat {\boldsymbol {u}}$, as mentioned earlier. The convincing overlap of both data (see figure 9b) demonstrates the equivalence between the linear time integration and the direct resolvent solve based on (4.5).
Response to boundary forcing by Gaussian white noise with  $A=10^{-2}$,
 $Re=200$. (a) Time series of perturbation velocity
 $u_{\theta }$ obtained from time integration for different probes at varying
 $r$ inside the Bödewadt layer
 $z=0.9$. (b) Comparison between the time integration and the resolvent approach to boundary forcing in frequency space. Fourier amplitude spectrum of these time series (solid lines) vs
 ${|\hat {u}_{\theta }|}$ associated with boundary forcing, computed from resolvent analysis (dashed lines) and evaluated at the same spatial positions. Numerical parameters
 $dt=4\times 10^{-3}$,
 $nt=20\,000$,
 $d\omega =0.157$,
 $\omega _{Nyquist}=785$ corresponding to the timestep, number of timesteps, sampling angular frequency and Nyquist angular frequency (the highest angular frequency that can be reliably measured equals
 ${{\rm \pi} }/{dt}$), respectively. Only the later half of the signal was used for the calculation of the Fourier transform (
 $40< t<80$).

An agreement between current results and the numerical study of Do et al. (Reference Do, Lopez and Marques2010) is noted when comparing figures 9 and 6 from Do et al. (Reference Do, Lopez and Marques2010). Both spectra are characterised by a broad curve centred around  $\omega =2.4$. The position of the rolls around the mid-radius of the cavity also agrees while comparing figures 8 and 5 from Do et al. (Reference Do, Lopez and Marques2010).
4.4. Computation of the pseudospectrum
A fundamental tool in the analysis of non-normal systems is the pseudospectrum, which is a generalisation of the concept of the (eigen)spectrum. Recall that the spectrum of the linearised system  $\dot {\boldsymbol{q}}=\boldsymbol {L}\boldsymbol{q}$ is the (complex) set of eigenvalues of the associated linear operator. If a complex number
 $\omega$ belongs to the spectrum
 $\sigma$, the resolvent
 $({\rm i}\omega \boldsymbol {I}-\boldsymbol {L})^{-1}$ (or expressed in the present case by (4.6)) is undefined, whereas it is continuous and smooth as a function of
 $\omega$ in the immediate neighbourhood of its pole at
 ${\rm i}\omega$. Following Trefethen & Embree (Reference Trefethen and Embree2005) the
 $\varepsilon$-pseudospectrum
 $\sigma _{\varepsilon }$ is defined as the complex set where the norm of the resolvent operator exceeds a given value
 $\varepsilon ^{-1}$, with
 $\varepsilon$ a potentially small real number
 \begin{equation} \sigma_{\varepsilon}=\{\omega \in \mathbb{C}, \| \boldsymbol{R} \|_{\boldsymbol{Q}}>\varepsilon^{{-}1}\}. \end{equation}
It includes the point spectrum and can be seen as its generalisation. In the current work, it is mainly used as an indicator of the strong non-normality of the underlying linearised operator. Owing to the definition 4.13, the cut of the pseudospectrum through the real axis directly yields the gain curves plotted in figure 3. The pseudospectrum is computed at each point, analogously to the optimal gains described in § 4.1, except that  $\omega$ is allowed to be complex. Note that such computations rely on the shift-and-invert algorithm, itself dependent on a shift parameter
 $s$. Contours of the pseudospectrum are reported in figure 10. As expected for a strongly non-normal operator, the isocontours of
 $\sigma _{\varepsilon }$ do not form concentric circles around the eigenvalues yet the contours encircle more than one eigenvalue. Still, very close locally to a given eigenvalue, the isocontours found for
 $Re=200$ form closed loops around specific eigenvalues, as can be seen in the top right panel in figure 10. Upon increasing
 $Re$, the non-normality of the linearised operator increases and the background level in the pseudospectrum grows, as shown in figure 10.
Pseudospectrum levels  $\log _{10}\| \boldsymbol {R} \|_{\boldsymbol {Q}}$ in the complex plane where
 $\lambda _r$ and
 $\lambda _i$ are the real and imaginary parts of the complex number
 ${\rm i}\omega$. Panels show (a,b)
 $Re=200$, (c,d)
 $Re=3000$. The right plots correspond to the red insets in the left plots, where three different values of the shift
 $s$ in the shift-and-invert algorithm have been used.

Another useful piece of information from the pseudospectra is the sensitivity of an eigenvalue to arbitrary perturbations of the operator  $\boldsymbol {L}$ (Cerqueira & Sipp Reference Cerqueira and Sipp2014; Brynjell-Rahkola et al. Reference Brynjell-Rahkola, Shahriari, Schlatter, Hanifi and Henningson2017). As shown in chapter 28 of Trefethen & Embree (Reference Trefethen and Embree2005) for a convection–diffusion operator, high levels of non-normality typically cause iterative Arnoldi methods to converge to false eigenvalues. This is easily verified by comparing the effect of different shift values
 $s$ in the shift–inverse Arnoldi iteration. Here, as in Cerqueira & Sipp (Reference Cerqueira and Sipp2014), a very large level of pseudospectral contours, typically above 11, prevents ARPACK from accurately converging all the eigenvalues. This algorithmic sensibility is not only a numerical convergence problem, it also highlights a physically ambiguous situation. Individual eigenvalues, when they are not robust, do not yield a specific contribution to the dynamics. In particular, the associated eigenfrequencies are not resonant, and a large response to forcing is obtained even for forcing frequencies far from the eigenfrequencies (Trefethen et al. Reference Trefethen, Trefethen, Reddy and Driscoll1993). This is associated with the presence of a large hump (rather than narrow peaks) in the gain curve. In such a case, frequent in shear flows such as jets or boundary layers, one speaks of pseudo-resonance, see e.g. Garnaud et al. (Reference Garnaud, Lesshafft, Schmid and Huerre2013). Non-robust eigenvalues are easily spotted as soon as their location in the complex plane depends on the shift
 $s$ chosen by the user, see figure 10(d). Conversely, the most unstable eigenvalue
 $\lambda _r=0.011,\ \lambda _i=1.95$ at
 $Re=3000$ in figure 10 can be trusted, and the growth rate
 $\lambda _r$ predicted by the computation of the eigenvalues will correspond to the growth rate of instability upon time linearised integration.
Finally, the pseudospectra can also be post-processed to extract a lower bound on the maximal transient growth associated with given initial perturbations. Following chapter 14 in Trefethen & Embree (Reference Trefethen and Embree2005), the Kreiss constant is the lower bound of the maximal growth of the initial perturbation and is defined by
 \begin{equation} \mathcal{K}=\sup_{\varepsilon>0}\frac{\alpha_{\varepsilon}}{\varepsilon}, \end{equation}
where  $\alpha _{\varepsilon }$ is the pseudospectral abscissa (the maximal real part of the
 $\varepsilon$ contour in the complex plane). Computation of
 $\mathcal {K}$ for the pseudospectra in figure 10 gives
 $\mathcal {K}_{Re=200}=1.4\times 10^3$ and
 $\mathcal {K}_{Re=3000}=2.2\times 10^8$, suggesting very large growth potential, as demonstrated by Daube & Le Quéré (Reference Daube and Le Quéré2002) and Gesla et al. (Reference Gesla, Duguet, Le Quéré and Martin Witkowski2024) for the same set-up.
5. Experimental comparison
In this section, an effort is made to reproduce the experimental conditions where axisymmetric rolls were reported. A detailed comparison with the literature results can be challenging because of the many different configurations of the rotor-stator systems reported in the literature. Apart from the value of the aspect ratio  $\varGamma$, special attention has to be given to whether or not the shroud is rotating and whether the cavity extends or not to the axis. The latter case corresponds to the presence of a hub. Relevant experimental studies of the rotor-stator configuration at moderate aspect ratio
 $\varGamma$ (from around 5 to around 20) are listed below:
(i) Gauthier (Reference Gauthier1998), with a rotating shroud and no hub, reports circular rolls at
 $Re\approx 70$ for $\varGamma =20.9$ and at $Re\approx 180$ for $\varGamma =10$.
(ii) Schouveiler et al. (Reference Schouveiler, Le Gal and Chauve2001) with a fixed shroud and no hub, reports circular rolls for a range of
$\varGamma$, in particular at $Re\approx 160$ (deduced from figure 3 (Schouveiler et al. Reference Schouveiler, Le Gal and Chauve2001) for $\varGamma =10$).(iii) Poncet et al. (Reference Poncet, Serre and Le Gal2009) with a fixed shroud and a rotating hub, reports circular rolls at
$Re=160$ for $\varGamma =8.8$.


Numerical studies do not report sustained circular rolls in the absence of external forcing (Lopez et al. Reference Lopez, Marques, Rubio and Avila2009; Poncet et al. Reference Poncet, Serre and Le Gal2009), with the exception of Daube & Le Quéré (Reference Daube and Le Quéré2002), who considered larger  $Re$ values.
We focus specifically on the article by Schouveiler et al. (Reference Schouveiler, Le Gal and Chauve2001) and the corresponding parameters. The aspect ratio is hence temporary set to  $\varGamma =8.75$, the shroud is fixed and the range of values of
 $Re$ (0:300) is selected. Unsteady nonlinear simulations with boundary forcing are performed with three different forcing protocols. The main difficulties in comparing numerics with experiments are the fact that (i) the amplitude of the forcing is unknown and (ii) the temporal frequency spectrum of the forcing is often unknown. Three qualitatively different types of forcing have hence been considered here: monochromatic forcing, analogously to Do et al. (Reference Do, Lopez and Marques2010), with specific forcing frequency
 $\omega =1$; harmonic forcing, where only harmonics of
 $\omega =1$ are considered; and eventually white noise forcing. In the case of harmonic forcing all the temporally resolvable harmonics of the disc angular frequency are forced with equal amplitude. This type of forcing is especially relevant to the experimental comparison: as shown in both Gauthier et al. (Reference Gauthier, Gondret and Rabaud1999) and Faugaret (Reference Faugaret2020), the main spurious perturbations present in the experimental set-up are the disc harmonics. The studies of the forced regimes focused mostly on monochromatic forcing (Gauthier et al. Reference Gauthier, Gondret and Rabaud1999; Lopez et al. Reference Lopez, Marques, Rubio and Avila2009; Do et al. Reference Do, Lopez and Marques2010).
For these three forcing protocols an  $r$-dependent observable needs to be monitored for all times. We select the observable
 $E(r,t)$ defined as
 \begin{equation} E(r,t)=\int_{\delta}^1((u_r)^2+(u_{\theta})^2+(u_z)^2) \, {\rm d}z, \end{equation}
where  $\delta =0.2$ (in units of
 $H$) corresponds to integrating over 4/5 of the interdisc spacing (thereby excluding the parallel boundary layer along the rotor). This parameter
 $\delta =0.2$ is preferred over
 $\delta =0$ for the clarity of the resulting space–time diagrams. The results for the three type of forcing are presented in figure 11. All figures are accompanied by a snapshot of the same energy
 $E(r,t)$ at arbitrary time, seen from above in order to emphasise the visual comparison with experimental photographs. The three types of forcing all lead to wavetrains of circular rolls with
 $E$ locally stronger in the interval
 $0.34\le r \le 0.6$ (radius non-dimensionalised with
 $R$ for consistency with Schouveiler et al. Reference Schouveiler, Le Gal and Chauve2001). The rolls reaching closest to the axis correspond to monochromatic forcing, while the front seems to remain further from the axis when the spectral content of the forcing is richer. The radial velocity of the rolls is always negative (oriented towards the axis) and can be estimated directly from the space–time diagrams. Even in the monochromatic case, their velocity is not constant and it depends on
 $r$: since the Bödewadt layer thickens as the perturbations migrate towards the axis where the radial velocity vanishes, the phase velocity of the rolls has to decrease, until the rolls can no longer be sustained. The space–time diagram for the monochromatic case, qualitatively similar to figure 11(a) in Do et al. (Reference Do, Lopez and Marques2010), illustrates this point particularly well. In the harmonic case, the coexistence of different frequencies leads to different radial velocities being possible at a given radius. The dynamics becomes more complex since rolls can now travel at different velocities, leading to consecutive rolls merging or splitting. The pattern shown in figure 11(c,d), which shows periodic pairing and merging near
 $r \approx 0.75$, resembles in particular the experimental pattern shown in figure 6 in Schouveiler et al. (Reference Schouveiler, Le Gal and Chauve2001) at the same value of
 $Re$. It also shares some similarity with the dynamics reported in figure 11(b) of Do et al. (Reference Do, Lopez and Marques2010) where the forcing is only monochromatic but harmonics in the response are generated by nonlinearity. As for the white noise forcing protocol, pairing and merging events appear more intermittently amidst otherwise periodic roll propagation.
Energy integral  $E(r,t)$ at
 $Re=225$,
 $\varGamma =8.75$. Time is non-dimensionalised by the disc rotation period. An initial transient was neglected. Excited rolls travel inwards with a radial phase speed depending on the radius. (a,b) Mono-frequency forcing at angular frequency
 $\omega =1$. No merging and pairing of the rolls is observed. (c,d) Harmonic frequency
 $\omega =1, 2, 3,\ldots$ forcing. Pairing and merging of the rolls is observed here. Rolls merge because the phase speed depends on the radial position and the roll frequency
 $\omega$. (e, f) White noise forcing. Complex roll dynamics is observed due to all frequencies being excited by the forcing.

The perfect agreement of the localisation of the rolls and the corresponding space–time diagram with the experimental results of Schouveiler et al. (Reference Schouveiler, Le Gal and Chauve2001) both reinforce the interpretation of circular rolls as the preferred response of the system to external forcing.
6. Nonlinear receptivity
Receptivity to external disturbances in fluid flows is traditionally investigated using linear resolvent analysis, which is usually justified by the small perturbation velocities at play. This has the huge advantage that the responses to individual frequencies can be used as a basis to describe the global response to arbitrary forcing. Extensions of this formalism to finite-amplitude perturbations lead to new mathematical difficulties. Early efforts have focused on generalising the parabolised stability equations (Bertolotti, Herbert & Spalart Reference Bertolotti, Herbert and Spalart1992; Herbert Reference Herbert1997), which unfortunately is not an option for recirculating flows. A recent attempt to add nonlinear triadic interactions to the resolvent formalism was recently proposed by Rigas, Sipp & Colonius (Reference Rigas, Sipp and Colonius2021) for boundary layer flow. For the rotor-stator flow the importance of nonlinear interactions in the dynamics of the circular rolls was already pointed out by Do et al. (Reference Do, Lopez and Marques2010), who measured a non-zero mean flow correction due to self-interaction of the unsteady rolls. Moreover, strictly nonlinear structures (i.e. without any linear counterpart) have been determined numerically for the unforced problem by Gesla et al. (Reference Gesla, Duguet, Le Quéré and Martin Witkowski2024). It is legitimate to enquire whether they can also be detected in the forced problem, at least in the presence of large enough forcing amplitudes. In the present section, we revisit the nonlinear time integrations from § 4 for a larger range of the parameters  $A$ (forcing amplitude) and
 $Re$.
6.1. Effect of the nonlinearity
We begin by describing the effect of increasing the forcing amplitude on the gain curves, such as displayed in figure 9(b). Since nonlinear effects are expected to become more important with increasing  $Re$, we first illustrate their effect by choosing two representative values of
 $Re=600$ and
 $2100$. Rather than choosing two different values of the forcing amplitude in (4.12), we choose only one such value
 $A=10^{-2}$ and compare respectively linear and nonlinear temporal simulations started from the same initial condition
 $\boldsymbol{u}(t=0)=0$. The case of
 $Re=600$ is investigated in figure 12 while
 $Re=2100$ is analysed in figure 13. For
 $Re=600$, time series taken from probes located in the Bödewadt layer reveal visually no difference between linear and nonlinear simulations. The Fourier transforms of these signals, interpretable as local gain curves, reveal, however, that the fastest scales (large
 $\omega \gtrsim 4$) are affected by nonlinear effects at least for the radii
 $r=3$ and
 $5$. At other radii neither the fast nor the slow scales are affected by nonlinearity. For
 $Re=2100$, the situation is clearer: the velocity time series look very different and their Fourier transforms, unsurprisingly, differ at all radial locations. In all cases nonlinearity manifests itself by a slower, exponential-like decrease of the Fourier amplitudes with increasing
 $\omega$, interpretable as a cascade in frequency space. It is also nonlinear interactions between the frequencies that are responsible for the irregular shape of the spectrum. This is because the timestep in the simulation cannot be commensurate with all frequencies present in the forcing.
Comparison of linear and nonlinear time integrations for  $Re=600$, numerical resolution R1. (a,b) Perturbation azimuthal velocity
 $u_{\theta }$ at location (
 $r=5$,
 $z=0.9$) from linear (a) and nonlinear time integration (b). (c) Corresponding spectrum of nonlinear (solid lines) and linear (dashed lines) velocity signal at
 $z=0.9$ for various
 $r$.

Comparison of linear and nonlinear time integrations for  $Re=2100$, numerical resolution R1. (a,b) Perturbation azimuthal velocity
 $u_{\theta }$ at location (
 $r=5$,
 $z=0.9$) from linear (a) and nonlinear time integration (b). (c) Corresponding spectrum of nonlinear (solid lines) and linear (dashed lines) velocity signal at
 $z=0.9$ for various
 $r$.

Our goal is now to map in a  $(A,Re)$ diagram the different behaviours encountered in the simulations, whether linear or nonlinear. The followed strategy is illustrated in figure 14 by focusing on
 $Re=2100$. The time series corresponding to the observable
 $\| \omega _{pert} \|$ defined by
 \begin{equation} \| \omega_{pert} \|=\sqrt{\iint \vert\omega -\omega_{b}\vert^2 r \,{\rm d}r \,{\rm d}z}, \end{equation}
where  $\omega$ is the azimuthal vorticity and
 $\omega _b$ that of the base flow, are shown in figure 14(a) in logarithmic scale, and in figure 14(b) in linear scale, for an amplitude
 $A$ spanning 6 decades from
 $A=10^{-12}$ to
 $A=10^{-6}$ (a) and 6 decades from
 $A=10^{-7}$ to
 $A=10^{-1}$ (b). For
 $A$ from
 $A=10^{-12}$ to
 $A=10^{-8}$, the time series in figure 14(a) differ only by their amplitude, which turns out to be proportional to the value of
 $A$. For larger
 $A=10^{-7}$ and especially
 $10^{-6}$, the time series change aspect and their amplitude no longer follows
 $A$ linearly. Note that the logarithmic scale is essential for this assessment, by comparison figure 14(b) is much less easy to interpret than figure 14(a).
Global observable  $\| \omega _{pert} \|$ in nonlinear time integration at
 $Re=2100$ for varying forcing amplitude
 $A$. The values of
 $A$ are indicated both in the legend and in the plot for simplicity. Starting from
 $A=10^{-7}$ nonlinear effects are observed. For
 $A\geq 10^{-6}$ the observable jumps to a different level corresponding to the presence of a non-trivial top branch solution.

This analysis can be repeated for different values of  $Re$. In figure 15(a), the time-averaged
 $\| \omega _{pert} \|$ is plotted directly vs the forcing amplitude
 $A$. This representation allows for a direct assessment of the parameter values for which
 $\| \omega _{pert} \|$ scales linearly with
 $A$, which suggests linear receptivity. All the points lying away from the related straight lines are labelled as nonlinear in the
 $(A,Re)$ map of figure 15(b). Beyond the simple linear/nonlinear labelling, we note that, for the three largest values of
 $Re=2100$,
 $2400$ and
 $2700$ in figure 15(a), the observable
 $\| \omega _{pert} \|$ saturates with increasing
 $A$ to an almost constant level. This suggests that the final state of the simulation is the same whatever
 $A$, in other words that the forced system is attracted towards a different region of the state space for at least
 $Re \gtrsim 2100$. A non-trivial chaotic attractor was reported, for the same parameters, for the unforced problem, by Daube & Le Quéré (Reference Daube and Le Quéré2002) and Gesla et al. (Reference Gesla, Duguet, Le Quéré and Martin Witkowski2024), for
 $Re \gtrsim 1800$. This attractor is different from the laminar one and it has a different attraction basin in terms of initial condition. There is little doubt that the same attracting chaotic state is identified here in the presence of strong amplitude forcing (the initial condition being fixed). A closer zoom on the figure, especially in linear scale, would show that the saturated value of the observable depends weakly on
 $A$, which suggests that the associated attractor is gently sensitive to the unsteady forcing. When such an attractor is reached, the corresponding point
 $(A,Re)$ in the map of figure 15(b) changes from red to blue. The points that are red correspond to the values of
 $(A,Re)$ where nonlinear effects do bend the gain curves (panel a), but no finite-amplitude state is present and thus no saturation to any non-trivial state can occur. This leads to a 3-colour cartography of the parameter space
 $(A,Re)$ for the chosen forcing protocol parameterised by the amplitude parameter
 $A$. The notion of double threshold, popular in the shear flow transition community (Grossmann Reference Grossmann2000), appears here in both
 $A$ and
 $Re$ (rather than in initial perturbation amplitude and
 $Re$), for a forced rather than unforced problem. The boundary between linear and nonlinear behaviour in 15(b) is consistent with an approximate fit of the form
 $A=O(Re^{-\alpha })$, with
 $\alpha \approx 10$. This large value of
 $\alpha$ is the signature of a very steep boundary. As for the boundary between red (nonlinear) and blue (non-trivial saturation), the present data do not suggest any simple fit. Besides the dataset is known to end at
 $Re \approx 3000$, beyond which all points are blue because the base flow is linearly unstable and the turbulent state is the only attractor left (Gesla et al. Reference Gesla, Duguet, Le Quéré and Martin Witkowski2024). Rather than a cartography in the
 $(A,Re)$ plane, where
 $A$ is specific to a given forcing protocol, we plot in figure 16 the time-averaged observable
 $\overline {\| \omega _{pert} \|}$ vs
 $Re$, the value of
 $A$ being treated implicitly. The data are represented using the same colour coding as the preceding figure, both in linear (a) and in logarithmic scales (b). In both plots the data corresponding to the non-trivial top and lower branches (i.e. edge states) obtained in Gesla et al. (Reference Gesla, Duguet, Le Quéré and Martin Witkowski2024) are also superimposed for clarity (the same observable was used, see their figure 19). The two upper and lower branches from the unforced problem were reported to merge in a saddle-node bifurcation at
 $Re=Re_{SN} \approx 1800$. Interestingly, none of the red or blue data points, which correspond to the unforced problem, fall in the gap between the lower and upper branches. This suggests that the data from the deterministic problem can be used to delineate between the two types of response, even in the presence of a finite-amplitude forcing. The panel (b) of the figure shows the same data in logarithmic scale. There, for the choice of this observable, the boundary between linear and nonlinear behaviour obeys an approximate power-law scaling
 $\overline {\| \omega _{pert} \|}=O(Re^{-\beta })$, with
 $\beta \approx 3.88$.
(a) Mean observable value  $\overline {\| \omega _{pert} \|}$ as a function of forcing amplitude
 $A$. The linear regime is indicated using open symbols whenever the slope of the line is at most 1 % different from 1. For
 $Re\geq 2100$ the mean observable value level jumps to the top-branch level for strong enough forcing amplitudes. (b) Amplitudes corresponding to linear and nonlinear regime indicated respectively with green and red symbols. The top branch is reached for
 $Re>1800$ whenever
 $\overline {\| \omega _{pert} \|}>5$.

(a) Mean observable value  $\overline {\| \omega _{pert} \|}$ as a function of
 $Re$. The data corresponding to the chaotic solutions from Gesla et al. (Reference Gesla, Duguet, Le Quéré and Martin Witkowski2024) are superimposed in respectively blue (top branch) and pink (for the edge branch). Same colour coding as in the previous figure. (b) Same data plotted on logarithmic scales.

6.2. Leaky chaotic attractors and finite lifetime dynamics
From the previous subsection, we know that forcing the nonlinear problem with a sufficiently large amplitude leads, for  $Re$ above
 $Re_{SN} \approx 1800$, to a response different from the response triggered at lower forcing amplitudes. The difference is attested for global observables such as in figure 14 and it is also clear from local velocity probes, as shown in figure 17 for
 $Re=2100>Re_{SN}$. In panel (a), low amplitude values
 $A \le 10^{-7}$ (corresponding to green points in figure 15) lead to a disordered response whose diameter increases (linearly) with the value of
 $A$. In panel (b), only values of
 $A \ge 10^{-6}$ are displayed and it is apparent again, especially from the numbers along the axes, that the response depends weakly on
 $A$. This last point suggests the existence of an attracting state independent of
 $A$, in other words, a deterministic attractor, solution of the forced problem, identical to the top-branch solutions identified by Gesla et al. (Reference Gesla, Duguet, Le Quéré and Martin Witkowski2024). Similar conclusions can be drawn for all
 $Re$ larger than 2100, including the supercritical values larger than
 $Re_c\approx 3000$ when only the non-trivial attractor is stable.
Two-dimensional state portrait  $(u_r,u_z)$ from a velocity probe located
 $(r=5, z=0.9)$ at
 $Re=2100$. The width of the state portraits increases linearly with the forcing amplitude for
 $A\leq 10^{-7}$. For
 $A\geq 10^{-6}$ state portraits lose their elliptic shape. The centre of mass of the state portrait also shifts away from 0, indicating strong nonlinear interaction.

Departures from this picture can, however, be noted at lower  $Re$ close to (but above)
 $Re_{SN}$. Figure 18 shows the outcome of several temporal simulations of the unforced problem for
 $Re=1840$, focusing on the time series of
 $\| \omega _{pert} \| (t)$. These time series demonstrate that the chaotic behaviour lasts for a finite time only, after which the observable rapidly reaches zero, indicating a return to the base flow. Some of the measured lifetimes are much longer than the duration of the return to the base flow, which justifies the label supertransient (Lai & Tél Reference Lai and Tél2011). The statistics of the lifetimes have been gathered over many such realisations of the deterministic problem, all initialised by different velocity fields drawn randomly. The cumulative distributions of the lifetimes
 $P(T>t)$, where
 $T$ is the lifetime, are shown in figure 19 for several values of
 $Re$ between 1800 and 1860. The distributions all look exponential for up to two decades, which suggests a memoryless process (Bottin & Chaté Reference Bottin and Chaté1998).
Time series of  $\| \omega _{pert} \|(t)$ for
 $Re=1840$, unforced problem. Random initial perturbations of amplitude
 $8\times 10^{-3}$ added to the
 $u_{\theta }$ component. Four different initial conditions lead to four different lifetime values.

Cumulative distribution function  $P(T>t)$ for the lifetime
 $T$. Here,
 $P$ is estimated as the fraction of runs that did not relaminarise in the time interval
 $(0:t)$. Relaminarisation is decided whenever
 $\| \omega _{pert} \|<10^{-3}$. For each value of
 $Re$, simulations with different random initial perturbations were conducted.

As noted by Avila, Willis & Hof (Reference Avila, Willis and Hof2010), the perturbations need a certain time  $t_0$, before they reach a leaky attractor. The mean lifetime
 $\tau$ of only these perturbations that have reached the leaky attractor can be computed by discarding all of the simulations that relaminarised before the time
 $t_0$
 \begin{equation} \tau(t_0)=\langle t-t_0 \,|\, t>t_0\rangle, \end{equation}
where  $\langle {\cdot }\rangle$ stands for the mean. Here,
 $\tau (t_0)$, which is a constant function of
 $t_0$, is a characteristic feature of a memoryless process.
In case of relaminarisation of every simulation out of  $r$ total simulations, the maximum likelihood estimator (MLE) of
 $\tau$ can be computed using
 \begin{equation} \tau=\frac{1}{r}\sum_{i=1}^rt_i, \end{equation}
where  $t_i$ is the relaminarisation time of individual simulations. However, because of the finite numerical integration time, not all simulations relaminarise. To account for the perturbations whose lifetime exceeds a censoring time
 $t_r$, the MLE is modified as (Lawless Reference Lawless2003)
 \begin{equation} \tau=\frac{1}{r}\left( \sum_{i=1}^rt_i+(n-r)t_r\right), \end{equation}
with  $r$ the number of simulations that relaminarised and
 $n$ the total number of simulations. A 95 % confidence interval of the estimator (6.4) is
 \begin{equation} \tau \times \left[ \frac{2r}{\chi^2_{2r,0.975}},\frac{2r}{\chi^2_{2r,0.025}}\right], \end{equation}
where  $\chi ^2_{m,p}$ is the
 $p$th quantile of the chi-squared distribution with
 $m$ degrees of freedom. The total number of simulations performed for each
 $Re$, together with
 $t_0$, the escape rate from the saddle
 $\kappa$ (Tél & Lai Reference Tél and Lai2008), its confidence interval and a corresponding
 $\tau$, are all reported in table 3. The dependence of
 $\kappa$ on
 $t_0$ and
 $Re$ is shown in figure 20. Linear dependence
 $\log (\kappa (Re))$ would suggest an exponential scaling of the mean lifetime as a function of
 $Re$, at least over the interval in
 $Re$ where the data were gathered (which lies well below the linear instability threshold).
Statistics of lifetimes. For each value of  $Re$,
 $r$ is the number of simulations out of total
 $n$ to relaminarise before the censoring time
 $t_r=7800$. The distribution of lifetimes is approximately exponential for
 $t>t_0$. The MLE of a mean lifetimes is computed using (6.4) and its confidence interval using (6.5). The escape rate from the saddle
 $\kappa =1/\tau$ and its confidence interval are plotted in figure 20.

(a) Escape rate  $\kappa (t_0)$ for
 $Re=1800$ and
 $Re=1810$. The exponential distribution is reached when
 $\kappa$ is independent of
 $t_0$, which can be assumed for
 $t_0>800$ when
 $Re=1800$, and for
 $t_0>850$ when
 $Re=1810$. (b) Dependence of
 $\kappa$ on
 $Re$. The fits in the figure are
 $\exp (-6.97\times 10^{-2}Re+ 1.2\times 10^{2})$ (red) and
 $\exp (-\exp (9.13\times 10^{-3}Re -1.5\times 10^{1}))$ (blue), suggesting super-exponential dependence on
 $Re$.

The whole situation is reminiscent from the finite probabilities to relaminarise in 3-D turbulence in wall-bounded shear flows, notably the case pipe flow, where lifetimes were reported to increase super-exponentially with  $Re$ (Hof et al. Reference Hof, De Lozar, Kuik and Westerweel2008). For the case of pipe flow, the issue of whether lifetimes truly diverge at a finite value of
 $Re$ or stay finite was solved by remarking that another competing phenomenon, namely turbulence proliferation, would outweigh turbulence decay above some threshold in
 $Re$ (Avila et al. Reference Avila, Moxey, De Lozar, Avila, Barkley and Hof2011) and keep turbulence alive for all times. There is no such equivalent here in axisymmetric rotor-stator flow, for which a scenario where lifetimes are always finite is a possibility below the threshold of linear stability of the base flow
 $Re_c\approx 3000$ (Daube & Le Quéré Reference Daube and Le Quéré2002). Nevertheless, the values of
 $T$ found in practice are so large that they usually exceed the observation times allowed for. In other words, the hypothesis that the invariant set underlying the existence of non-trivial dynamics in the forced problem is a deterministic attractor is only here for commodity: mathematically speaking, it could possibly be a leaky attractor i.e. a chaotic saddle (Lai & Tél Reference Lai and Tél2011).
7. Conclusions and outlooks
The present numerical investigation has focused on closed axisymmetric rotor-stator flow as a prototype flow for the study of receptivity. Motivated by the riddle about the origin of the dynamical circular rolls observed in several experiments (Savas Reference Savas1987; Gauthier et al. Reference Gauthier, Gondret and Rabaud1999; Schouveiler et al. Reference Schouveiler, Le Gal and Chauve2001), both linear and nonlinear receptivity theories were invoked to investigate how the flow responds to an additive forcing of external origin. Several types of forcing were considered, each with its pros and cons. Forcing applied to the bulk of the fluid lends itself well to linear optimal response theory (Schmid & Brandt Reference Schmid and Brandt2014). If a wide frequency spectrum is forced, pseudo-resonance linked with non-normal effects (Trefethen & Embree Reference Trefethen and Embree2005) will amplify more the frequencies contained in the large hump in the gain curve in figure 9. Such frequencies invariably lead to circular rolls inside the Bödewadt layer developing along the stator. Forcing applied through motion of the boundaries is by design not optimal, however, it is more realistic in the case of closed flows, and can easily be extended to a nonlinear framework. Increasing the amplitude of the forcing at high enough  $Re$ unambiguously leads to a different, more complex nonlinear state which coexists with the simpler forced base flow. Although both states are characterised by circular rolls on the stator, we argue that the rolls reported in the experiments of Schouveiler et al. (Reference Schouveiler, Le Gal and Chauve2001) are a linear response to external forcing and not a self-sustained state like those found by Gesla et al. (Reference Gesla, Duguet, Le Quéré and Martin Witkowski2024). This is consistent with the observation that these rolls disappear rapidly should the forcing be suddenly turned off (Lopez et al. Reference Lopez, Marques, Rubio and Avila2009; Do et al. Reference Do, Lopez and Marques2010). Moreover, a particularly striking match with the experiment of Schouveiler et al. (Reference Schouveiler, Le Gal and Chauve2001) was found when the forcing features only harmonics of the rotor's main angular frequency, with complex features such as the pairing and merging of vortices well reproduced numerically. The circular rolls observed experimentally can hence be described as noise sustained, with the subtlety that they are not the response to incoherent noise but rather to a forcing with well-organised frequency content typical of rotating machinery.
The present study is fully axisymmetric, which implies that only axisymmetric modes are involved in the generation of the circular rolls. This excludes other scenarios involving non-axisymmetric modes, for instance triadic instabilities featuring the interaction of a given non-axisymmetric mode with its complex conjugate. A possible extension of our work would allow for non-axisymmetry already at the linear level. The resulting resolvent matrix would then depend on an additional azimuthal wavenumber  $m$ and the optimally forced structures would have to be identified in a 2-D parameter space
 $(\omega,m)$. When the time integration of the forced system is concerned a 3-D time integration code would be necessary to study the response of the flow to the boundary forcing. While it is theoretically possible that 3-D structures are more amplified that the axisymmetric ones, the experimental (Gauthier et al. Reference Gauthier, Gondret and Rabaud1999) and numerical (Do et al. Reference Do, Lopez and Marques2010) evidence suggests that the response of the forcing is in the form of circular rolls, supporting the axisymmetric assumption.
As far as the larger picture is concerned, although linear receptivity is the starting point for transition theory based on an input–output picture, any theory aiming at predicting the onset of a bistable dynamics needs to be nonlinear. Extending the resolvent formalism to incorporate nonlinear interactions is a possibility (Rigas et al. Reference Rigas, Sipp and Colonius2021). A clearer connection between theories of nonlinear global modes in spatially developing flows (Pier & Huerre Reference Pier and Huerre2001) and the dynamical systems framework would also be welcome.
Acknowledgement
The authors wish to thank anonymous referees for suggestions, in particular the super-exponential fit of the lifetimes.
Declaration of interests
The authors report no conflict of interest.



