INTRODUCTION
Jellyfish blooms have become almost synonymous with degradation of coastal marine ecosystems in the science media (Dybas, Reference Dybas2002; www.shiftingbaselines.org/videos/index.html). Jellyfish blooms are considered a symptom of species introduction, over-fishing, eutrophication, and climate change (Mills, Reference Mills2001; Purcell, Reference Purcell2005; Hay, Reference Hay2006). They may cause or exacerbate ecosystem degradation by, for example, depleting ichthyoplankton and holozooplankton through competition and predation (Purcell & Arai, Reference Purcell and Arai2001; Purcell, Reference Purcell2005). Jellyfish blooms interfere with commercial fisheries (e.g. James et al., Reference James, Vivekanandan and Srinivasarengan1985), tourism, and coastal power production (e.g. Rajagopal et al., Reference Rajagopal, Nair and Azariah1989) and, consequently, their effects are widely considered to be predominantly negative (Purcell, Reference Purcell2005).
The caricature of jellyfish blooms as a sign of ailing seas (e.g. Dybas, Reference Dybas2002; www.shiftingbaselines.org/videos/index.html), however, hides many complexities. Not all blooms are ‘true blooms’ (i.e. the result of rapid growth of jellyfish populations in situ); ‘apparent blooms’, which for clarity we will refer to as aggregations, result from the redistribution or redispersion of a stable population (Graham et al., Reference Graham, Pagès and Hamner2001). Moreover, true jellyfish blooms are a natural consequence of their life-history strategies (Graham et al., Reference Graham, Pagès and Hamner2001; Mills, Reference Mills2001; Purcell, Reference Purcell2005; but see Goy et al., Reference Goy, Morand and Etienne1989 for a species that blooms despite its atypical life-history) and in some cases can therefore be expected to perform important ecosystem services. Jellyfish blooms have positive economic outcomes for scyphozoan fisheries (Purcell, Reference Purcell2005) and sometimes tourism (Dawson et al., Reference Dawson, Martin and Penland2001) and are an important food item for charismatic megafauna (Houghton et al., Reference Houghton, Doyle, Wilson, Davenport and Hays2006). In some cases, coastal degradation will, instead, reduce jellyfish abundance (Mills, Reference Mills2001), as may global warming (Purcell, Reference Purcell2005).
A chronic scarcity of data inhibits our understanding of the factors that cause particular jellyfish blooms and of the long-term trajectories of the incidence of blooms (Mills, Reference Mills2001; Purcell & Arai, Reference Purcell and Arai2001; Purcell, Reference Purcell2005). The fewest data are available from the tropical areas (Purcell, Reference Purcell2005) where scyphozoan diversity is almost certainly greatest (Vanhöffen, Reference Vanhöffen1888; Light, Reference Light1921; Kramp, Reference Kramp1970). Documenting geographical and temporal patterns in the abundance of tropical medusae is therefore an important research initiative. Concurrent work that can exclude any of the group of possible causes of blooms (e.g. species introduction, overfishing, eutrophication, climate cycles and climate change) will advance our understanding of the causes of jellyfish blooms globally.
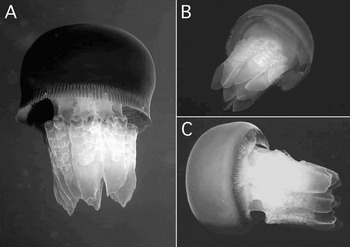
In early May 2002, local fishermen along the eastern side of the Iranian fishing grounds (Gwatr Bay) observed a medium-sized brown medusa in large quantities. Apparently the same species of medusa was also abundant in the coastal waters of the Gulf of Oman (Figure 1). Reported effects of this bloom included decreased catch in both artisanal and industrial fisheries, damaged fishing gear, interrupted operation of desalination plants, and damaged seawater cooling systems of coastal power plants (e.g. Vaidya, Reference Vaidya2003; M. Claereboudt, personal communication). Here, we describe coincident fisheries data from the coastal waters of Iran and identify the species in question, which was unknown at the time, enabling us to exclude at least one hypothetical cause of this bloom.
Three medusae from Oman identified in this study as Crambionella orsini (Vanhöffen); (A & B) courtesy of Richard Field; (C) courtesy of Fergus Kennedy.

MATERIALS AND METHODS
Species identification
Whole and dissected medusae were photographed for identification by comparing overall morphology with descriptions of tropical scyphomedusae available in the literature (e.g. Mayer, Reference Mayer1910; Light, Reference Light1921; Kramp, Reference Kramp1961, Reference Kramp1965, Reference Kramp1968, Reference Kramp1970; Cornelius, Reference Cornelius and J.C.1997a, Reference Cornelius and M.D.b; Mianzan & Cornelius, Reference Mianzan, Cornelius and Boltovskoy1999). Oral arm tissues were preserved in 90% ethanol for DNA analyses and sequence comparisons.
DNA was extracted from ~10 mm3 ethanol-preserved oral arm tissues using a CTAB-phenol/chlorofom based protocol (Dawson et al., Reference Dawson, Raskoff and Jacobs1998; Dawson & Jacobs, Reference Dawson and Jacobs2001) and resuspended in 70 µl 10 mM Tris–HCl pH8.3. Cytochrome c oxidase subunit I (COI) was amplified using primers LCOjf (5′-ggtcaacaaatcataaagatattggaac) and HCO2198 (5′-taaacttcagggtgaccaaaaaatca; Folmer et al., Reference Folmer, Black, Hoeh, Lutz and Vrijenhoek1994). Polymerase chain reactions (PCRs) consisted of six steps of 94°C for 8 minutes, 49°C for 2 minutes, 72°C for 2 minutes, 94°C for 4 minutes, 50°C for 2 minutes, 72°C for 2 minutes, then 33 cycles of 94°C/45 seconds, 51°C/45 seconds, and 72°C/60 seconds, followed by an extension step at 72°C for 10 minutes; the reaction was terminated by cooling to 4°C. PCR products were purified using Qiagen (Clifton Hill, Victoria, Australia) PCR clean-up columns, labelled with BigDye and sequenced on ABI 377 automated sequencers according to the maker's protocols (Applied Biosystems). Electropherograms were checked visually, misreads were corrected, and poorly resolved terminal portions of sequences discarded. Likely family-level affiliation was deduced using phylogenetic analyses of homologous nucleotide sequences from species representing all families of rhizostomes for which COI sequence data were available. These sequences were aligned by eye, using translated amino acid sequences as a guide. All missing or ambiguous nucleotides were excluded and a model of nucleotide evolution estimated using modeltest (Posada & Crandall, Reference Posada and Crandall1998). Phylogenetic reconstruction was completed using two approaches. A branch and bound search using unweighted maximum parsimony as the optimality criterion (BBUMP, minimum F-value optimization) and an heuristic tree–bissection–reconnection search using maximum likelihood (TBRML; 1000 replicates; best-fit model (TIM + I + G) selected by Akaike's information criterion in Modeltest 3.7 (Posada & Crandall, 1998): Lset Base = (0.3340 0.1731 0.1287) Nst = 6 Rmat = (1.0000 17.1744 2.7973 2.7973 29.1946) Rates = gamma shape = 0.6521 Pinvar = 0.4751), both conducted in PAUP* 4.0b10 (Swofford, Reference Swofford2002). Support for internal branches was assessed by bootstrap analyses (BBUMP 2500 replicates; TBRML 1250 replicates) using the same settings as the original searches, except that only 10 TBRML searches were conducted per bootstrap replicate. Familial membership was tested using the Kishino–Hasegawa and Wilcoxon signed ranks tests implemented in PAUP* 4.0b10. Phylogenetic hypotheses placing C. orsini within each of the five rhizostome families for which sequence data were available were generated using TBRML (10 replicates) and BBUMP searches employing back-bone constraints in PAUP* 4.0b10; all other relationships were unconstrained. Kishino–Hasegawa tests of alternate TBRML trees used RELL bootstrap (100,000 replicates) and were one-tailed (Felsenstein, Reference Felsenstein2004). Wilcoxon signed ranks tests of BBUMP trees were two-tailed.
Occurrence and collections
The geographical extent and abundances of medusae were assessed via routine demersal fish surveys made between 0630 h and 1830 h during three research cruises in the Persian Gulf and Gulf of Oman. One cruise on RV ‘Lavar-2’ during 13 to 16 May 2003 in the Persian Gulf, Bushehr Province waters (from 50° 48′E to 51° 48E′ and 27° 29′N to 28° 46′N) sampled two depth layers (5–15 m, 15–40 m) at 23 stations using an outrigger shrimp trawl with head rope 27 m and mesh size of 40 mm. Two cruises on RV ‘Ferdows-1’ during August 2002 and August 2003 in the Gulf of Oman (from 58° 55′E to 61° 30′E and from 24° 48′N to 25° 26′N) sampled four depth layers (10–20 m, 20–30 m, 30–50 m and 50–100 m) at 85 randomly selected trawl stations using a high opening fish bottom trawl with a head rope of 72 m and 400 mm mesh size in the wings that gradually reduced to 80 mm in the cod end. All demersal trawls were 1-h duration except where noted in the Results section. Catch per unit of area (CPUA) and biomass, measured by filling crates with medusae and weighing an arbitrary subset of the crates using a Globe Brand 40 kg analogue balance (precision 100 g), were calculated according to the method of Sparre & Venema (Reference Sparre and Venema1992) to provide an index of relative abundance estimated for each station. These indices accurately indicate relative distributions in the horizontal dimensions, although the precise depth at which medusae were caught is unknown because closing nets were not used. The diameter of an arbitrary subsample of jellyfish placed exumbrella surface down on a flat surface was measured using Vernier calipers with total accuracy ~±0.5 cm. Observations of the occurrence of medusae by local fishermen were gathered at the principal landing sites (Beris, Gwatr, Pozm and Ramin).
Sea surface temperature
Reynolds optimally interpolated sea surface temperature (SST) and SST anomalies (SSTA) for the Gulf of Oman (from 25°N to 23.5°N and from 59.0°E to 63.0°E) at monthly intervals between January 1982 and December 2005, inclusive, were downloaded from the POET website (http://poet.jpl.nasa.gov//). The Reynolds optimally interpolated SST dataset is based upon a combination of Advanced Very High Resolution Radiometer satellite and in situ data, with anomalies calculated as deviations from monthly averages (PODAAC Product No.119). The data were used to calculate: (i) the minimum, maximum, mean annual minimum, and mean annual maximum SSTs; and (ii) the mean monthly SSTA and total absolute monthly SSTA on an annual basis.
RESULTS
Species identification
Medusae were Rhizostomeae with three-winged mouth arms, a network of anastomosing canals joined to the gastric cavity only via radial canals, subumbrella muscles were annular, and papillae appeared to be present near the subgenital ostia in photographs (=suborder Daktyliophorae). They lacked scapulets (=superfamily Inscapulatae). The network of canals within the primary ring canal were anastomosed with one interradial, one perradial and two adradial canals per quadrant (=families Catostylidae or Lobonematidae), and the marginal lappets were not elongated and tentacle-like (i.e. Catostylidae not Lobonematidae). The oral arms terminated with mouthless clubs (=genera Acromitus Light, Crambionella Stiasny or Leptobrachia Brandt); the oral arms were not devoid of frilled mouths in the middle (i.e. not Leptobrachia) and the terminal clubs were short, broad, and triangular in cross-section rather than whip-like (i.e. Crambionella not Acromitus).
All specimens of Crambionella measured or photographed had 8 rhopalia. The number of lappets between adjacent rhopalia was 8, 12, or 16, and could vary within single jellyfish. Pigment was usually absent between lappets. Thirty-five medusae selected haphazardly during the first cruise on RV ‘Ferdows-1’ (August 2002) from unknown depth had mean bell diameter (d) 90 ± 5 mm (all error terms are 95% confidence interval (CI); range 70 mm to 100 mm); 27 of these were mature, i.e. with developed gonad. The length of the oral arms was, on average, ~0.6d (range 0.56 to 0.68). These morphological characteristics are most consistent with the description of the species Crambionella orsini (Vanhöffen, Reference Vanhöffen1888) given by Kramp (Reference Kramp1961; see also Vanhöffen, Reference Vanhöffen1888) and previously reported from the Red Sea to India, including the ‘Iranian Gulf’ (Kramp, Reference Kramp1961).
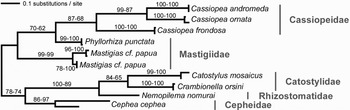
Both TBRML and BBUMP phylogenetic analyses recovered the same optimal tree with generally moderate to high bootstrap support (Figure 2). Hypothesis testing supported placement of C. orsini in family Catostylidae but could not exclude an alternative hypothesis of a close relationship with Rhizostomatidae (Table 1).
Preliminary phylogenetic analyses of 473 nucleotides (267 constant, 197 parsimony informative, 9 variable but parsimony uninformative) of cytochrome c oxidase subunit I (COI) from available rhizostome medusae is consistent with identification of the blooming species of scyphomedusa as a member of family Catostylidae. The same gene tree was found irrespective of whether the search plus optimality criterion was heuristic plus maximum likelihood (TBRML; −ln L = 3028.013 (−ln Lunconstrained = 1780.655)) or branch and bound plus unweighted maximum parsimony (BBUMP; one shortest tree. 612 steps, consistency index = 0.5408. Each branch is annotated with bootstrap values from TBRML (1250 replicates) and BBUMP (2500 replicates) analyses in the order TBRML–BBUMP. Taxonomic authorities not given elsewhere in the paper: Cassiopea andromeda Forskål, Cassiopea frondosa Pallas, Cassiopea ornata Haeckel, Catostylus mosaicus Quoy & Gaimard, Mastigias papua Lesson, Nemopilema nomurai Kishinouye, Phyllorhiza punctata von Lendenfeld.

Statistical tests of hypothesized family-level affinities of Crambionella orsini.

*H0 (that hypothesized tree does not differ statistically from the best tree) rejected at P < 0.05 after sequential Bonferroni correction for 8 tests (Rice, Reference Rice1989).
Occurrence and collections (Figure 3)
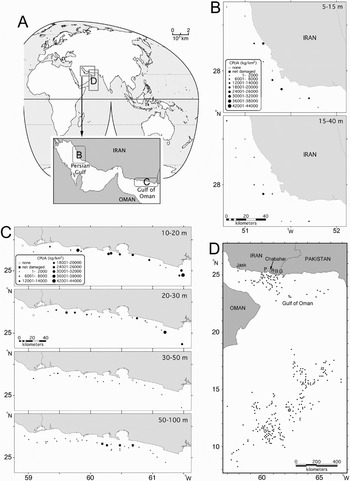
The total biomass of all species caught in the demersal trawls in the Gulf of Oman in August 2002 was estimated at 296.6 ± 0.2 kg km−2 (Figure 3C). Crambionella orsini medusae predominated, comprising 224.3 ± 5.8 kg km−2 (75.6 ± 2.0%) of the total biomass. Total biomass of medusae showed an increasing trend from west to east with a maximum of 209 ± 57 tonnes taken in Gwatr Bay. These data exclude 10 sites at which the net was torn under the weight of the catch while retrieving the net after trawling for 60 minutes between 50–100 m or at which sampling was abandoned after <30 minutes between depth layers 10–30 m due to very high abundances of jellyfish. Crambionella orsini medusae biomass decreased with depth and was negligible below 75 m (depth recorded by 38 khz echo-sounder). Maximum biomass of medusae per unit of area of 123.4 ± 9.9 kg km−2 occurred at 10–20 m. High densities of C. orsini were also observed by local tuna fishermen during autumn and winter in both inshore and offshore waters (Figure 3D; quantitative estimates of density were not available from fishermen, and pelagic trawls were not done in this area).
(A) Map, with inset, showing the regions studied; (B) distribution and density of Crambionella orsini medusae in Iranian coastal waters of the Persian Gulf estimated from trawl data collected during May 2002; (C) distribution and density of C. orsini medusae in Iranian coastal waters of the Gulf of Oman estimated from trawl data collected during August 2002. Net damage incurred at depths of 50–100 m may indicate masses of moribund medusae that were transported passively from shallower nearer shore aggregations (see Billett et al., Reference Billett, Bett, Jacobs, Rouse and Wigham2006); and (D) distribution of C. orsini medusae in the Gulf of Oman reported by artisanal fishermen landing at Beris [B], Gwatr [G], Pozm [P], and Ramin [R] during May to December, 2002. The major fishery ports of Jask and Chabahar are shown for reference.

During the May 2003 Persian Gulf cruise (Figure 3B), numerous gelatinous zooplankton occurred in the catch, including salps, carybdeid cubomedusae, and the rhizostome scyphozoans Cephea cephea Forskål and Crambionella orsini. The percentage (by mass) of C. orsini in the total catch of the demersal trawls was 79.4 ± 3.8% in depths 5–15 m and 61.9 ± 3.6% in depths15–40 m. Thirty-two C. orsini had mean diameter 109.5 ± 4.7 mm (range 94 mm to 126 mm). Gonad was developed in all specimens.
Crambionella orsini density was reduced considerably during August 2003 in the Gulf of Oman. The total biomass per unit area of all species caught in the demersal trawls was estimated at 111.2 ± 0.03 kg km−2 and C. orsini comprised only 0.1 ± 0.002 kg km−2 (0.08 ± 0.0003%).
Sea surface temperature
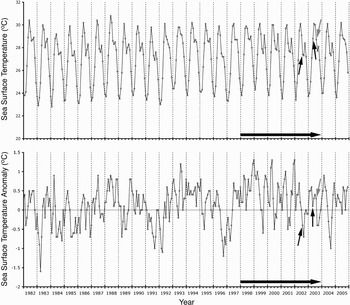
Minimum SST between 1998 and 2003 ranged from 23.4°C to 24.3°C (mean low ±95% CI = 23.75 ± 0.25°C); maximum SST between 1998 and 2003 ranged from 29.9°C to 30.1°C (mean high ±95% CI = 30.03 ± 0.07°C; Figure 4A). Minimum SSTs in 2002 and 2003 were 23.4°C and 23.7°C, respectively, maximum SSTs were 30.1°C. As emphasized by monthly SSTAs, therefore, 2002 and 2003 were cooler than the preceding four years, which included the 3 warmest anomalies since 1982 (1998–2001; Figure 4B), and, in terms of the mean deviation or sum of absolute deviations, among the 9 most moderate years in the available 24-y dataset.
DISCUSSION
Stock assessment of demersal resources has been conducted since 1998 in the Iranian coastal waters of the Gulf of Oman. In all years except 2002 the abundance of Crambionella orsini was limited to a small number of specimens (<5 medusae km−2); 2002 is the only year that a bloom of jellyfish was observed. The bloom of C. orsini had many of the characteristics typical of blooms in temperate regions (e.g. Goy et al., Reference Goy, Morand and Etienne1989; Graham et al., Reference Graham, Pagès and Hamner2001; Raskoff, Reference Raskoff2001; Brodeur et al., Reference Brodeur, Sugisaki and Hunt2002; Purcell, Reference Purcell2005; Lynam et al., Reference Lynam, Gibbons, Axelsen, Sparks, Coetzee, Heywood and Brierley2006). It appeared to arise and end relatively quickly and abundances varied greatly spatially. There were very low abundances in preceding and following years. Whether locally very high abundances were due to local production of medusae or aggregation is unclear.
Crambionella orsini (Vanhöffen) is endemic to the western Indian Ocean, being recorded from the Travancore coast and Krusadai Island of eastern India, the Iranian Gulf, and Assab at the southern entrance to the Red Sea; the type locality is the Red Sea (Kramp, Reference Kramp1961). That the bloom was of an endemic species allows us to dismiss one often cited cause of jellyfish blooms: species introduction (see additional examples of blooms of endemic species in Mills, Reference Mills2001). Furthermore, the bloom was geographically widespread which also suggests it was not caused by local coastal degradation, such as development or eutrophication, but rather by large-scale oceanographical or ecosystem conditions (e.g. Goes et al., Reference Goes, Thoppil, Gomes and Fasullo2005) favourable to the jellyfish, perhaps such as a strong (but not extreme) temperature signal preceding observation of the bloom in August 2002 (Figure 4). In this context, it is useful to emphasize that the bloom of endemic C. orsini seems to have occurred during a relatively normal year (see also Martin et al., Reference Martin, Dawson, Bell and Colin2005; Purcell, Reference Purcell2005), at least in terms of SST, in contrast to the more common association of jellyfish blooms with extreme events and indicators of dramatic ecosystem change (e.g. Dybas, Reference Dybas2002; Hay, Reference Hay2006); interestingly, this may be a trend for warm-water populations (Purcell, Reference Purcell2005). The oceanographical or ecosystem conditions in the Gulf of Oman in 2002, many of which are unknown to us, were also favourable for opportunistic fish such as Nemipterus japonicus and for the juvenile stages of Stephanolepis diaspros, both fished commercially to different extents (http://www.fishbase.org/), which associate with C. orsini and thus became common off Musandam and Oman where they are usually rare (M. Claereboudt, personal communication; R. Field, personal communication), but unfavourable for tuna, of which the 2002 catch was greatly reduced (R. Field, personal communication). Kramp (Reference Kramp1970) also reported that C. orsini occurred ‘in great abundance’ (pp. 14–15) and that he had seen it ‘in great quantities’ from Mombasa in eastern Africa to the Seychelles. The congeneric species Crambionella stuhlmanni Chun may be present in the Bay of Bengal all year but peaks in abundance from July to November (Krishnamurthy, Reference Krishnamurthy1967; James et al., Reference James, Vivekanandan and Srinivasarengan1985; Rajagopal et al., Reference Rajagopal, Nair and Azariah1989), similar to the peak density of C. orsini which had developed by August 2002 and subsequently subsided after May 2003. Thus, currently, we consider a natural cause, perhaps involving climate cycles (Goy et al., Reference Goy, Morand and Etienne1989; Brodeur et al., Reference Brodeur, Mills, Overland, Walters and Schumacher1999; Martin et al., Reference Martin, Dawson, Bell and Colin2005; Lynam et al., Reference Lynam, Hay and Brierley2005; see review by Purcell, Reference Purcell2005), more likely than massive anthropogenic perturbation of the pelagic ecosystem. However, we do not exclude the possibility that natural events could be exacerbated by large-scale human activities, such as commercial fishing, that have the potential to impact entire pelagic ecosystems (Mills, Reference Mills1995; Pauly et al., Reference Pauly, Christensen, Dalsgaard, Froese and Torres1998; Jackson et al., Reference Jackson2001; Lynam et al., Reference Lynam, Gibbons, Axelsen, Sparks, Coetzee, Heywood and Brierley2006).
(A) Monthly averaged sea surface temperature, from February 1982 to December 2005; and (B) sea surface temperature anomaly, calculated monthly from January 1982 to December 2005, for the Gulf of Oman region between 25°N to 23.5°N and 59.0°E to 63.0°E. Black arrows indicate the months for which quantitative fisheries survey data in the Gulf of Oman or Persian Gulf indicate abundant Crambionella orsini. Grey arrow indicates the month for which quantitative fisheries survey data in the Gulf of Oman for C. orsini were rare. The horizontal arrow indicates the period during which anecdotal information from fisheries research cruises indicate no blooms, except those noted above.

The unexpected and still partially unexplained bloom of C. orsini medusae highlights again the need for historical and long-term neontological research into jellyfish blooms (Mills, Reference Mills1995, Reference Mills2001; Purcell, Reference Purcell2005). Ad hoc collections using sub-optimal equipment and sampling strategies targeting other taxa (e.g. benthic trawls for demersal fish) can suggest, but will almost invariably remain insufficient for full understanding of the causes and consequences of jellyfish blooms (e.g. Mills, Reference Mills1995; Lynam et al., Reference Lynam, Hay and Brierley2004, Reference Lynam, Hay and Brierley2005; Purcell, Reference Purcell2005; this study). In addition, the potential for large blooms to leave physical (e.g. Hagadorn et al., Reference Hagadorn, Dott and Damrow2002) and/or chemical signatures in sediments (Billet et al., Reference Billett, Bett, Jacobs, Rouse and Wigham2006), raises the possibility for palaeoreconstructions of climatological, ecosystem, and bloom conditions. Initiating such studies in areas that are less developed than the temperate regions, from where most jellyfish blooms are known, may provide a relatively realistic baseline against which to assess future change. It will also aid better geographical and taxonomic sampling to document the natural ranges of endemic medusae.
ACKNOWLEDGMENTS
This work would have been impossible without the assistance of the crews of the RV ‘Ferdows-1’ and RV ‘Lavar-2’ and of T. Valinassab and B. Naimi. The study was given greater context by the many people who shared their observations of C. orsini: M. Claereboudt, R. Field, B. Jupp, and S. Wilson. A.C. Morandini corroborated the identification of C. orsini from early photographs. L. Martin helpfully critiqued the draft manuscript. M.N.D. was supported in part by a Vice-Chancellor's Post-doctoral Fellowship at the University of New South Wales. New sequences were deposited in GenBank (accession number) for Mastigias sp. (EU363340), Phyllorhiza punctata (EU363341, EU363342), Crambionella orsini EU363543, EU363345) Cephea spp. (EU368345, EU363346), and Acromitus flogellatus (EU363343, EU363348).