Implications
A number of studies have shown that conjugated linoleic acid, such as bioactive fatty acid, causes reduced milk fat synthesis and changes the milk fatty-acid composition in different ruminant species. These changes may be accompanied by an improvement in energy balance, suggesting that the energy spared for milk fat synthesis can be used to replenish body reserves in lactating goats.
Introduction
Dietary fatty acids may be used to modulate animal metabolism for specific purposes (Salter and Tarling, Reference Salter and Tarling2007), and certain conjugated linoleic acid (CLA) isomers represent a remarkable example of such application. The trans-10, cis-12-conjugated linoleic acid (t10,c12-CLA) isomer has been shown to reduce milk fat secretion in lactating cows, which is a consequence of a coordinated inhibition of gene expression for lipogenic enzymes in the mammary gland (Baumgard et al., Reference Baumgard, Matitashvii, Corl, Dwyer and Bauman2002b). This anti-lipogenic effect of t10,c12-CLA may be advantageous in certain situations as the energy spared for milk fat synthesis could result in increased milk production and secretion of milk protein and/or an improvement in the energy balance (EB) of lactating cows (Bauman et al., Reference Bauman, Harvatine and Lock2011).
There are different forms to provide t10,c12-CLA to ruminants. Supplying it as methyl esters is more advantageous for commercial production as compared with free fatty acids, calcium soaps or lipid-encapsulated forms. Methyl esters can be hydrolyzed and biohydrogenated by ruminal bacteria (Maia et al., Reference Maia, Chaudhary, Bestwick, Richardson, McKain, Larson, Graham and Wallace2010) and it does not alter post-ruminal digestion (de Veth et al., Reference de Veth, Griinari, Pfeiffer and Bauman2004). The effects of dietary t10,c12-CLA has been shown to be dose-dependent in lactating cows (de Veth et al., Reference de Veth, Griinari, Pfeiffer and Bauman2004), but such response has not been fully addressed in goats. Limited evidence indicates that goats are less sensitive to the anti-lipogenic effects of t10,c12-CLA when compared with cows, indicating possible inter-species differences (Shingfield et al., Reference Shingfield, Rouel and Chilliard2009). The objective of this study was to evaluate the effects of increasing doses of a rumen-unprotected CLA supplement (containing t10,c12-CLA as methyl esters) on milk production, milk composition, milk fatty-acid profile and EB in dairy goats. To the best of our knowledge, this is the first study to address the dose–response effects of a rumen unprotected t10,c12-CLA supplement in lactating goats.
Material and methods
Animals, design and treatments
Ethics Committee on Animal Experimentation and animal handling of the Santa Catarina State University approved all procedures. Eight non-pregnant Toggenburg goats were divided in two groups according to the body weight, milk production and lactation number (four primiparous and four multiparous) and randomly assigned to the dietary treatments in a two 4×4 Latin Square Design with 12-day treatment periods separated by 6-day washout intervals (to minimize possible residual effects). At the beginning of the study, the animals were in mid-lactation (135, s.d.±21 days in milk), with average body weight of 46.7 kg (s.d.±4.8), body condition score (BCS) of 2.5 and milk production of 2.62 kg/day (s.d.±0.5). The animals were maintained in individual stalls with ad libitum access to water and a mineral supplement.
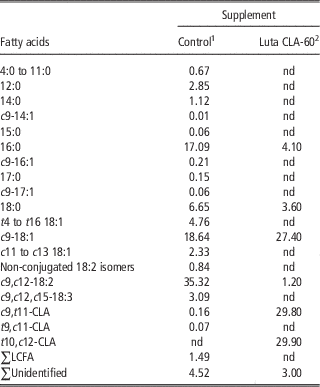
Goats were individually fed the following dietary treatments: (1) Control–CLA0: 45 g/day of calcium salts of fatty acids (CSFA); (2) CLA15: 30 g/day of CSFA+15 g/day of CLA methyl esters (CLA-ME); (3) CLA30: 15 g/day of CSFA+30 g/day of CLA-ME; and (4) CLA45: 45 g/day of CLA-ME. The CLA-ME supplement (Luta-CLA 60, BASF, São Paulo, São Paulo, Brazil) contained 29.9% of t10,c12-CLA (Table 1); therefore, the dietary treatments provided 0, 4.48, 8.97 and 13.45 g/day of t10,c12-CLA, respectively. The CSFA (Megalac-E, Church & Dwight, Nova Ponte, Minas Gerais, Brazil) containing linoleic acid as the major fatty acid (Table 1), and it was used as a control lipid in the study. The lipid supplements were mixed with the concentrate.
Fatty-acid composition (g/100 g fatty acids) of lipid supplements

nd=not detected; ∑LCFA=sum of all fatty acids with chain length equal to or higher than 18 carbons.
1 Control: calcium salts of long-chain fatty acids.
2 Luta CLA-60: supplement containing 29.9% of methyl ester of t10,c12-CLA.
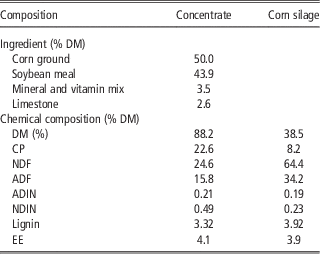
The CLA30 dose of t10,c12-CLA was based on data reported by Lock et al. (Reference Lock, Teles, Perfield, Bauman and Sinclair2006) where, on a metabolic weight basis, ∼0.4 g/day of t10,c12-CLA was expected to reach the abomasum, reducing the milk fat secretion by 20% to 25%. In addition, a rumen biohydrogenation of 95% for CLA-ME was assumed to occur (Jenkins et al., Reference Jenkins, Wallace, Moate and Mosley2008). The nutrient requirements were calculated according to the National Research Council (NRC) (2007) and the diet formulations were carried out using the Small Ruminant Nutrition System (Tedeschi et al., Reference Tedeschi, Cannas and Fox2010). The concentrate was formulated to meet the nutritional requirements in relation to that supplied by corn silage (ad libitum fed; Table 2).
Concentrate composition and chemical analyses of dietary ingredients

DM=dry matter; CP=crude protein; ADIN=acid detergent-insoluble nitrogen; NDIN=neutral detergent-insoluble nitrogen; EE=ether extract.
Experimental procedure
The animals were individually fed corn silage (ad libitum) plus 1 kg of concentrate. The concentrate was provided in equal proportion after the morning (0.5 kg) and afternoon (0.5 kg) milking to ensure a complete intake of the supplemental fatty acids. Corn silage orts were weighed daily to calculate silage intake, and samples of corn silage (offered and orts) and concentrate (offered) were taken weekly and frozen at −20°C for chemical analysis. Goats were manually milked at 0500 and 1500 h and individual milk production was recorded daily throughout the study. Pooled milk samples (from morning and afternoon milkings) were collected in 30 ml tubes containing bromopol (D & F Control System Inc., San Ramon, CA, USA) on the 10th, 11th and 12th day of each treatment period to determine its solids concentration (fat, protein and lactose) and somatic cell count (SCC). These samples were stored at 4°C until analysis. The average milk composition of the 10th, 11th and 12th day, from each treatment period, was calculated and the values obtained were used in the statistical analysis. A second milk sample was taken on the 12th day of each treatment period and stored at −20°C without preservative for analysis of the fatty-acid profile. In addition, body weight and BCS, scale 1 to 5 (Villaquiran et al., Reference Villaquiran, Gipson, Merkel, Goetsch and Sahlu2005), were determined on the 12th day of each treatment period.
Blood samples were taken after afternoon milking on the 12th day of each treatment period, via jugular vein puncture, using vacutainer tubes (Zhejiang Kangshi Medical Devices Co., Hangzhou, China) containing ethylenediamine tetraacetic acid and placed on ice. Thereafter, samples were centrifuged at 2800×g per 15 min and the resulting plasma was stored in Eppendorf tubes and stored at −20°C until analysis of glucose and non-esterified fatty-acid (NEFA) concentrations.
Chemical analysis
The feed offered and orts were measured daily, sampled, pooled weekly and analyzed for dry matter (DM), crude protein (CP) and ether extract (EE; Association of Official Analytical Chemists (AOAC) 2000). The analysis of the NDF, ADF, neutral detergent-insoluble nitrogen (NDIN), acid detergent-insoluble nitrogen (ADIN) and lignin were performed according to Van Soest et al. (Reference Van Soest, Robertson and Lewis1991). Milk components (fat, protein and lactose) were determined according to AOAC (2000), and SCC by flow cytometry. Glucose plasma levels were determined through a direct reading (glucose oxidase enzyme immobilized in membrane) in an automatic YSI 2007 analyzer (Bicochemistry Analyzer, Yellow Springs, USA) and NEFA plasma concentration was determined by colorimetric–enzymatic method (NEFA C; Wako Pure Chemical Industries, Osaka, Japan) using a 96-well microplate for ELISA.
The milk fatty acids were extracted according to Hara and Radin (Reference Hara and Radin1978), using a 3 : 2 (v/v) mix of hexane and isopropanol (18 ml/g of extracted fat) followed by a solution of sodium sulfate 67 g/l (12 ml/g of extracted fat). Fatty-acid methyl esters (FAME) were obtained by base-catalyzed transmethylation using a freshly prepared methylation reagent (0.4 ml of 5.4 mol/l of sodium methoxide solution plus 1.75 ml methanol). The esterification of milk fatty acids was carried out with an alkaline catalyst according to Christie (Reference Christie1982). The mixture was neutralized with oxalic acid (1 g of oxalic acid in 30 ml of diethyl ether (Chouinard et al., Reference Chouinard, Corneau, Saebo and Bauman1999)), and calcium chloride was then added to remove methanol residue (Christie, Reference Christie1982). The FAME were determined using a gas chromatograph (model 6890 N; Agilent Technologies, Barueri, São Paulo, Brazil), equipped with flame ionization detector and fused silica capillary column CP-Sil 88 (100 m×25 mm×0.2 µm of film thickness; Varian Inc., Mississauga, Canada). Hydrogen was used as a carrier gas (1 ml/min) and nitrogen as an auxiliary gas (30 ml/min). Detector and injector temperatures were set at 250°C, with split ratio 20 : 1. Oven temperature was set for 45°C for 4 min, increased by 13°C/min to 175°C, held for 27 min, increased by 4°C/min to 215°C and held for 35 min (Cruz-Hernandez et al., Reference Cruz-Hernandez, Kramer, Kennelly, Glimm, Sorensen, Okine, Goonewardene and Weselake2007). The FAME were identified by comparing three FAME references (Supelco37 mix # 47885-U, linoleic acid isomers mix # 47791, and CLA isomers mix # 05632; Sigma Aldrich, São Paulo, São Paulo, Brazil). The cis/trans-18:1 isomers were identified according to their order of elution reported under the same chromatographic conditions (Kramer et al., Reference Kramer, Cruz-Hernandez and Zhou2001; Cruz-Hernandez et al., Reference Cruz-Hernandez, Kramer, Kennelly, Glimm, Sorensen, Okine, Goonewardene and Weselake2007).
The fatty-acid profile of CSFA was determined using the one-step procedure described originally by Sukhija and Palmquist (Reference Sukhija and Palmquist1988), with modifications (Palmquist and Jenkins, Reference Palmquist and Jenkins2003). Tridecanoic acid (C13:0) was used as an internal standard to determine total fatty-acid concentration. To determine the fatty-acid composition of the CLA-ME supplement, a 40 μl sample was mixed with 2 ml of hexane and added to calcium chloride (200 mg); the solution was vortexed and allowed to rest for 1 h before being transferred to 2 ml vials. Chromatographic conditions were the same as those previously described for milk fatty-acid analysis.
Calculations
Desaturase indices were calculated for five fatty-acid pairs (c9-14:1/14:0, c9-16:1/16:0, c9-17:1/17:0, c9-18:1/18:0 and c9,t11-CLA/t11-18:1), which represent a proxy for the stearoyl-CoA desaturase enzyme (Δ9-desaturase) activity. The indices were calculated according to the definition of Kelsey et al. (Reference Kelsey, Corl, Collier and Bauman2003), where: desaturase index=product/(product+substrate). The secretion of milk fatty acids, in mmol/day, was calculated assuming that milk fat is composed of 98% triacylglycerol, from which 95% are fatty acids (Jensen, Reference Jensen2002). In addition, the molecular weight of each fatty acid was adjusted for hydrogen and oxygen atoms removed by the ester bond.
The EB was calculated for the last (12th) day of each experimental period according to the following equation: EB (Mcal/day)=metabolizable energy (ME) intake – (ME maintenance (MEm)+ME lactation (MEl)). To obtain the energy intake, feed total digestible nutrient (TDN) values were obtained according to Weiss et al., (Reference Weiss, Conrad and St-Pierre1992), and then converted to ME through the following equation (NRC, 2007): ME (Mcal/kg)=(1 kg of TDN=4.4 Mcal of digestible energy)×0.82 and ME intake was determined by multiplying the dry matter intake (DMI) by the ME of the diet components (corn silage and concentrate) plus ME from the lipid supplements (provided by the manufacturer): Luta-CLA 60 (8.8 Mcal of ME/kg), CSFA (7.1 Mcal of ME/kg). The ME requirement for maintenance was calculated by the following equation: MEm (Mcal/day)=110 kcal×BW0.75. The ME requirement for lactation was determined according to the NRC (1989) using an efficiency factor of ME utilization in the diet for lactation, according to Nsahlai et al. (Reference Nsahlai, Goetsch, Luo, Johnson, Moore, Sahlu, Ferrell, Galyean and Owens2004) by the following equation: MEl (Mcal/day)=(Milk production×(0.3512+(0.0962×% fat in the milk)))/0.589.
Statistical analyses
The data were subjected to variance analysis for a replicated 4×4 Latin Square design using the MIXED procedure of Statistical Analysis System (SAS, 2002) according to the following model:
 $$Y_{{ijkl}} =\mu {\plus}S_{i} {\plus}G_{{j(i)}} {\plus}T_{k} {\plus}P_{l} {\plus}{\varepsilon}_{{ijkl}} $$
where Y ijkl is the individual observation, μ the overall mean, S i the fixed effect of square, G j(i) the random effect of goat within square effect, T k the fixed effect of treatment, P l the fixed effect of period and ε ijkl the experimental error. The interaction between treatment and square was tested; however, it was not significant and was removed from the model. The sum of the treatment squares was decomposed using orthogonal polynomial contrasts to test the significance of the linear, quadratic and cubic responses. The treatment effects were considered significant at P<0.05.
The relationships between t10,c12-CLA found in milk fat and the percentage and production of milk fat were examined using the nonlinear least square regression procedure (PROC NLIN), using the following model:
 $$y\,=\,\beta _{0} \,{\times}\,e^{{({\minus}\beta _{1}}{x} {)} \,{\plus}\,c\,{\plus}\,{\varepsilon}$$
, where y is the percentage or fat production, x is the t10,c12-CLA concentration in the milk fat and ε is the error term in the regression equation. The parameters β
0 and β
1 represent, respectively, the scale and rate of exponential decline, and c is the constant of the lower asymptote. For the regressions, the data considered outliers were removed.
Results
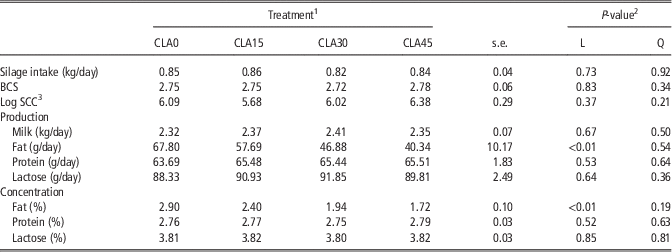
The animals consumed the entire daily portion of the concentrate with the treatments and remained in good conditions during all the experiments. Six values (two from Control, two from CLA15, one from CLA30 and one from CLA45) were removed (outliers) from the regression analysis used to describe the relationship between milk fat t10,c12-CLA content and milk fat secretion. Diet supplementation with increasing doses of CLA had no effect on silage DMI and BCS. Milk production, milk SCC, milk protein, and lactose content and production did not differ (P>0.05) among treatments. On the other hand, the fat concentration and production were linearly (P<0.01) reduced with CLA supplementation (Table 3). Compared with control, CLA15, CLA30 and CLA45 reduced fat production by 14.9%, 30.8% and 40.5%, and concentration by 17.2%, 33.1% and 40.7%, respectively.
Performance, milk production and composition of stall-fed dairy goats supplemented with CLA methyl esters

CLA=conjugated linoleic acid; BCS=body condition score; SCC=somatic cell count.
1 The treatments corresponded to supplementation of 0, 15, 30 and 45 g/day of a supplement containing 29.9% of methyl ester of t10,c12-CLA (CLA0, CLA15, CLA30 and CLA45, respectively).
2 Probability values for the linear (L) and quadratic (Q) contrasts. Cubic effect was not significant considering P>0.05.
3 Somatic cell count (log SCC=log2 (CCS/100.000)+3).
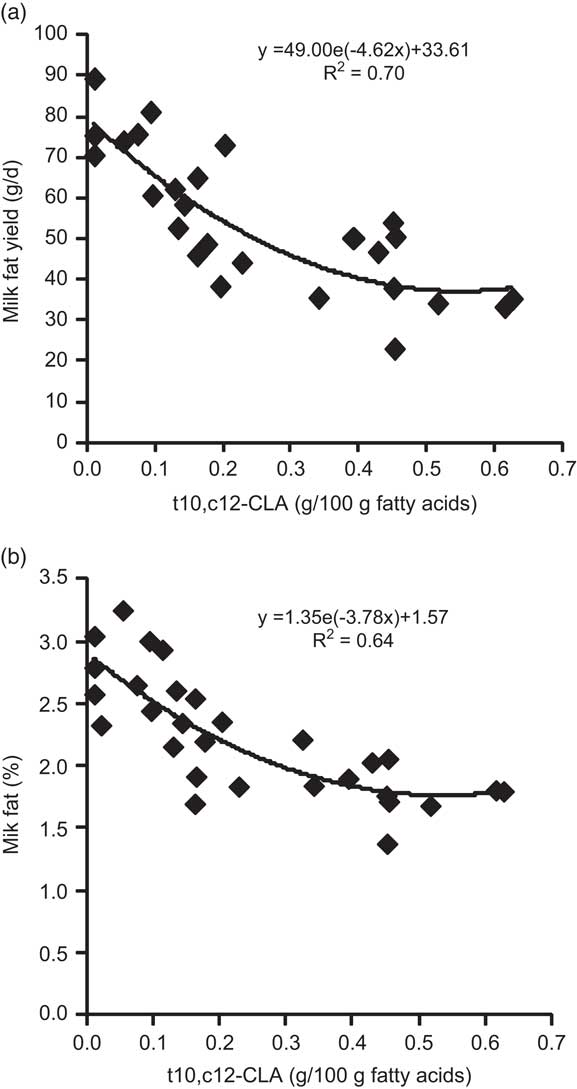
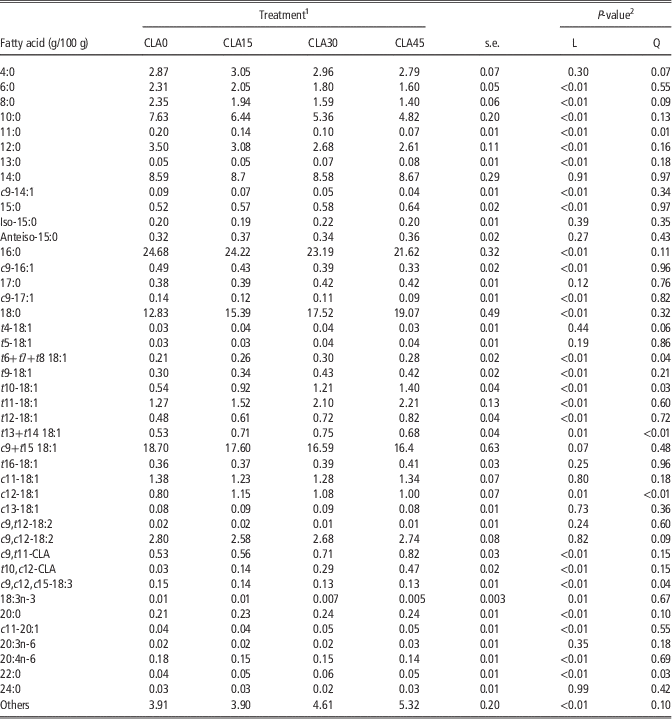
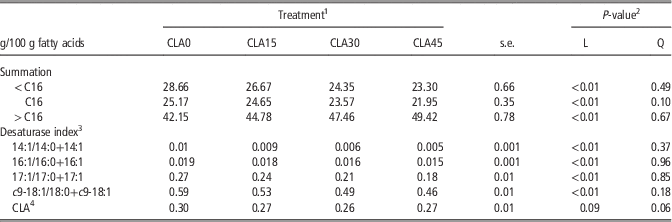
The milk fatty-acid profile was modified by treatments (Table 4). There was a linear (P<0.01) reduction in the proportion of fatty acids ⩽16 carbons, and a linear (P<0.01) increase in most fatty-acid ⩾17 carbons. Those originating from de novo synthesis and C16 (derived from both de novo synthesis and blood) were reduced by 6.9%, 15.0% and 18.7%, and 2.1%, 6.3% and 12.8% relative to the control, for CLA15, CLA30 and CLA45, respectively (Table 5). In contrast, milk fatty acids derived exclusively from blood stream (>16C) increased by 6.2%, 12.6% and 17.2% in the CLA15, CLA30 and CLA45 treatments, respectively (Table 5). The t10,c12-CLA supplementation linearly (P<0.01) reduced the majority of the fatty-acid pairs representing desaturase indices (Table 5). In relation to the control group, only the c9,t11-CLA/t11-18:1 index was not affected (P>0.05). The t10,c12-CLA concentration in milk fat increased linearly (P<0.01), representing 0.03 g/100g of milk fatty acids in the control and 0.47 g/100g of milk fatty acids in the CLA45. This increase in the t10,c12-CLA concentration and its relationship with the milk fat concentration and production is showed in Figure 1.
Effect of the concentration of milk t10,c12-CLA on milk fat yield (a, n=26) and milk fat percentage (b, n=32) of stall-fed dairy goats supplemented with CLA methyl esters. CLA=conjugated linoleic acid.

Milk fatty-acid profile of stall-fed dairy goats supplemented with CLA methyl esters

CLA=conjugated lenoleic acid.
1 The treatments corresponded to supplementation of 0, 15, 30 and 45 g/day of a supplement containing 29.9% of methyl ester of t10,c12-CLA (CLA0, CLA15, CLA30 and CLA45, respectively).
2 Probability values for the linear (L) and quadratic (Q) contrasts. Cubic effect was not significant considering P>0.05.
Milk fatty-acid profile grouped by origin and desaturase indices of stall-fed dairy goats supplemented with CLA methyl esters

CLA=conjugated linoleic acid.
1 The treatments corresponded to supplementation of 0, 15, 30 and 45 g/day of a supplement containing 29.9% of methyl ester of t-10,c-12-CLA (CLA0, CLA15, CLA30 and CLA45, respectively).
2 Probability values for the linear (L) and quadratic (Q) contrasts. Cubic effect was not significant considering P>0.05.
3 Product/(product+substrate) ratio related to the Δ9-dessaturase enzyme.
4 c9,t11-CLA/(c9,t11-CLA+t11-18:1) ratio.
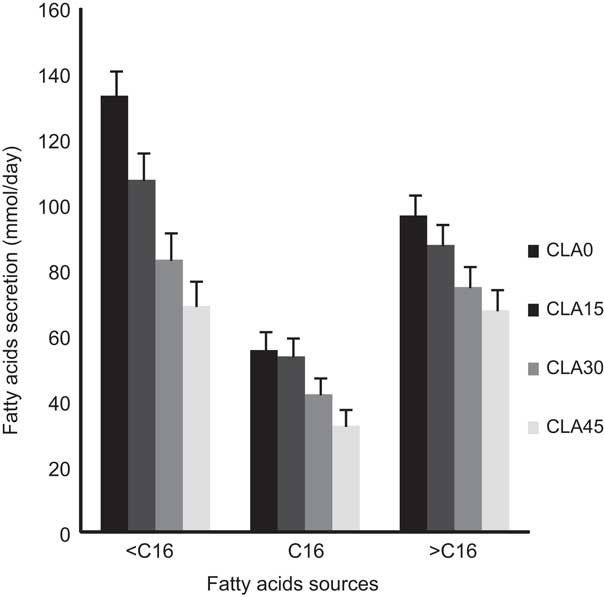
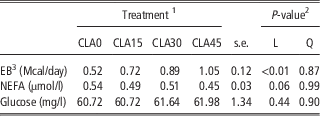
Diet supplementation with CLA linearly reduced (P<0.01) the secretion of all milk fatty acids (mmol/day), with those coming from de novo synthesis being more affected (Figure 2). The secretion of t10,c12-CLA linearly increased (P<0.01) from 0.09 for the control to 0.27, 0.46 and 0.67 mmol/day for CLA15, CLA30 and CLA45, respectively. The apparent transfer efficiency was not different (P>0.05; 1.18%, 0.13 s.e.) among treatments. The estimated EB for the 12th day was linearly (P<0.01) improved as CLA doses increased (Table 6). However, there was no effect (P>0.05) from the increasing doses of CLA on the circulating levels of glucose and NEFA (Table 6).
Milk fatty-acid secretion of stall-fed dairy goats supplemented with t10,c12-CLA methyl esters, according to their origin: de novo synthesis (<16 carbons), from blood (>16 carbons), and from both sources (16:0 and 16:1). The treatments corresponded to supplementation of 0, 15, 30 and 45 g/day of a supplement containing 29.9% of methyl ester of t10,c12-CLA (CLA0, CLA15, CLA30 and CLA45, respectively). CLA=conjugated linoleic acid.

EB, NEFA and blood glucose concentration of stall-fed dairy goats supplemented with CLA methyl esters

EB=energy balance; NEFA=non-esterified fatty acids; CLA=conjugated linoleic acid.
1 The treatments corresponded to supplementation of 0, 15, 30 and 45 g/day of a supplement containing 29.9% of methyl ester of t-10,c-12-CLA (CLA0, CLA15, CLA30 and CLA45, respectively).
2 Probability values for the linear (L) and quadratic (Q) contrasts. Cubic effect was not significant considering P>0.05.
3 EB=metabolizable energy intake−(metabolizable energy for maintenance+metabolizable energy for lactation).
Discussion
Feeding increasing doses of t10,c12-CLA had no effect on silage DMI, BCS and plasma concentrations of glucose and NEFA, which is consistent with previous experiments in cows with a positive EB (Baumgard et al., Reference Baumgard, Corl, Dwyer and Bauman2002a; Kay et al. Reference Kay, Mackle, Bauman, Thomson and Baumgard2007). This lack of effect on plasma glucose and NEFA concentrations may be because of the magnitude of the spared energy associated with responsiveness of metabolic pathways. However, the surplus of energy is sometimes accompanied by an increase in the expression of lipogenic enzymes in the adipose tissue, resulting in increased body reserve replenishment (Harvatine et al., Reference Harvatine, Perfield and Bauman2009).
The milk fat percentage showed a curvilinear relationship with the percentage of milk t10,c12-CLA (Figure 1) being observed also in other experiments on goats (Shingfield et al., Reference Shingfield, Rouel and Chilliard2009) and cows (de Veth et al., Reference de Veth, Griinari, Pfeiffer and Bauman2004). Assuming that the digestion and absorption of t10,c12-CLA is the same in goats and cows (Shingfield et al., Reference Shingfield, Rouel and Chilliard2009), we used the equation of de Veth et al. (Reference de Veth, Griinari, Pfeiffer and Bauman2004) that shows the relationship between milk fat t10,c12-CLA concentration and milk fat yield to compare the magnitude of t10,c12-CLA-induced milk fat depression between these two ruminant species. When treatment means obtained from the current trial for t10,c12-CLA concentration in milk fat from each treatment were used, the reductions in milk fat production were 29.6%, 41.8% and 46.5%, respectively, for CLA15, CLA30 and CLA45. This difference in milk fat depression between species suggests an inter-species difference for t10,c12-CLA effects, an assumption raised by other studies (Lock et al., Reference Lock, Rovai, Gipson, de Veth and Bauman2008; Shingfield et al., Reference Shingfield, Rouel and Chilliard2009). There are various reports on the scientific literature indicating the inhibitory effects of the t10,c12-CLA on milk fat synthesis in different ruminant species (de Veth et al., Reference de Veth, Griinari, Pfeiffer and Bauman2004; Lock et al., Reference Lock, Teles, Perfield, Bauman and Sinclair2006; Shingfield et al., Reference Shingfield, Rouel and Chilliard2009), whereas milk production and secretion of other milk components are usually unchanged (Bauman et al., Reference Bauman, Harvatine and Lock2011).
In addition, a lower responsiveness of goats compared with other ruminant species may be the adverse effects of t10,c12-CLA on sheep observed by Oliveira et al. (Reference Oliveira, Gama, Fernandes, Tedeschi and Bauman2012). According to those authors, the supplementation of 8.97 g/day of t10,c12-CLA resulted in a decrease in milk production and on all the other milk components with an increase in the SCC and still, a complete termination of milk secretion by the animals. The CLA supplement was the same and the dose of t10,c12-CLA used by those authors corresponds to CLA30 treatment in our study, and there was no detrimental effect even at the largest dose (CLA45).
To compare our results with those reported in previous studies on goats, the average values of milk fat t10,c12-CLA observed in the present study were used in the equation described by Shingfield et al. (Reference Shingfield, Bernard, Leroux and Chilliard2010). By using this approach, we observed that milk fat secretion was reduced by 14%, 23% and 28% in response to CLA15, CLA30 and CLA45, respectively. The differences in the magnitude of milk fat depression observed in the present study as compared with values estimated from the equation of Shingfield et al. (Reference Shingfield, Bernard, Leroux and Chilliard2010) may result from the fact that most of the data used to generate the above-mentioned equation were originated from studies in which lipids were not fed as a dietary supplement. Other aspect that could have influenced this observation is a possible increase in milk fat by the control fatty supplement, an effect that has been reported in the literature (Chilliard et al., Reference Chilliard, Glasser, Ferlay, Bernard, Rouel and Doreau2007), what could bring a bias for comparing the CLA dose–response with CLA0. The inclusion of a lipid supplement in the control treatment was done to have iso-energetic experimental diets. Although the amount of unsaturated fatty acids supplied in the control diet is not negligible, studies on goats (Chilliard et al., Reference Chilliard, Glasser, Ferlay, Bernard, Rouel and Doreau2007) reported only a minor formation of ruminal biohydrogenation intermediates.
The t10,c12-CLA isomer has demonstrated inhibition on the gene expression of the stearoyl-CoA desaturase enzyme (Baumgard et al., Reference Baumgard, Matitashvii, Corl, Dwyer and Bauman2002b) and, in vivo, the enzyme activity on the mammary gland can be estimated through the product/substrate ratio of some fatty-acid pairs under its action (Bernard et al., Reference Bernard, Leroux and Chilliard2008). The absence of effect on c9,t11-CLA/t11-18:1 ratio index could be because of the presence of the c9,t11-CLA isomer in the CLA supplement. While evaluating other indices, we observed that the dose of t10,c12-CLA that most effectively caused a reduction began with the CLA30 treatment. This result corroborates earlier studies on dairy goats (Lock et al., Reference Lock, Rovai, Gipson, de Veth and Bauman2008; Shingfield et al., Reference Shingfield, Rouel and Chilliard2009) and dairy cows (Perfield et al., Reference Perfield, Delmonte, Lock, Yurawecz and Bauman2006), where small doses of t10,c12-CLA, despite causing a reduction in milk fat, do not affect the desaturation of fatty acids in the mammary gland. In this study, the only index that presented a reduction in the CLA15 treatment was 18:1/18:0; however, this response should be regarded with caution, because it could just be a consequence of the presence of oleic acid (c9-18:1) in the lipid supplement used.
The secretion of the majority of milk fatty acids was affected by t10,c12-CLA. Increased doses resulted in less fatty acids from de novo synthesis and those preformed in milk, but the former were more affected. This observation is consistent with the data reported on cows (de Veth et al., Reference de Veth, Griinari, Pfeiffer and Bauman2004) and goats (Lock et al., Reference Lock, Rovai, Gipson, de Veth and Bauman2008) and partially contrasts with those observed by Shingfield et al. (Reference Shingfield, Rouel and Chilliard2009), who reported a reduction in the secretion of only the fatty acids coming from de novo synthesis, whereas the preformed were not affected by the treatments.
Despite their potential rumen biohydrogenation, t10,c12-CLA and t10-18:1 were the only fatty acids that did not have their secretion reduced by the increased doses of t10,c12-CLA. The increase in the t10,c12-CLA secretion reflects the increase in the doses supplied. Nevertheless, the transfer efficiency of the doses was lower than those reported by other studies involving the use of t10,c12-CLA in the diets of goats (Lock et al., Reference Lock, Rovai, Gipson, de Veth and Bauman2008; Shingfield et al., Reference Shingfield, Rouel and Chilliard2009) and cows (de Veth et al., Reference de Veth, Griinari, Pfeiffer and Bauman2004). This lower transfer efficiency was expected, as the form of supplementation used did not permit any protection against ruminal metabolism of the lipids, unlike the studies previously mentioned.
Conclusions
Feeding increasing doses of unprotected t10,c12-CLA-ME reduced both milk fat content and secretion, and improved the EB in dairy goats. The t10,c12 CLA-induced milk fat depression was accompanied by reduction in the secretion of milk fatty acids from all chain lengths, with those arising from de novo pathway being more affected as the CLA dose increased. As a consequence, the concentration of ⩽16C fatty acids in milk fat was reduced accordingly. Inter-species comparisons of the relationship between the milk fat t10,c12-CLA concentration and the magnitude of the milk fat depression suggest a lower sensitivity to this CLA isomer in goats as compared with cows and ewes.
Acknowledgments
The authors gratefully acknowledge Mr Ariovaldo Zanni for the donation of the unprotected CLA supplement (BASF AG, São Paulo, Brazil). They also would like to thank José Henrique Bruschi, in memorian. The authors also thank the Fundo de Apoio à Manutenção e Desenvolvimento do Ensino Superior do Estado de Santa Catarina (FUMDES) for the first author scholarship.