

The 2012 U.S. presidential election reminded both political parties and political researchers about the electoral impact of racial/ethnic minorities and women. In addition, the 2013 U.S. Congress included for the first time in history a majority Democratic delegation made up of women and minorities, while the Republican delegation continued “to be overwhelmingly white and male” (Homan Reference Homan2012).
President Obama won reelection in 2012 with the help of 75% support among Latinos (ImpreMedia/Latino Decisions Reference Decisions2012) and 55% support among women (CNN 2012). Overall, “Obama maintained wide advantages among young people, women, minorities, and both the less affluent and the well-educated” (Pew Research Center Reference Center2012). In contrast, Romney relied on mainly white non-Hispanic voters, who represented 89% of his base. These separate electoral strategies proved decisive in the 2012 election, with President Obama ultimately capturing 51% of the vote.
The president of the National Council of La Raza, Janet Murguia, has categorized the Latino vote as “the new normal” since “the 2012 electorate, which includes millions of Hispanic voters, has become an American reality that should be embraced by all” (Murguía Reference Murguía2012). There is now growing interest in the increasing political relevance of Latino political participation. Even though Latino political participation in the United States is generally lower than the rest of the population, this dynamic is changing partly as a result of the rapidly growing foreign-born population in the United States. The 2010 U.S. Census data show that the country's Latino population represents 16.3% of the total population, which grew by 43% in the last decade. Much of this growing population is made up of female immigrants, who are migrating to the United States from almost every country at higher numbers than men (Jones-Correa Reference Jones-Correa1998).
This population growth has only fueled the interest in how Latinos can influence U.S. politics. Latino voters are considered a key group of swing voters that can significantly influence the direction of an election since they generally provide a majority of voter support to the Democratic party and a small (but potentially growing) level of voter support to the Republicans. Therefore, the shifts in the political behaviors and attitudes of Latino men and women can have significant electoral consequences. In addition, changing U.S. demographics have motivated the Republican Party to devise new strategies to court the growing number of Latino voters. The RNC chairman Priebus reported that “the Republican party believes that it's crucial to involve Latinos at every level” (Madison Reference Madison2012).
Many questions are still left unanswered about the observable differences in voting behavior and partisanship attitudes among men and women. Most of the previous research on the political gender gap has focused on the majority white population, with few studies examining the gender gap within diverse racial and ethnic groups (Conway Reference Conway and Whitaker2008). I focus on the opportunities for broadening the lines of analysis and new approaches to gender gap research by addressing the increasing racial/ethnic diversity in the American population and electorate.
This growing presence of Latina immigrants can significantly affect the rate and character of Latino political participation in the United States. The electoral participation rates for U.S. racial/ethnic minority females in particular have dramatically increased in the last ten years, even exceeding the rates for their male counterparts. Latinas demonstrate specific and unique political attitudes, such as a more participatory and community-oriented approach to political participation than their male counterparts (Hardy-Fanta Reference Hardy-Fanta1993) that has helped them become the central engine of Latino political participation.
The modern U.S. partisan gender gap, with a greater proportion of women than men supporting the Democratic Party, has greatly diversified in the most recent elections. Since 2004, this modern partisan gender gap is now more perceptible for racial/ethnic minority groups than white voters. The partisan gender gap for racial/ethnic groups has grown and reached a high in the 2012 election, with black women and Latinas demonstrating increased support for President Obama. This partisan gender gap for blacks and Latinas, 9 and 11 points, respectively, even exceeded the gender gap for whites, which was 7 points. In the 2012 election, black women and Latina voters overwhelmingly supported President Obama, by 9 to 11 points, respectively, which was greater than their male counterparts.
The Latino political gender gap can also be steering a large amount of the Latino political influence in electoral politics. This project delves deeper into the complex gender differences for Latino political attitudes. More specifically, it is a political analysis of the diverse U.S. Latino population and the interacting factors that can influence male and female differences in political ideology. I unpack more aspects of the gender category for Latinos. This includes investigating the gender differences in Latino political ideology across national origin, foreign-born status, and generational status.
As a result of gendered immigration and assimilation experiences, Latinos are demonstrating gender differences in political attitudes and behaviors. The results show differences with gender and across generations for Latino political views. Latinas demonstrate a modern gender gap, with more liberal political views than their male counterparts. Latinas have an increased likelihood of supporting the Democratic Party (which can include Democratic congressional and presidential candidates) compared to their male counterparts. The explanations of the Latina gender gap phenomenon come from a variety of sources, including the socioeconomic change and changing attitudes of generational cohorts over time.
The Latina gender gap can have far-reaching political implications on electoral politics. As the Latino population highlights their growing political sway, the major political parties will strategically mobilize and court the Latino electorate, with particular attention on Latinas. This is critical given the current Latino gender gap, where Latinas generally demonstrate higher voter turnout and more liberal political ideology compared to their male counterparts. For these reasons, I will bring to light the range and makeup of Latino political ideology in U.S. politics.
GENDER GAP IN POLITICAL IDEOLOGY
Since the 1980s, there has been evidence of a political gender gap in the United States and then in other postindustrial nations later in the 1990s. This gender gap demonstrates that women can have distinctly different political attitudes and opinions than men (Clark and Clark Reference Clark and Clark2008; Desposato and Norrander Reference Desposato and Norrander2008; Inglehart and Norris Reference Inglehart and Norris2003). In the United States there is a modern gender gap where women have markedly different political attitudes compared to men. These attitudes have realigned over time, and the modern realignment process includes women moving toward the left of men in a variety of political beliefs and behaviors, including a greater proportion of women than men supporting the Democratic Party (Inglehart and Norris Reference Inglehart and Norris2003).
In contrast, the traditional gender gap is more prevalent in postcommunist and developing societies where women are to the right of men in their political behavior. In most Latin American countries, there is a negative gender gap where men's political participation rates for electoral and nonelectoral political participation are significantly higher than women (Desposato and Norrander Reference Desposato and Norrander2008, 144). The Latin American gender gap “is partly explained by individuals' characteristics but also varies contextually with the presence of female elites and the level of political liberties” (2008, 142).
Researchers have debated the explanations for the development of the U.S. gender gap. Some argue that the development of the U.S. gender gap was largely a result of modernization in postindustrial societies (Clark and Clark Reference Clark and Clark2008; Inglehart and Norris Reference Inglehart and Norris2003). As a result of modernization, women's lives in the United States have changed in relation to increased opportunities in the labor force, attaining higher education and autonomy, and changing cultural attitudes. However, previous research finds that economic development can significantly matter more at the individual level rather than the societal level (Desposato and Norrander Reference Desposato and Norrander2008, 161).
Further, a group of researchers have argued that the U.S. gender gap is mostly the result of the movement of men toward a more conservative ideology and also away from both parties as political independents (Kaufmann and Petrocik Reference Kaufmann and Petrocik1999; Norrander Reference Norrander1999; Norrander and Wilcox Reference Norrander and Wilcox2008). Others find that the U.S. “partisan gender gap has grown when the political climate moved in a conservative direction, the economy deteriorated, and the percentage of economically vulnerable, single women increased” (Box-Steffensmeier, DeBoef, and Lin Reference Box-Steffensmeier, Boef and Lin2004, 515). Additionally, the gender differences have also been explained by focusing on the “differences in political interest, information, and efficacy” among men and women (Conway Reference Conway and Whitaker2008, 172). Overall, this mixture of factors has produced a partisan gender gap where men are more likely to support the Republican Party and women are more likely to support the Democratic Party (Box-Steffensmeier, DeBoef, and Lin Reference Box-Steffensmeier, Boef and Lin2004, 527).
Since the 1980s, the gender gap in the United States is most evident in the social and political attitudes of men and women (Andersen Reference Andersen, Norrander and Wilcox1997). Women also support the Democratic Party at higher rates than men (e.g., Clark and Clark Reference Clark and Clark2008; Kaufmann and Petrocik Reference Kaufmann and Petrocik1999). The gender gap also has explicit electoral implications, especially in terms of electoral results. The size of the gender gap is often larger than the margin of victory for Democratic congressional and presidential candidates (Manza and Brooks Reference Manza and Brooks1998). Consequently, political parties will strategically appeal to the women in the electorate, hoping to sway or capitalize on their vote choice. Further, the women's movement and most press coverage on U.S. politics have increasingly focused on the political implications of these gender differences (Norris Reference Norris and Carroll2000).
Racial/Ethnic Minority Women and the Gender Gap
We have little information on how this political gender gap is displayed for the racial/ethnic minority groups in the United States, especially among the immigrant-based groups like Latinos and Asians. In earlier studies, researchers generally found that the political differences between racial groups are more a factor of race or ethnicity rather than gender (Burns, Schlozman, and Verba Reference Burns, Schlozman and Verba2001; Conway Reference Conway and Whitaker2008, 171; Lien Reference Lien1998).
Lien found that socioeconomic status accounted for most political participation differences between whites and nonwhites, with minority women displaying lower participation rates compared to white women and their male counterparts (Reference Lien1998, 877–78). The gender gap was less distinct than the racial or ethnic gap in political participation (Burns, Scholzman, and Verba Reference Burns, Schlozman and Verba2001; Lien Reference Lien1998), and Lien argues that gender was least useful as a predictor of political attitudes for Latinos (Reference Lien1998, 886). In Lien's study, she found that Asian women and Latinas are “unlikely to turn out or to register at different rates than their male counterparts” (Reference Lien1998, 885). Further, white women were the only female group to report greater support for the Democratic Party or the Democrat presidential candidate (885).
However, several earlier studies report very mixed findings on the gender differences for Latino party identification. In state-specific (Texas and California) research on Mexican Americans, Brischetto and de la Garza (Reference Brischetto and Garza1983) found that the women are less likely to identify with the Republican Party than their male counterparts (Montoya, Hardy-Fanta, and García Reference Montoya, Hardy-Fanta and García2000). During the 1990s, “a gender gap existed among whites and Latinos, with men in both groups more frequently labeling themselves as conservatives” (Lien Reference Lien1998, 177). In contrast, research by Welch and Sigelman (Reference Welch and Sigelman1992) demonstrated that Hispanic women were generally “more liberal and more supportive of the Democratic Party than were Hispanic men” (Conway Reference Conway and Whitaker2008, 171). When a Latino gender gap in party identification is evident, the direction of the gaps seems to vary by national origin group (Montoya, Hardy-Fanta, and García Reference Montoya, Hardy-Fanta and García2000). Compared to their male counterparts, “Mexican and Puerto Rican women are more likely to identify with the Democratic Party” (2000, 556), and Cuban women are more likely to identify with the Republican Party (Uhlaner and Garcia Reference Uhlaner and Garcia1998).
In 1996, Montoya documented a growth in the Latino gender gap in public opinion attitudes. When a Latino gender gap in public opinion is evident, the size of the gaps has also varied by national origin group (García-Bedolla, Monforti, and Pantoja Reference García-Bedolla, Monforti and Pantoja2007; Montoya Reference Montoya1996). The gender gap in minority female voter turnout has grown in the last few presidential elections. “Women have voted at higher rates than men among Blacks, Hispanics, and Whites in the last five presidential elections” (CAWP 2005). Moreover, in 2004, the gender gap in presidential vote choice was evident for all women across racial/ethnic groups, with women more likely to support the Democratic candidate compared to their male counterparts (CAWP 2004). Since 2004, this modern partisan gender gap is also more perceptible for racial/ethnic minority groups than white voters.
There are many unanswered questions on the more recent possible gender differences for Latino political attitudes. Latinos may demonstrate a similar gender gap to their white counterparts; however, it may only become evident with a more in-depth analysis and understanding of the Latino population. Further, gender gaps may not be readily evident if scholars do not “look to the social and political incorporation of Latinos and to the structure of their political opportunities to explain the differences” (Montoya, Hardy-Fanta, and García Reference Montoya, Hardy-Fanta and García2000, 559).
Gender Gap across Latino Generations
This study includes a broader examination of political gender differences among the diverse U.S. Latino panethnic population. The Latino population provides a variety of generational differences within one panethnic group in the United States. The Latino community can include as many as six generational distinctions, with foreign-born Latinos that are influenced by their home country experiences, as well as native-born Latinos who are socialized in the United States. This can produce both structural and cultural explanations of the gender gap that can be influenced by the Latino immigrant experience.
Previous comparative research has not fully explored the gender differences in political behavior for immigrant populations (Inglehart and Norris Reference Inglehart and Norris2003). Previous research by Inglehart and Norris included a comparison of social groups within societies by examining “cohort analysis to compare the size and direction of the ideological gap among older and younger generations” (2003, 85). The premise for the Inglehart and Norris (Reference Inglehart and Norris2003) examination of cohort effects was that the effects “emerge when formative experiences during childhood, adolescence, and early adulthood leave an enduring imprint on basic social values and core political attitudes” (85). The significance of the cohort effects is more evident in postindustrial societies, “where the modern gender gap in ideology is strongest among the younger age groups, while the traditional gender gap persists among the elderly” (2003, 99).
The previous research does not account for populations constantly evolving with each new wave of immigrants. The cohort analysis cannot explain how immigrant groups coming from a developing nation to a postindustrial nation will shape the gender gap dynamic. To expand this previous research, I explore the influence of gender on Latino political ideology, especially for different Latino generations in the United States.
In particular, the U.S. Latino panethnic community encompasses a cultural grouping of people from more than 22 mainly Spanish-speaking nations. This diverse population includes a good test of the generational differences within one panethnic group in the United States. Latinos migrating from more developing societies to the postindustrial United States may follow the path expressed by traditional assimilation theories (Gans Reference Gans1992; Gordon Reference Gordon1964), where they will begin to grow into the attitudes and behaviors of their new host society over time and generations. They may also follow the path expressed by modernization theories that hold immigrant groups migrating to a postindustrial society will experience economic gains and develop and modernize their group attitudes (Norris and Inglehart Reference Inglehart and Norris2003). There is also concern that the groups will carry and retain their traditional home country attitudes and behaviors with them to their new host country (Bejarano, Manzano, and Montoya Reference Bejarano, Manzano and Montoya2011).
ARGUMENT AND METHODS
This project compares the size and direction of the Latino political ideology gender gap with a breakdown by gender, national origin, nativity, and generational status. The central hypothesis is that later generations of Latinos will be more likely than first-generation Latinos to show evidence of a realignment process in their political ideology, whereas women will move to the left of the men in later generations. Latinas in later generations will be more likely to report a liberal political ideology and identification with the Democratic Party.
To examine the gender differences in political ideology, the study utilizes cross-national data from the 2006 Latino National Survey (LNS). The 2006 LNS survey data include 8,634 (unweighted) interviews with Latino adult residents, 18 years and older, of the United States (Fraga et al. Reference Fraga, García, Hero, Jones-Correa, Martinez-Ebers and Segura2006). The data are drawn from 17 states and the District of Columbia. The selected states include those with the largest Latino/Hispanic population in the country, as well as four additional states (Arkansas, Georgia, Iowa, and North Carolina) that account for emerging and rapidly growing Latino populations (2006).
The nationally representative sample of 8634 Latino-origin respondents was drawn from a random sample of 11 million Latino self-identified households in the United States, with a margin of error ±1.05%. The “sample was stratified by geographic designation, meaning that each state sample was a valid, stand-alone representation of that state's Latino population.”Footnote 1 This valid sample includes approximately 90% of the Latino population in the United States. Telephone interviews were conducted in English and Spanish (and sometimes both) between November 2005 and August 2006.Footnote 2 The national data set allows for a random sample of various Latino national origin groups in the country, as well as the ability to distinguish between six generational cohorts. These extensive data also provide an in-depth analysis of the factors that can influence a Latino gender gap with the addition of some Latino-specific variables, such as national origin, Spanish language proficiency, generational cohort, and percentage of life spent in the United States.
DATA ANALYSIS: LATINO POLITICAL IDEOLOGY AND PARTISAN IDENTIFICATION
This analysis uses indirect evidence of generational analysis to compare the size and direction of the U.S. Latino ideological gender gap, the Latino gender differences in political ideology, and partisan identification. This analysis utilizes two 2006 LNS questions to assess Latinos' political ideology and partisan identification.
Latino Political Ideology
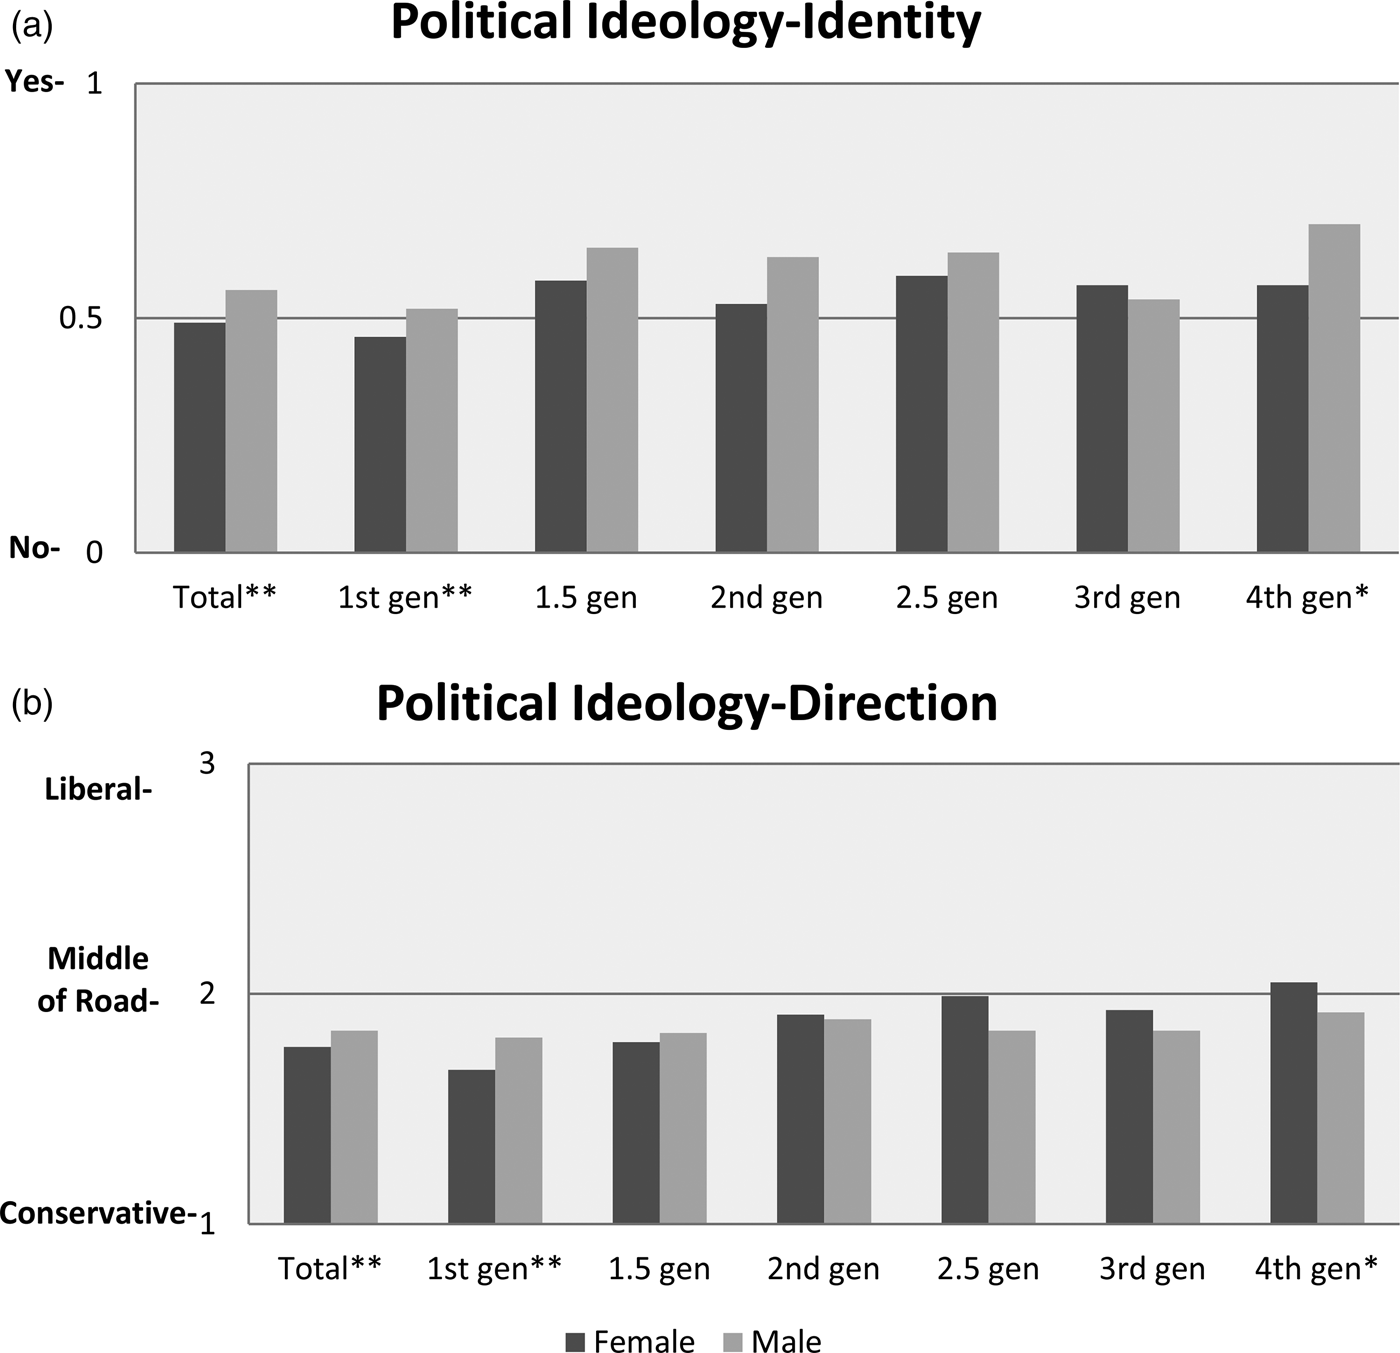
To assess political ideology, Latinos were asked, “Generally speaking, in politics do you consider yourself as conservative, liberal, middle-of-the-road, or don't you think of yourself in these terms?” Ideological identity is coded to differentiate among the respondents who either report an ideological identity (coded as one) or report that they do not think in ideological terms (left-right) or don't know their political ideology (coded as zero). A high number of Latinos in the 2006 LNS dataset do not identify with a political ideology (48%). Instead, some Latinos either report that they do not think in left-right ideological terms (31%) or that they don't know (17%). Figure 1 demonstrates that first-generation Latinos in particular are more likely than fourth-generation Latinos to report no ideological identity. In addition, Latinas have lower reporting of an ideological identity compared to their male counterparts, which is significant in the first and fourth generations. This uncovers a gender dynamic with Latinas showing a higher incidence of not identifying with a political ideology.
Latino political ideology.

Latinos who identify with a political ideology respond with the direction of that ideology. Of the Latinos that placed their political views on a left-right ideology scale, 44% report a conservative ideology (coded as one), 32% prefer the middle of the road (coded as two), and 24% identify with the liberal ideology (coded as three). Figure 1 also shows that the more recent Latino immigrants are generally more conservative than later generations in the United States, more specifically the fourth-generation Latinos. Across the earlier to later generations, Latinos demonstrate significantly different responses in their political ideology. In particular, Latinas in the first and 1.5 generation report significantly different political ideologies, more conservative than Latinas in the later generations.
The generational pattern is most evident for the Latinas as compared to their male counterparts. There are significant gender gaps among Latinos in the first and fourth generation, with Latinas reporting a slightly more conservative political ideology than Latino men in the first generation. However, Latinas in the fourth generation are then significantly more liberal than their Latino male counterparts. This shows evidence of realignment in Latina political ideology across generations, which is parallel to the U.S. modern gender gap phenomenon.
Latino Partisan Identification
To assess partisan identification, Latinos were asked, “Would you consider yourself a Democrat, a Republican, an Independent, some other party, or what?” Partisan identity is coded to differentiate among the respondents who report a partisan identity (coded as one) or report that they don't care, don't know, or identify with another party (coded as zero). The remaining analysis then compares the direction of Latino political ideology and partisan identification. Slightly fewer Latinos do not identify with a partisan identity (36%), compared to an ideological identity. Some Latinos report that they don't care (16%), don't know, or identify with another party (20%).
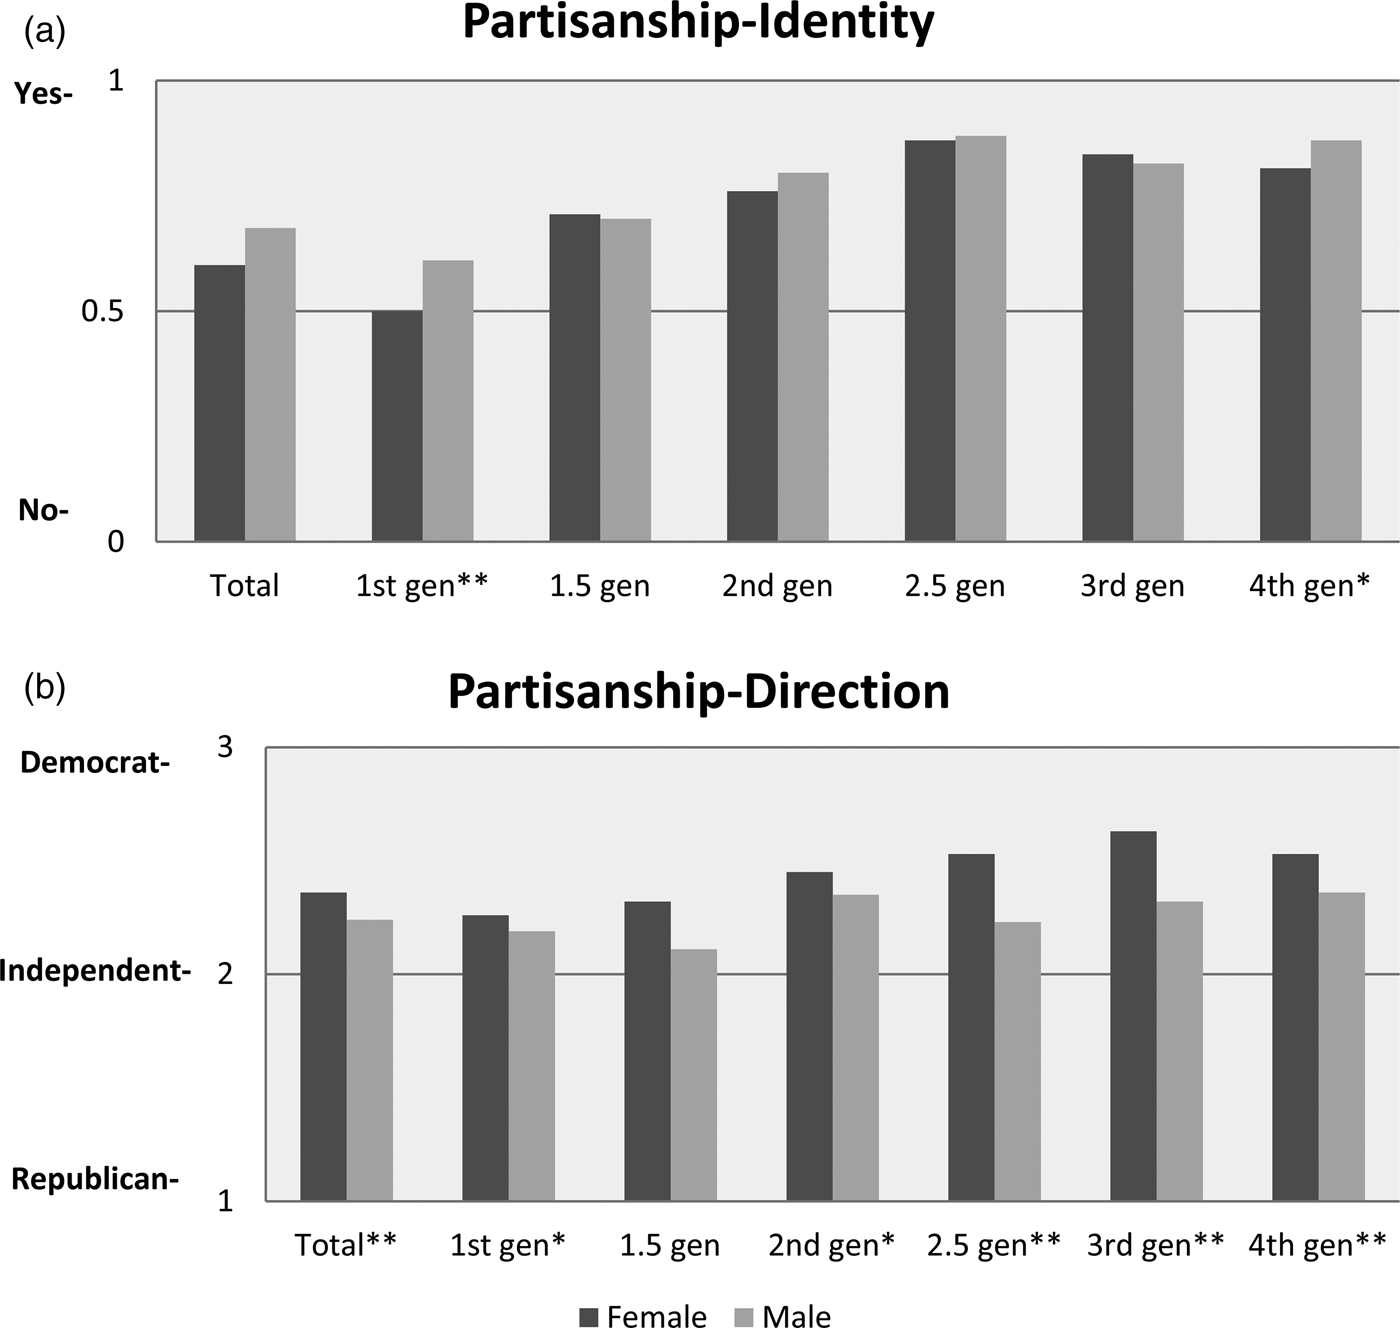
Figure 2 reveals that more Latinos in later generations report a partisan identity compared to the Latinos in earlier generations. This pattern supports the previous research findings that “a large segment of the Latino community does not identify with either the Republican or the Democratic Party (Alvarez and García-Bedolla Reference Alvarez and García-Bedolla2003; Hajnal Reference Hajnal2004; Hero et al. Reference Hero, García, García and Pachon2000; Pachon and DeSipio Reference Pachon and DeSipio1994)” (Garcia and Sanchez Reference Garcia and Sanchez2008, 188). In addition, the recent work of Hajnal and Lee (Reference Hajnal and Lee2011) points to the increasing trend of many Asian and Latino immigrants not reporting a partisan identity. The nonidentifiers, about 38% of the Latino population and 36% of the Asian American population, do not provide responses on the party-identification scale; instead their responses are “don't know” or “none of the above” (2011, 5). The factors that covary with their partisanship are “longevity in the United States, generation, socioeconomic status” (178). This trend points to a growing problem for the two political parties since the population of immigrant-based groups is on the rise.
Latino partisan identification. Significance test for differences: *p < = .05, **p <= .01.
This previous work, however, does not address the interacting influence of gender and generation on Latino partisanship. In terms of gender, similar to the results for ideological identity, there are gendered patterns of partisan identification. First-generation and fourth-generation Latinas have a significantly lower reporting of partisan identity compared to Latino males. This signals a compounded problem for the political parties since they are not fully attracting a large portion of the Latina population.
The Latinos who identify with a party respond with the particular direction of that partisanship. Among the Latinos who self-identify with a political party, 56% choose the Democratic Party, 26% the Republican Party, and 18% identify as an Independent (coded as two). A majority of Latinos, across all generations, identify with the Democratic Party. In addition, more Latinos in later generations report identification with the Democratic Party (63% to 66% in the third and fourth generations), than Latinos in earlier generations (53% in the first generation).
In terms of gender, there is a significant gender gap in partisan identity, with Latinas (60%) reporting a closer affinity to the Democratic Party than Latino males (52%). In addition, Latinas are significantly more supportive of the Democrats than Latino males across almost all the generations (except for the 1.5 generation).
MULTIVARIATE ANALYSIS: INDEPENDENT VARIABLES (SOCIAL STRUCTURE AND LATINO SPECIFIC VARIABLES)
This gender analysis also incorporates several variables to capture social structure and cultural values, with additional Latino specific predictors. First, the social structure measures consist of gender, age, education, religiosity, employment, marital status, children, and political interest to capture relevant aspects of social background. This set of individual-level factors has traditionally been used to explain changing ideological values and political behavior among men and women (Inglehart and Norris Reference Inglehart and Norris2003). The analysis of the 2006 LNS includes 3,896 male (45%) and 4,738 female (55%) respondents. Home ownership is used as a proxy measure of class status or income and is coded as a dichotomous variable where one indicates being a home owner and zero indicates being a renter. The support for more liberal ideology is “expected to vary systematically according to structural factors, namely, participation in the paid labor force, class, education, marital status, union membership, and religiosity, as well as according to cultural factors, including attitudes toward gender equality” (Inglehart and Norris Reference Inglehart and Norris2003, 81).
Previous research investigating the sources of the gender gap generally use standard explanatory models that are more useful in explaining the gender differences in political behavior and attitudes among white Americans (Conway Reference Conway and Whitaker2008, 181). It is imperative that the explanatory models be more “focused on the experiences, relevant attitudes, and policy concerns within each” racial/ethnic group (2008, 182). The “future research examining differences in racial and ethnic patterns of political participation needs to draw more specifically on the experiences and social circumstances of racial and ethnic minorities” (2008, 182).
The LNS also offers a variety of Latino-specific information, including family history of immigrant experience. This allows researchers to identify six distinctive generational cohorts. First, respondents identify their country of birth and family origin ancestry. Foreign-born respondents provide their age at immigration, and all respondents are asked about country of birth for their parents and grandparents. This information provides six distinctive generational cohorts. The first generation is foreign-born and arrived in the United States after the age of 10. The 1.5 generation is also foreign-born, but they arrived in the United States by 10 years of age. Next, second-generation Latinos are U.S.-born and have two foreign-born parents. The 2.5 generation consists of those with one parent born in the United States and one foreign-born. The third generation has both U.S.-born parents. Finally, the fourth generation has grandparents who are U.S.-born. These categories explain how far removed individuals are from the immigrant experience and signal degrees of American assimilation (Bejarano, Manzano, and Montoya Reference Bejarano, Manzano and Montoya2011).
Specific to the Latino population in the United States, I account for national origin with variables for Cuban, Puerto Rican, Dominican, and other Central/South American included in the models. Mexican is the excluded variable in the analysis, which accounts for the largest Latino national origin group in the 2006 LNS survey (as well as the U.S. Latino population). I also account for Spanish language proficiency for the Latino respondents. Language usage was assessed by asking Spanish language interviewees, “How good is your spoken English? Would you say you could carry on a conversation in English (both understanding and speaking) very well, pretty well, just a little, or not at all?”
MULTIVARIATE RESULTS
The following analysis examines the influence of gender and generation on Latino political ideology and partisan identification after additional social structure factors are incorporated. There is a significant within-generation difference in the development of an ideological or partisan identity. As a result, I utilize the Heckman selection bias modeling technique for the remaining analysis (Heckman Reference Heckman1979; Timpone Reference Timpone1998). The first equation of the models examine if Latinos report having an ideological or partisan identity with logistic regression, while the second equation models the direction of the ideological or partisan identity with ordered logistic regression. The benefits of the selection bias model include the ability to show whether there is a gender gap in the acquisition of political identities that may diminish across generations and whether there is a gender gap in those political identities that changes over generations.
The selection bias models include logistic regression analysis to evaluate the effects that gender, social structure, and Latino-specific variables have on political ideology and partisan identification. The models also include interaction terms for the gender and generation of all respondents, which provide more insight regarding the ideological-gender dynamic in each of the generations.
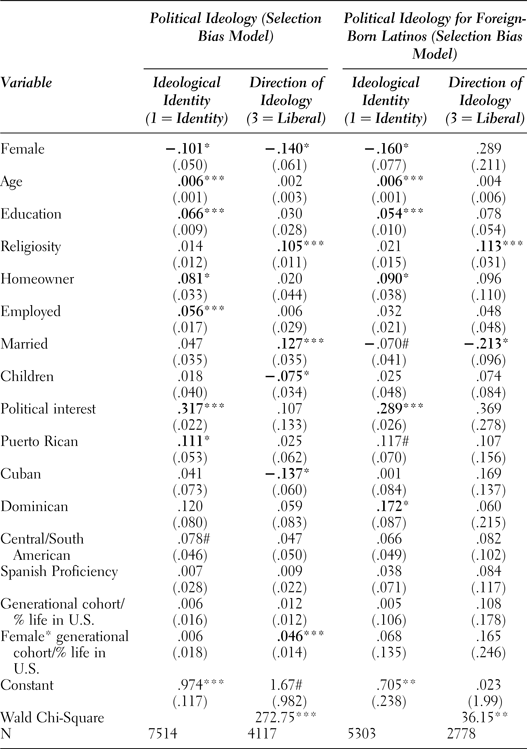
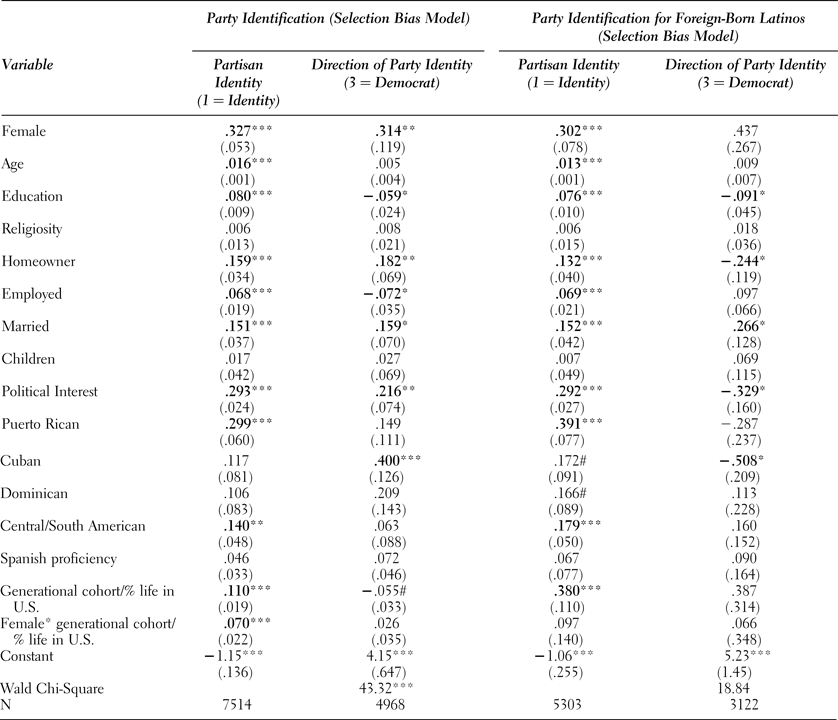
Table 1 includes selection bias models for the dependent variable of political ideology. The results of the analysis are presented in Table 1, with the models for all Latinos reported in the first two columns and the models for foreign-born Latinos reported in the last two columns.
Generation and gender on U.S. Latino political ideology
Note: Cell entries are logistic and ordered logistic coefficients and standard errors. Significance: #p <= .10, *p <= .05, **p <= . 01, ***p <= . 001. Data source: 2006 LNS.
The first equations in Table 1 demonstrate that Latinas are generally less likely than Latino males to report an ideological identity. However, Latinas in later generations are not significantly less likely to report an ideological identity compared to their male counterparts. Several social structure variables influence the reporting of a political ideology in the first equations. Latinos who are older, highly educated, politically interested homeowners are more likely than Latinos who are younger, less educated, less politically interested renters to report an ideological identity.
The second equations demonstrate that Latinas are also less likely than Latino males to report a liberal political ideology; however, Latinas in later generations are more likely to hold a liberal ideology. There is a different set of social structure variables that influence the direction of Latino political ideology in the second equations. Latinos who are highly religious and married are more likely than their less religious and single counterparts to report a liberal political ideology. Latino-specific variables do not have a consistent effect on reporting an ideological identity or ideological direction.
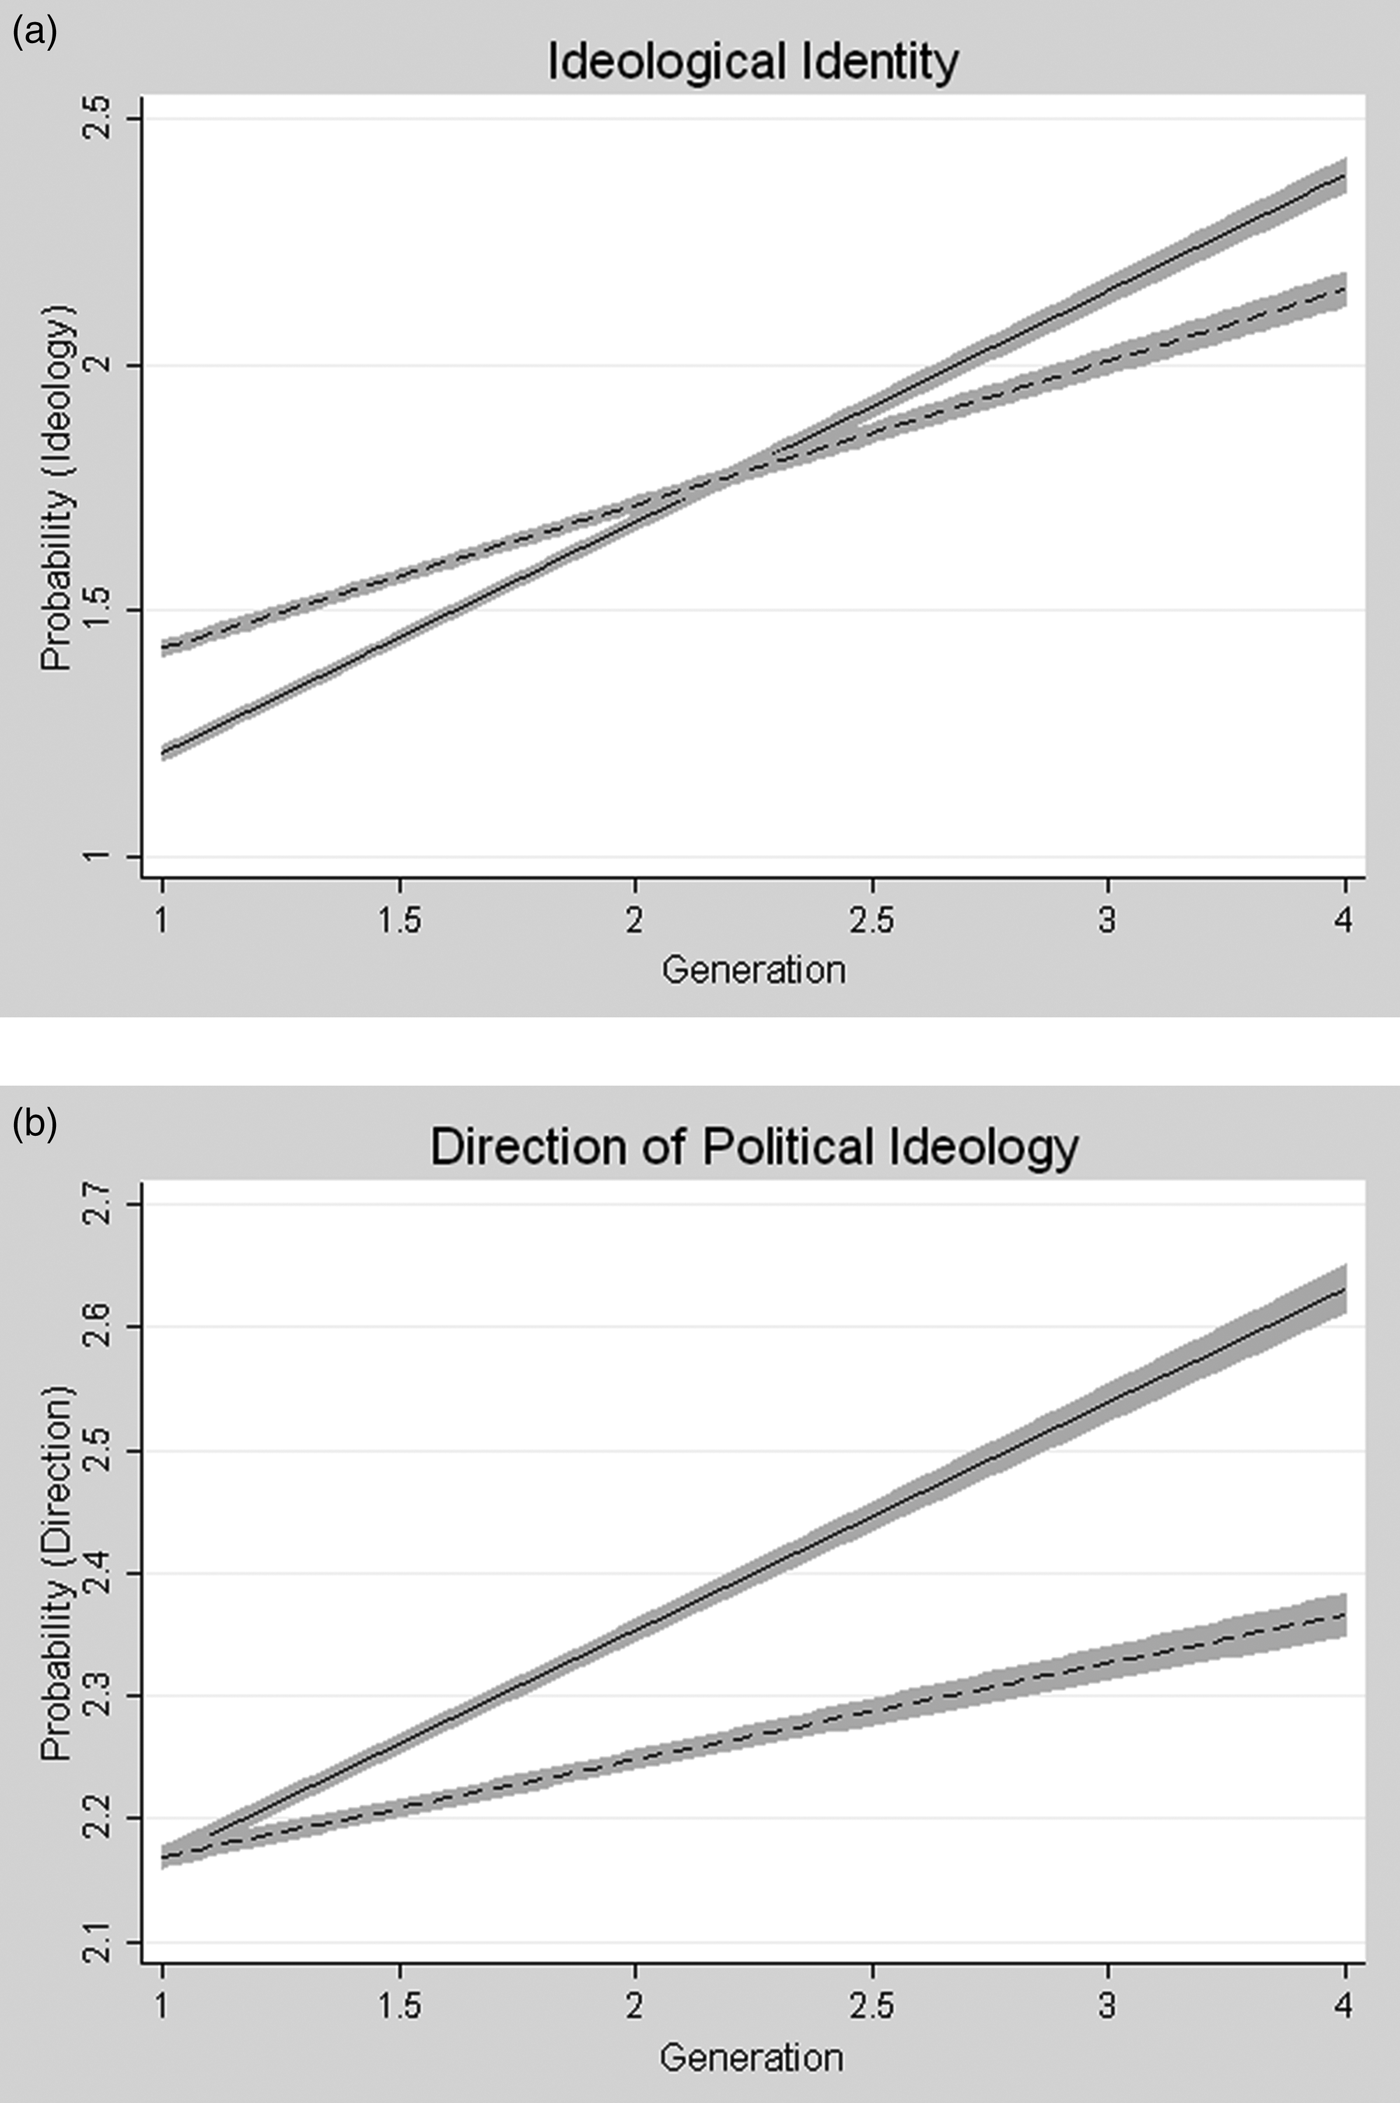
Figures 3 and 4 better illustrate the influence of Latino gender on political ideology across the full range of generational cohorts or percent of life spent in the United States. Figure 3 shows the gender of the respondent and the probability of holding an ideological identity and the direction of political ideology across the range of Latino generations, first generation through fourth generation. The first plot in Figure 3 shows that Latinas have a lower probability than Latino males of reporting a political ideology in the first generation. Latinas increase their probability of holding a political ideology in later generations, with Latinas in the 2.5 generation through fourth generation demonstrating a higher probability of reporting a political ideology than their male counterparts. The second plot in Figure 3 shows that Latinas increase their probability of holding a liberal political ideology across later generations, which is also higher than Latino males. Latino males report a more consistent political ideology across the generations. Overall, Latina identification with an ideological identity and, more specifically, a liberal political ideology increases progressively from the first generation to the fourth generation.
Influence of generation and gender on Latino political ideology.
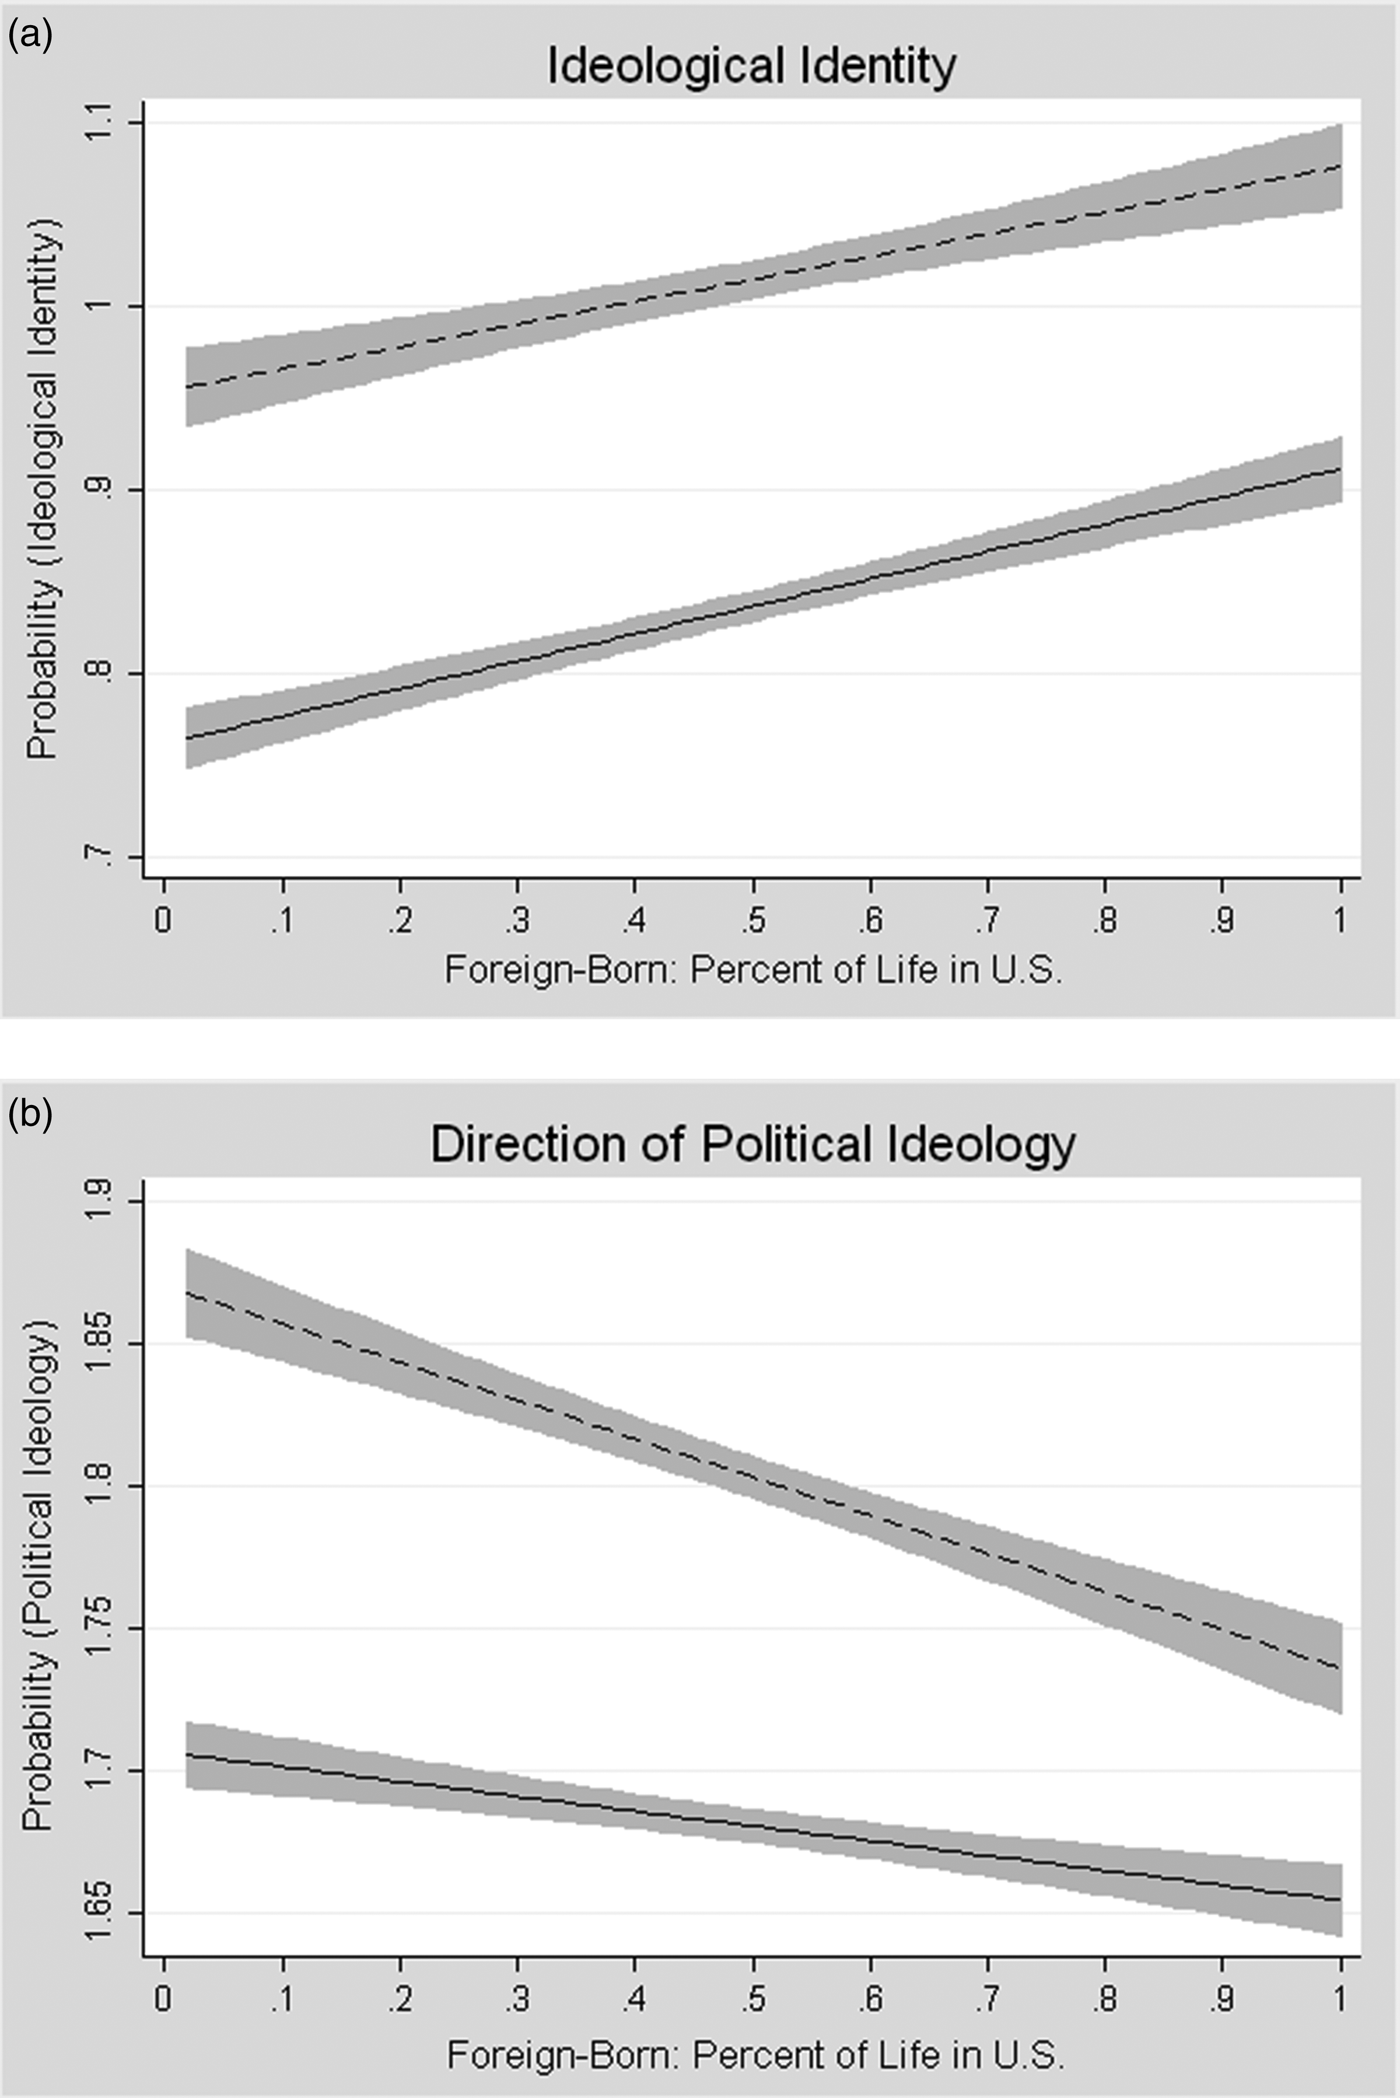
Figure 4 shows the same political ideology plots for the foreign-born Latinos, with the range of percent of life spent in the U.S. The first plot in Figure 4 shows that foreign-born Latinos' probability of reporting an ideological identity increases progressively as they have spent a greater percentage of their life in the U.S. In addition, Latinas have a lower probability of reporting a political ideology than Latino males. The second plot in Figure 4 shows that foreign-born Latinos have a progressively lower probability of reporting a liberal political ideology as they spend a greater percentage of their life in the United States. Latinas also have a lower probability of reporting a liberal political ideology than Latino males.
Influence of generation and gender on foreign-born Latino political ideology.
Table 2 includes selection bias models for the dependent variable of partisan identification. The results of the analysis are presented in Table 2, with the model for all Latinos reported in the first two columns and the models for foreign-born Latinos reported in the last two columns.
Generation and gender on U.S. Latino partisan identification
Note: Cell entries are logistic and ordered logistic coefficients and standard errors. Significance: #p <= .10, *p <= . 05, **p < =. 01, ***p <= .001. Data source: 2006 LNS.
The first equations in Table 2 demonstrate that Latinas are generally less likely than Latino males to report a partisan identity. However, Latinas in later generations are more likely than their male counterparts to report a partisan identity. Further, the addition of the generational cohort dimension provides an additional test of partisan expectations, whereas Latinos in later generations are more likely than their counterparts to hold a partisan identity. The social structure variables have similar influences on partisan identity as they did on political ideology (from Table 1). Latinos who are older, highly educated, employed, single, politically interested homeowners are more likely than their counterparts to hold a partisan identity.
The second equations demonstrate that Latinas are more likely than Latino males to report a Democratic partisan identity. Overall, gender remains a significant predictor to the measures of partisan identification for Latinos. Further, Latinos who are highly educated, married, and politically interested renters are more likely than their counterparts to report a Democratic partisan identity. Further, Puerto Ricans and Central/South Americans are more likely than Mexican respondents to hold a partisan identity, while Cuban respondents are less likely than other national origin groups to report a Democratic partisan identity.
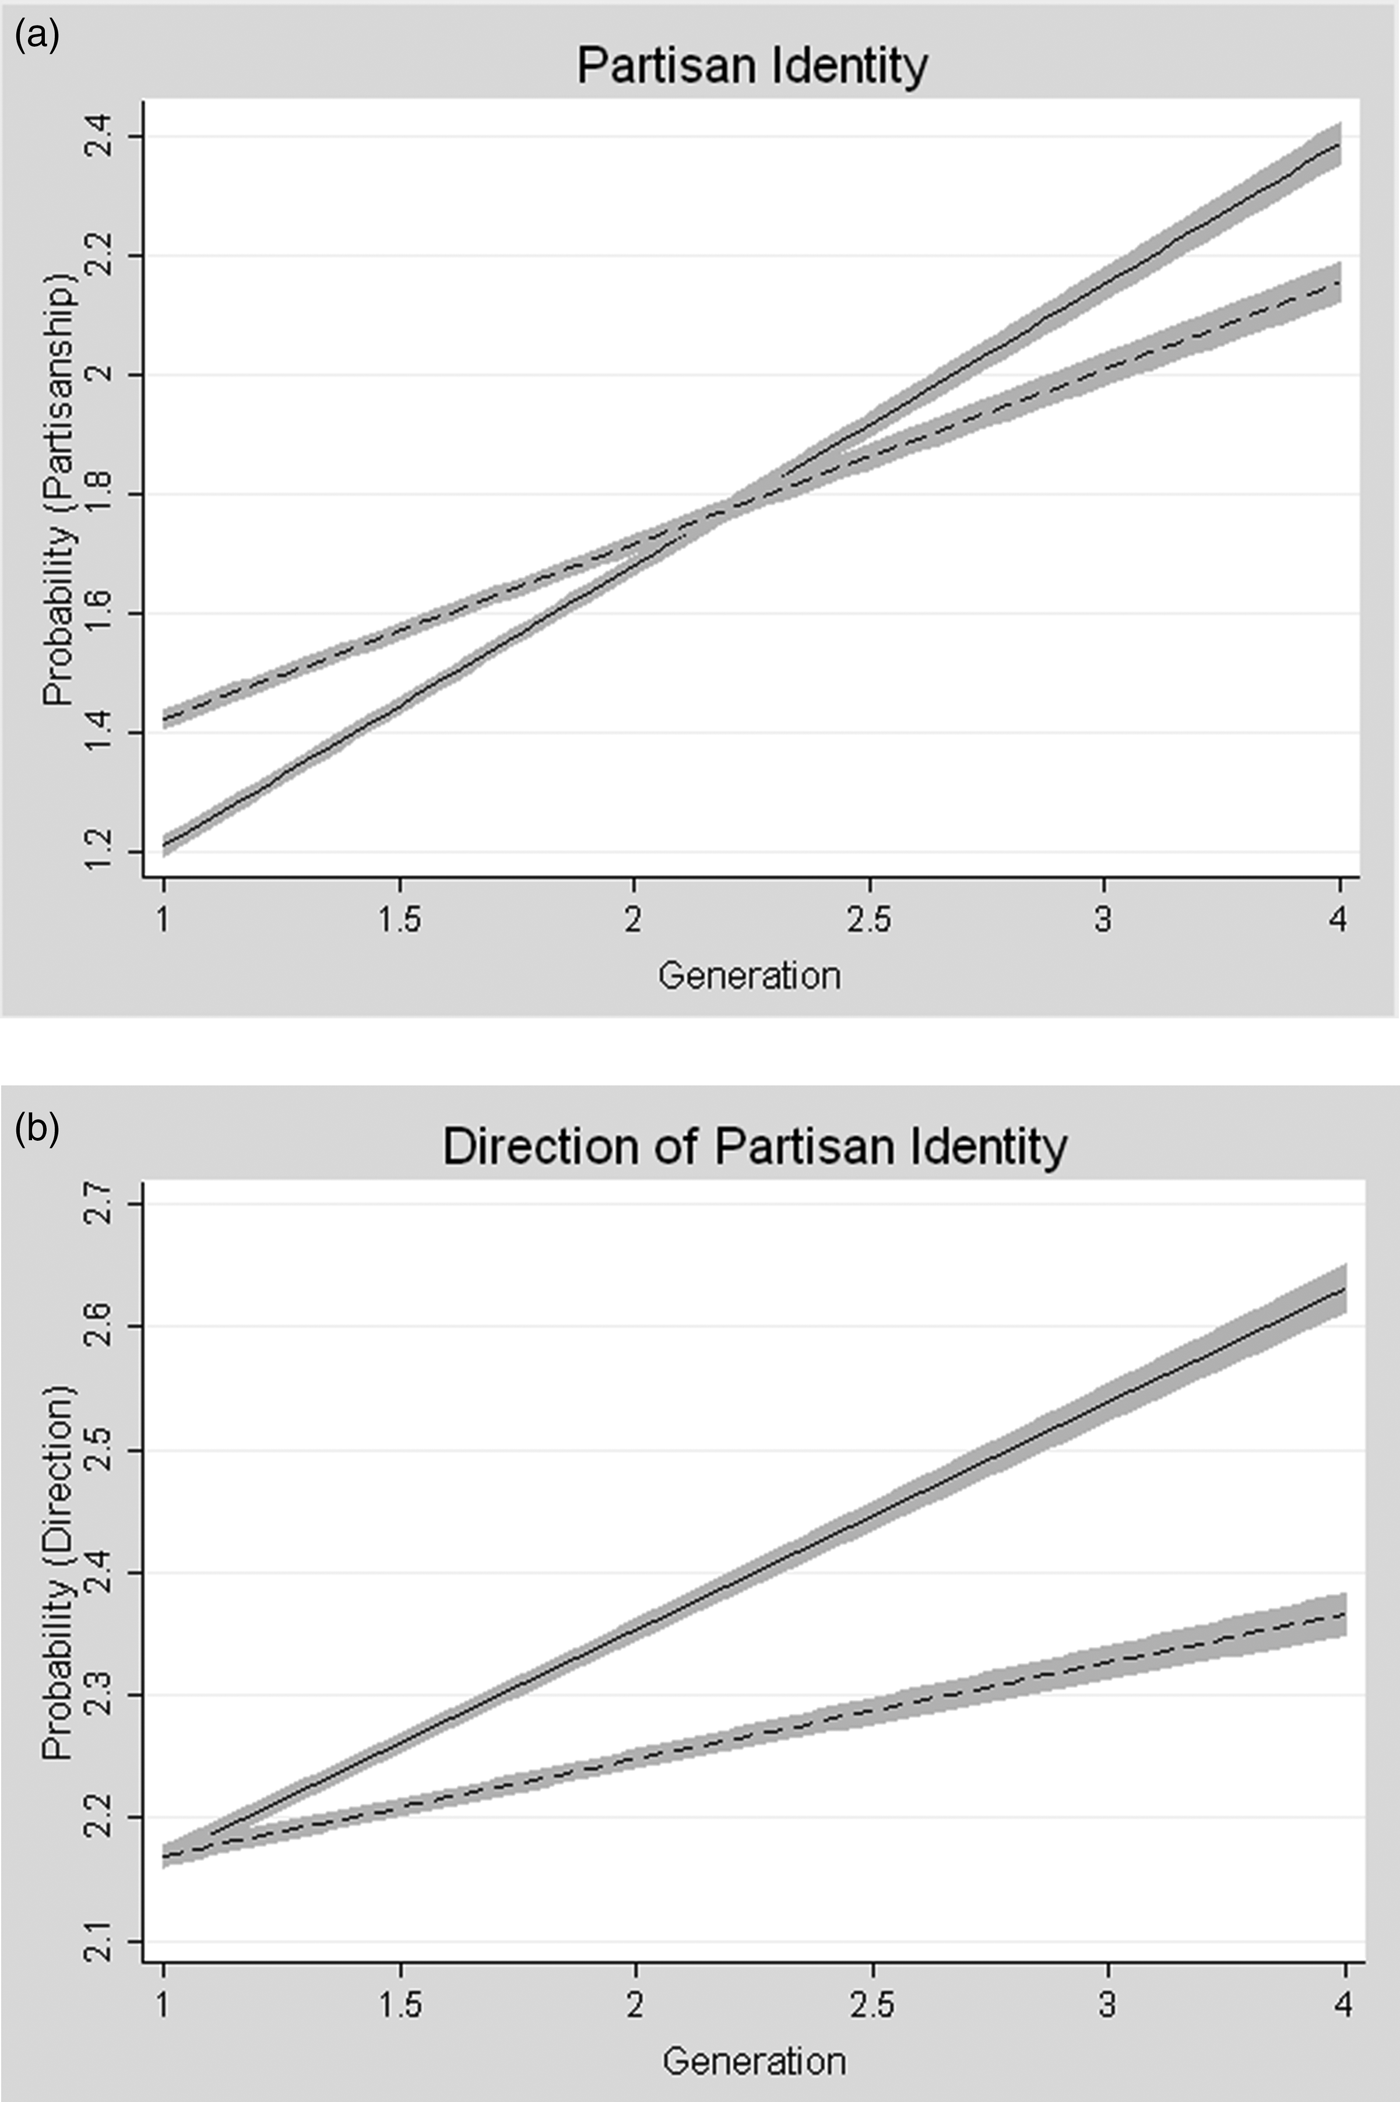
Figures 5 and 6 include plots of the influence of generation and gender on the probability of Latino partisan identity across the range of Latino generations, first generation through fourth generation. The first plot in Figure 5 shows that first-generation Latinas have a lower probability than first-generation Latino males of reporting a partisan identity. However Latinas increase their probability of holding a partisan identity in later generations. Similar to Figure 3, Latinas in later generations (2.5 through fourth generation) surpass their male counterparts in identifying with a partisan identity. The second plot in Figure 5 shows that Latinas increase their probability of holding a Democratic partisan identity across later generations. In addition, Latinas have a higher probability of reporting a Democratic partisanship than Latino males.
Influence of generation and gender on Latino partisan identification.
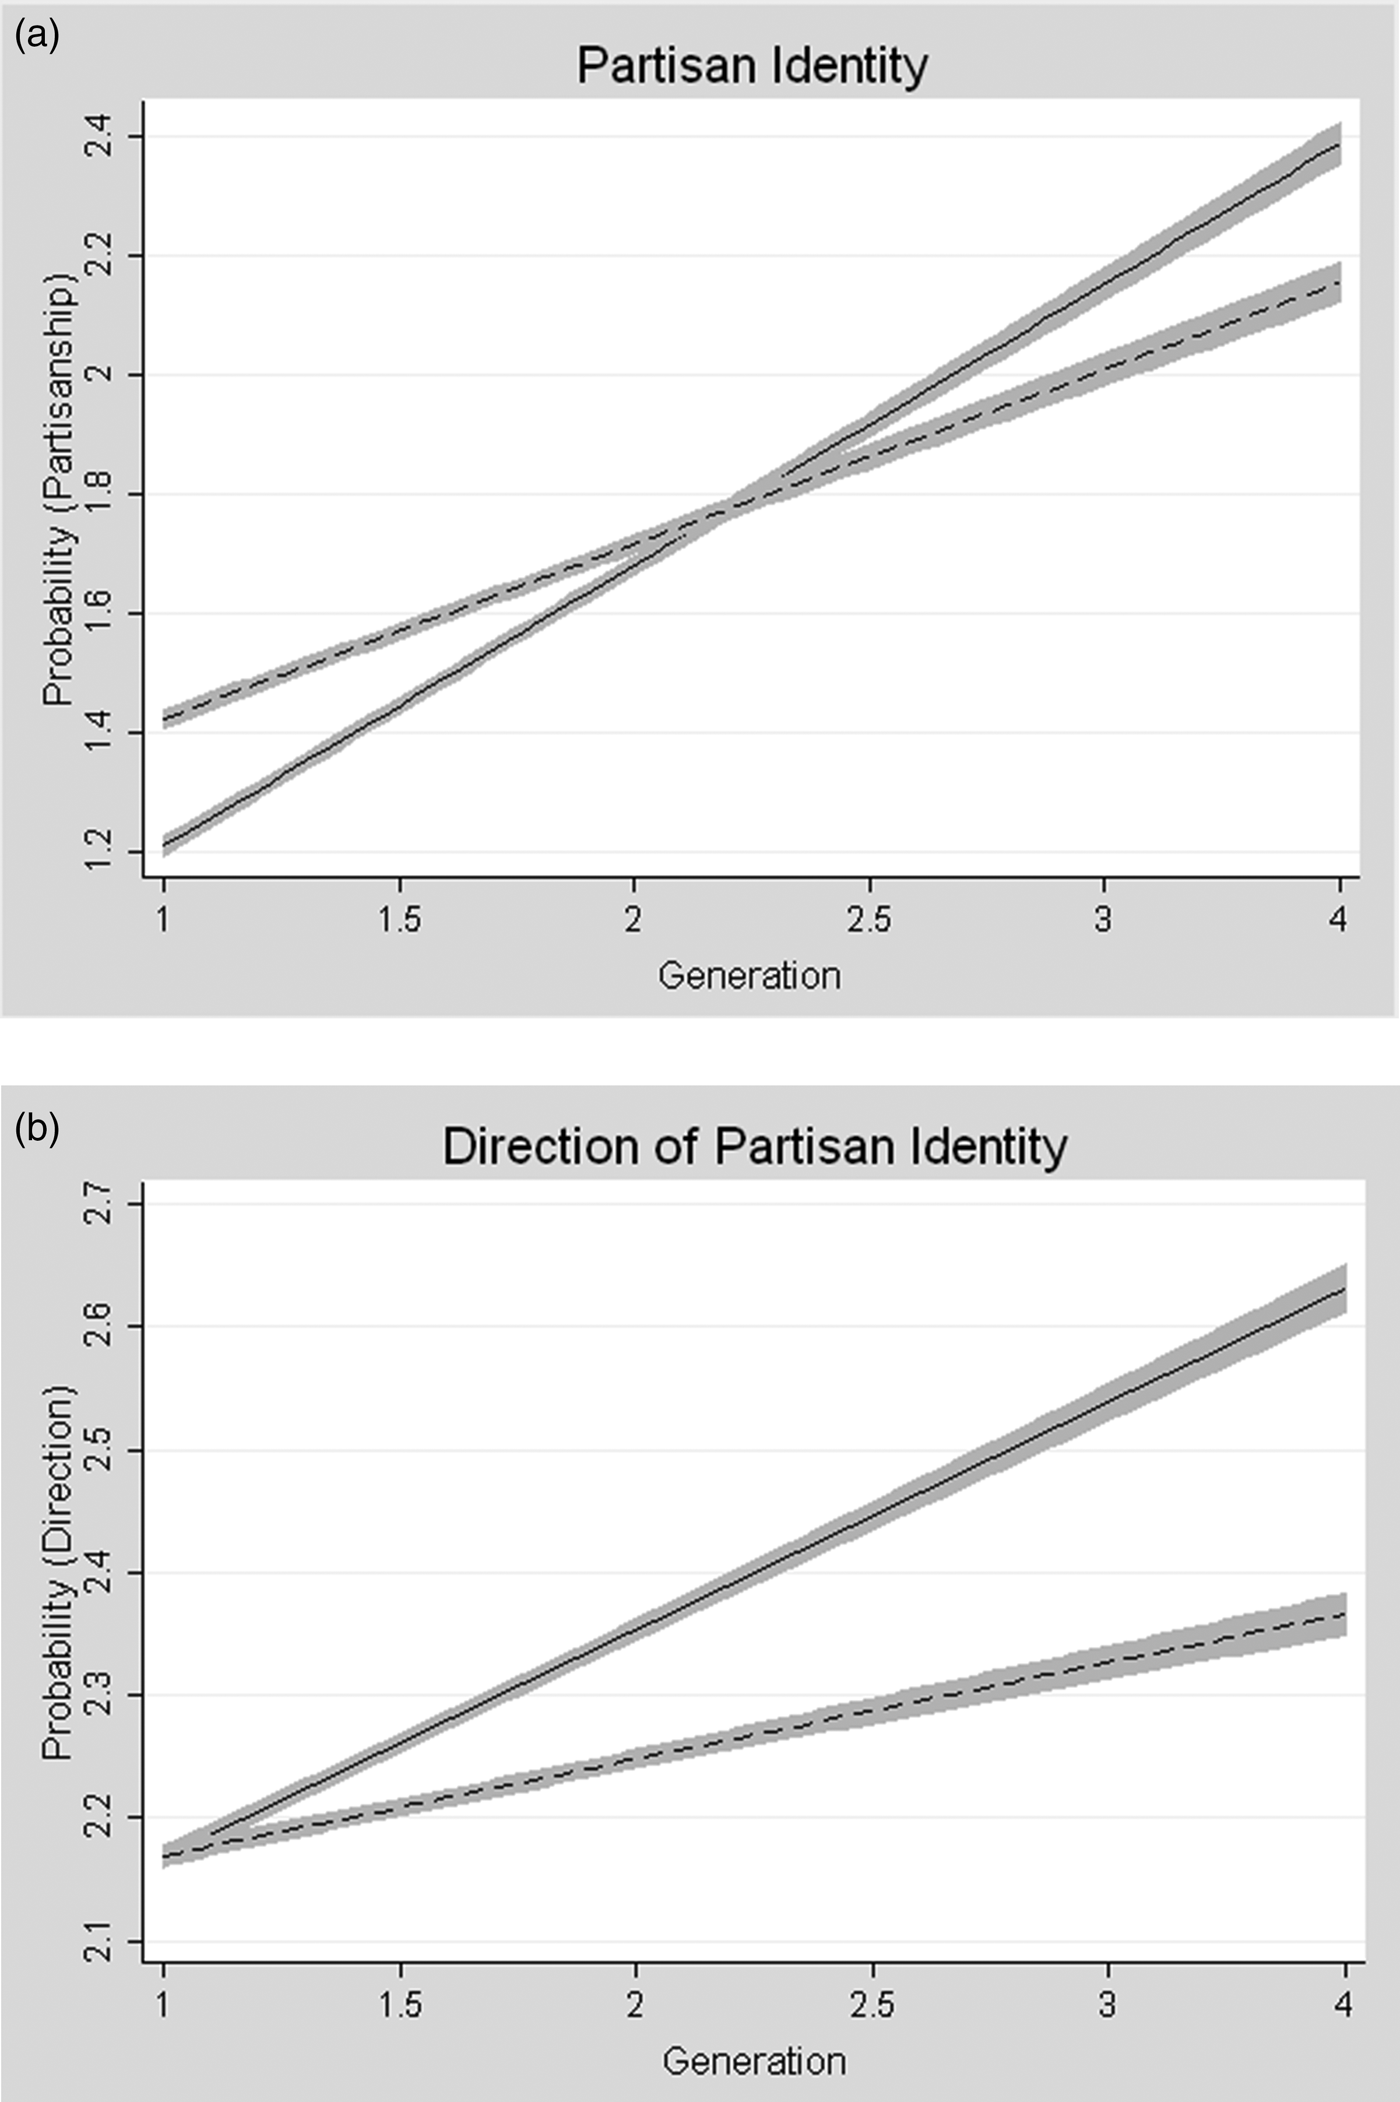
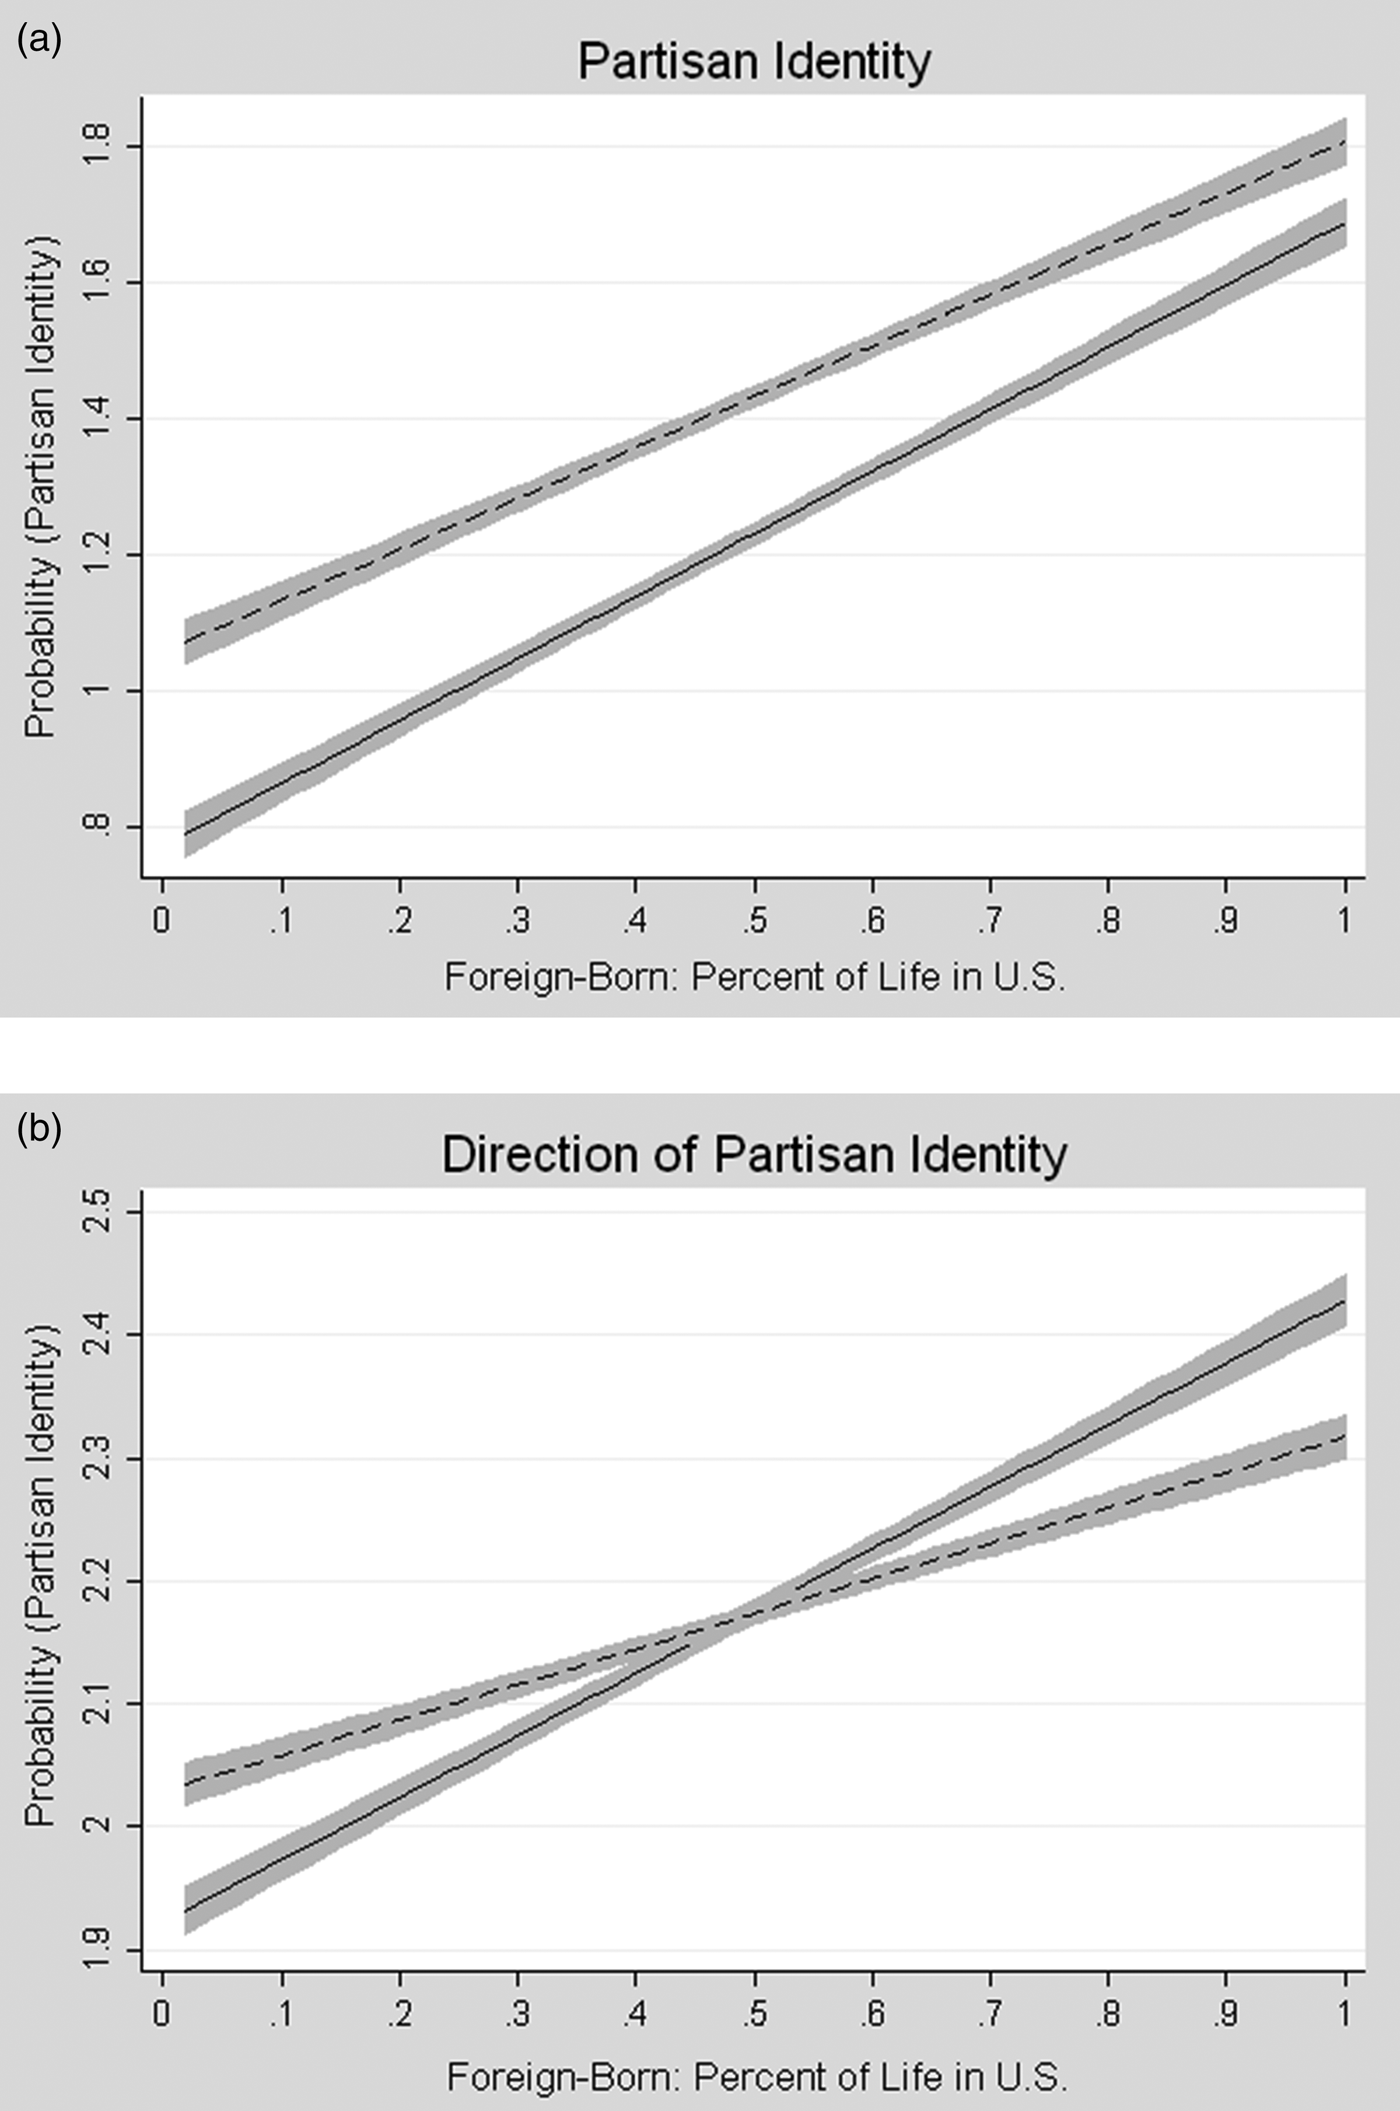
Figure 6 shows the same party identity plots for the foreign-born Latinos, with the range of percent of life spent in the United States. The figure shows that the probability of holding a partisan identity progressively increases for foreign-born Latinos as they spend a greater percentage of their life in the United States. There is also a gender gap, with foreign-born Latinas having a lower probability of reporting a partisan identity than Latino males. In terms of the direction of partisan identity, foreign-born Latinas who have spent less than 40% of their life in the United States have a lower probability of reporting a liberal partisan identity than their male counterparts. However, this relationship flips as Latinas have spent more than 40% of their life in the United States. There is realignment in Latina partisanship with foreign-born Latinas displaying a higher probability of identifying with the Democratic Party compared to Latino males, as they have spent a greater proportion of their life in the United States.
Influence of generation and gender on foreign-born Latino partisan identification.
CONCLUSION
In this paper, I examined the influence of gender and generation on Latino political ideology. I expanded on previous gender gap research, such as the Inglehart and Norris developmental theory of the gender gap (Reference Inglehart and Norris2000; Reference Inglehart and Norris2003), by incorporating additional factors that can influence gender differences in Latino political attitudes, including Latino-specific factors such as their particular generational cohort or percentage of their life spent in the United States.
The results demonstrate that later generations of Latinos are more likely than first-generation Latinos to hold a political ideological or partisan identity. Foreign-born Latinos are also progressively more likely to hold an ideological or partisan identity as they spend a greater proportion of their life in the United States. However, the results do not conform strictly to traditional assimilation theories (Gans Reference Gans1992; Gordon Reference Gordon1964) or modernization theories (Norris and Inglehart Reference Inglehart and Norris2003). As Latinas acculturate (spend more time in the U.S.), they are more likely than Latino males to identify with a political ideology and party identity. Further research explores the influence of gendered acculturation experiences on Latina political attitudes and behavior (Bejarano Reference Bejarano2014).
The results also show evidence of a realignment process in Latino political ideology and partisan identity where women will move to the left of the men in later generations. There is a Latina ideological gap across generational cohorts with later generations of Latinas holding more liberal ideologies and higher levels of Democratic Party identification, compared to first-generation Latinas. Further, there is only one significant gender gap apparent for first-generation Latinos, with Latinas holding more conservative political ideologies than Latino males.
This demonstrates that by including additional Latino-specific factors in a study shows Latina realignment in their political ideology across generations, which is similar to the U.S. modern gender gap phenomenon. Therefore, further gender gap analysis needs to capture the particular Latino immigrant experience in the United States, with the addition of Latino generational exploration.
The Latina gender gap can have far-reaching political implications on electoral politics. As Latinas have been in the United States for longer periods of time, they are more likely than the Latino men to support Democratic congressional and presidential candidates. This can have far-reaching political implications for the major political parties as they attempt to mobilize increased political support from the Latino population. The Latino political gender gap can also be steering a large amount of the Latino political influence in electoral politics, especially in politically influential states. Further research explores the major political party's strategic mobilization and courting of the Latina electorate (Bejarano Reference Bejarano2014). As the Latino population highlights their growing political sway, the political parties can have better strategic mobilization tactics if they realize the dynamic ideological changes that occur as a result of Latino generations.