Significant outcomes
• Hypermethylation of SIRT1 gene was found in the leucocytes of AD patients.
• Specific primers were designed and used to distinguish AD from control group by MSP method.
• The significant demethylation of APP gene was also observed in the leucocytes of AD patients.
• The gene expression level of SIRT1 gene reduced in the leucocytes of AD patients compared with control group.
• Compared with control group, significant elevated gene expression of APP gene in the leucocytes of AD patients was found.
Limitations
• As difficult to get the samples, we still cannot get the information for methylation pattern of these genes in the brain tissue.
• There is still potential weakness on the wider application of using SIRT1 gene as biomarker for testing of AD, and more samples are still needed for further testing and validation.
• The relationship between methylation pattern of SIRT1 from other tissues and AD pathogenesis is still needed further research.
Introduction
Alzheimer's disease (AD), a complex neurodegenerative disorder, is the most prominent cause of dementia among the elderly. To date, more than 4.5 million people developed to dementia worldwide every year, and the number of sufferers would have a dramatic increase of over 115 million in 2050 Reference Zetzsche, Rujescu, Hardy and Hampel1. AD is characterised by the progressive metabolic, morphological and functional decline, as well as subsequent loss of cognitive function Reference Marques, Oliveira, Outeiro and Pereira2. It often results from abnormal changes for brain, which is most considered to appear before cognitive impairment, and other clinical symptoms become apparent. Thus, efforts aiming at identifying methods of early detection and diagnosis for improving AD care might be the most appropriate strategy to initiate promising new treatments and/or prevention Reference Pasinetti3. As a limitation in the diagnostic sensitivity and specificity of various tests, there is no single diagnostic test for AD. As recently proposed, diagnosis of AD is still based on the integration of clinical examination, neuropsychological data, radiological and biological analyses with biomarkers for the disease Reference Elmoualij, Dupiereux, Seguin and de la Monte4. As for these testings, biomarkers are increasingly used in the research setting to detect onset of the disease and to track progression Reference Boss5. During the past years, great efforts have been made to identify reliable biomarkers in body fluids for AD patients, which are suitable for minimal invasion early diagnosis of AD, mainly from cerebrospinal fluid (CSF) and blood Reference Elmoualij, Dupiereux, Seguin and de la Monte4. CSF closely reflects the composition of the brain extracellular space and is likely to have the highest yield for biomarkers Reference Wiltfang, Lewczuk and Riederer6. The CSF collection by lumbar puncture is an invasive, expensive and time-consuming procedure; therefore, the detection of biomarker molecules in blood would be more accessible. Nonetheless, in comparison with CSF biomarkers, discovering reliable biomarkers for AD in peripheral blood has not been successful and has not been a solid diagnostic method Reference Elmoualij, Dupiereux, Seguin and de la Monte4. Therefore, exploring some interesting biomarkers and establishing convenient techniques with low cost, rapid and high accuracy which could be used routinely in clinical diagnosis are still important goals for all researchers.
Epigenetic mechanisms could modulate the coordinate expression of various genes through many different pathways Reference Chouliaras, Rutten and Kenis7. DNA methylation has been one of the most studied aspects of epigenetic modification. It often occurs through the addition of a methyl radical to the cytosine base adjacent to guanine (CpG dinucleotides). Moreover, the CpG dinucleotides are always concentrated in regions named CpG islands. In the human genome, CpG islands preferentially locate in promoter regions Reference Bird8. Usually, when DNA is methylated in the gene promoter region, the expression or function of the gene could be changed Reference Bird8. Alterations in 5-methylcytosine patterns on the promoters of genes are the first level of regulation of gene expression in development, differentiation, carcinogenesis and aging. Because of a huge progression of wide-scale analysis techniques and their applications to the study of epigenetics, relations between DNA methylation and AD have been focused on recently.
SIRT1, mammalian orthologue of Sir2, is a member of Sirtuin family of NAD+-dependent protein deacetylases. SIRT1 has been shown to correlate with metabolism, stress responses, cellular survival, transcription, aging and many other processes Reference Pfister, Ma, Morrison and D’Mello9, Reference Wojcik, Mac-Marcjanek and Wozniak10 . Increasing evidences also suggest a robust neuroprotective effect of SIRT1 on AD and other neurodegenerative diseases Reference Pfister, Ma, Morrison and D’Mello9. Otherwise, some other genes such as β-amyloid precursor protein (APP), apolipoprotein E4 (ApoE4), microtubule-associated protein τ (Tau), presenilin 1 (PS1) and presenilin 2 (PS2), have been shown to be directly involved in AD pathology/progression Reference Liang, Dunckley and Beach11, Reference Liang, Dunckley and Beach12, Reference Mastroeni, Grover, Delvaux, Whiteside, Coleman and Rogers13, Reference Weeraratna, Kalehua and Deleon14. Their expressions or mutations may play important roles in the pathological process of AD Reference Chouliaras, Rutten and Kenis7Reference Barabash, Marcos and Ancín15, Reference Bentahir, Nyabi and Verhamme16, Reference Findeis17, Reference Migliore and Coppedè18. However, there is no study yet to evaluate the methylation patterns of these genes between AD patients and normal population. Therefore, in this study, DNA methylation status of SIRT1 and several other AD-related genes (APP, ApoE4, PS1, PS2 and Tau) in AD patients and the normal population were examined to investigate the relationships between DNA methylation and AD pathogenesis. Hopefully, a molecular marker could be found for clinical diagnosis of AD.
Materials and methods
Sample collection and DNA extraction
Peripheral venous blood (5 ml/person) was obtained from 63 AD patients (AD: male, 31; female, 32; mean age, 80 ± 11 years), and 72 volunteers without dementia and neurological degenerative disease were chosen as controls (control: male, 33; female, 39; mean age, 77 ± 15 years) at the Guangzhou Brain Hospital, Guangzhou Senior Hospital and Guangdong General Hospital. These two groups were age, sex, scholarity and vascular disease matched. AD patients were selected according to National Institute of Neurological and Communicative Diseases and Stroke/Alzheimer's Disease and Related Disorders Association (NINCDS-ADRDA) criteria for probable AD Reference Morris19. Individuals who suffered from cancer, diabetes, hypohepatia, hypothyroid, hypertension, renal insufficiency and serious malnutrition and those who had received organ transplant were excluded. Peripheral blood leucocyte genomic DNA was extracted by using QIAamp Blood Mini kit (Qiagen, Hilden, Germany) according to the manufacturer's instructions.
Bisulphite treatment
For bisulphite treatment, genomic DNA of each sample was performed bisulphate modification by EZ DNA methylation-Gold kit (Zymo Research, Orange, USA) according to the manufacturer's instructions. The amount of genomic DNA per treatment was about 300–500 ng. Bisulphated DNA was eluted with 30 µl elution buffer and stored at −80°C for long-term storage.
DNA methylation studies by bisulphite sequencing PCR
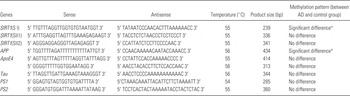
Following evaluation by a program online – MethPrimer, two CpG islands were chosen as target sequences of SIRT1 (SI: the first CpG island of SIRT1 gene; SII: the second CpG island of SIRT1 gene). Regarding the efficiency of bisulphite sequencing PCR (BSP), the second CpG island of SIRT1 was further divided into two parts (SII1 and SII2). In order to amplify the regions of SIRT1 CpG islands after bisulphite conversion, bisulphite-specific primer pairs (BSPs) were used and designed by the assistance of Methyl Primer Express v1.0 (Table 1). No CpG dinucleotides were included in BSP primers to allow the amplification of both methylated and unmethylated sequences. Similarly, the amplifiable regions and BSP primers of APP, ApoE4, PS1, PS2 and Tau were carried out (Table 1).
Parameters used in the analysis of the methylation patterns of different AD-related genes between AD and control groups in the bisulphite sequencing PCR and the corresponding results

ApoE4, apolipoprotein E4; APP, β-amyloid precursor protein; PS1, presenilin 1; PS2, presenilin 2; SI, the first CpG islands of SIRT1 gene; SII1, the second CpG islands of SIRT1 gene (part 1); SII2, the second CpG islands of SIRT1 gene (part 2); Tau, microtubule-associated protein τ.
*Statistical significance between the two groups (p < 0.05).
PCR amplifications were performed as follows: 95°C of initial denaturation for 10 min, followed by (95°C for 30 s, Tm annealing for 30 s, 72°C for 30 s) for 40 cycles, and then with a final elongation step at 72°C for 10 min. Amplifications were carried out in a 9700 Thermal Cycler (Applied Biosystems, Foster City, USA). PCRs were carried out in the volume of 25 µl, including each BSP primer at 0.5 µM, 2 units of hot-start Taq DNA polymerase (Qiagen, Hilden, Germany), 2.0 µl of bisulphite-treated DNA and other standard PCR components. PCR products were purified by PCR Products Purification Kit (Qiagen, Hilden, Germany) and finally eluted in 35 µl of elution buffer. For DNA sequence analysis, the DNA products were subcloned into the pMD18-T vector (Takara, Shiga, Japan) following the manufacture's instructions. For each PCR product, at least five clones were sequenced (Invitrogen, Carlsbad, USA) to ensure its accuracy.
Methylation-specific PCR of SI
On the basis of the results of BSP, specific primers were designed to distinguish the AD patients from normal population by methylation-specific PCR (MSP) method. Primer sequences for the methylated (M) SIRT1 reaction were 5′ GGTGTGTAATGGTGCGATTTC 3′ (forward) and 5′ GAAACGAACAAATCACCTAAAATC 3′ (reverse), and primer sequences for the unmethylated (U) SIRT1 reaction were 5′ GTGTGTAATGGTGTGATTTTGGT 3′ (forward) and 5′ CAAAACAAACAAATCACCTAAAATC 3′ (reverse). Twenty-five microlitres of reaction mixture that contained 10× PCR buffer, 25 mM MgCl2, 2.5 mM deoxynucleotide triphosphates (dNTPs), 1 unit hot-start Taq DNA polymerase (Qiagen, Hilden, Germany), 0.5 µM methylated (M) or unmethylated (U) pair of primers and 2 µl of bisulphated DNA from AD patients or normal people were used for each reaction systems of MSP. PCR amplifications were performed as follows: 95°C of initial denaturation for 15 min, followed by (95°C for 30 s, 55°C annealing for 30 s, 72°C for 45 s) for 40 cycles and then with a final elongation step at 72°C for 10 min. Negative control samples that omitted DNA template were included for each set of PCR reactions. Positive standard was prepared as a control for methylated DNA from the healthy control individuals and was fully methylated by treatment with M.SssI methyltransferase (New England Biolabs, Ipswich, USA) according to the conversion protocol. PCR products were analysed on 2% agarose gels and visualised under UV illumination.
Real-time quantitative reverse transcription PCR
Total RNA was prepared from blood samples of AD patients and the healthy control individuals using QIAamp RNA Blood Mini kit (Qiagen, Hilden, Germany) according to the manufacturer's instructions. The quality of total RNA was determined based on A260/A280 ratio, which was 1.7–2.0 for all RNA preparations. Total RNA (60 ng/µl) was reverse transcribed for complementary DNA (cDNA) synthesis by oligo (dT) primers. The cDNA was stored at −80°C until use.
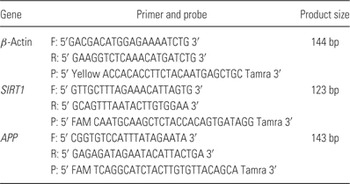
Quantification of SIRT1 and APP mRNA was performed by TaqMan RT-PCR using the ABI Prism 7500 real-time PCR System (Applied Biosystems, Foster City, USA). PCR conditions were 15 min at 95°C, 40 cycles of 15 s at 94°C and 40 s at 55°C. Aliquot of cDNA was used as template for each real-time PCR reaction containing primers and probes for target gene and β-actin. The primer and probe sequences were shown in Table 2. Level of β-actin mRNA was used to normalise the relative expression levels of target mRNA. The relative quantification method, in which the ratio between the amount of target gene and a reference gene within the same sample was calculated, was used for quantifying target gene as previously described Reference Livak and Schmittgen20.
The primer and probe sequences used for real-time PCR

F, forward primer; P, probe; R, reverse primer.
Statistical analysis
Statistical analysis for the methylation profile was based upon the chi-squared analysis by SPSS 13.0 software. For statistical analysis of the mRNA expression level, data for two groups were analysed with Student's t-test, while data for more than two groups were tested by one-way analysis of variance (ANOVA) followed by post hoc analysis (Dunnett test). Difference was considered statistically significant for p < 0.05 and was marked with asterisk in Figs 1–4. Bonferroni correction was performed for multiple comparisons.
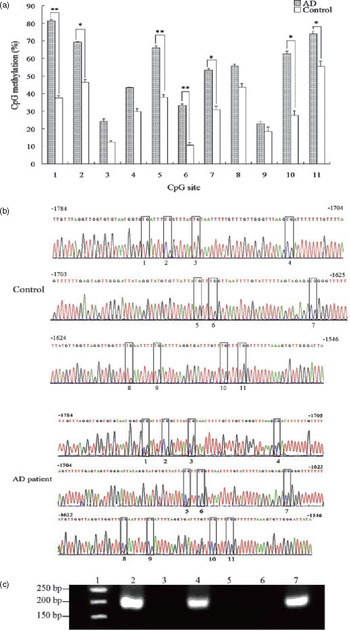
Changes between AD and control groups in the CpG methylation profile of the first CpG islands of SIRT1 gene (SI) were analysed by bisulphite sequencing PCR (BSP) and methylation-specific PCR (MSP) methods. (a) The methylation level analysis for each CpG site of SI by BSP. (b) The sequencing electrophoretograms of the BSP product from bisulphite-treated SI (−1784 to −1546). +1 refers to the transcription start site. The methylated cytosine sites from 1 to 11 were shown in blank boxes. The *The significance between each two groups to which the each side of a white bar was pointed. And significances of the groups were shown respectively by * p < 0.05; **p < 0.01. (c) The electrophoretogram for the PCR products of the first CpG islands of SIRT1 gene (SI) was amplified by MSP. 1: size marker. 2: positive control, 3: negative control. 4: using of methylated (M) primer and bisulphated DNA from AD patients. 5: using of methylated (M) primer and bisulphated DNA from normal individuals. 6: using of unmethylated (U) primer and bisulphated DNA from AD patients. 7: using of unmethylated (U) primer and bisulphated DNA from normal individuals.

Results
DNA methylation profiles of SI in SIRT1 gene were distinctly different between AD and control groups
Results of BSP analysis indicated that the methylation profiles were not same between different CpG islands in corresponding to target sequence of SIRT1. The difference in DNA methylation patterns was only found in the first CpG islands of SIRT1 (SI) between AD and the control groups. Results showed that the whole methylation profile of SI in AD was higher than that of control group (Fig. 1a and b). For different CpG sites of SI, both CpG sites of 1 and 10 were most significantly hypermethylated (p < 0.001, Fig. 1a) in AD groups. Meanwhile, the methylation level on the CpG sites of 5 and 6 were also significantly higher in AD groups (p < 0.01, Fig. 1a). In addition, compared with the corresponding CpG site of control group, the methylation profiles on the sites of 2, 7 and 11 were all significantly higher (p < 0.05, Fig. 1a). Meanwhile, although each of the other CpG sites showed hypermethylation in AD, the difference was not significant between the AD and control groups (Fig. 1a).
In the present study, MSP was also used to further validate the change of methylation pattern between those two groups. Compared with control group, a specific band was acquired by methylated (M) primer and bisulphated DNA as template from AD patients (Fig. 1c). However, no band appeared when using methylated (M) primer and bisulphated DNA from normal individuals. A specific band appeared by unmethylated (U) primer and bisulphated DNA from normal individuals, while no band was found by unmethylated (U) primer and bisulphated DNA from AD patients (Fig. 1c).
Changes of DNA methylation profiles of SI in SIRT1 gene were showed within different severities of AD patients
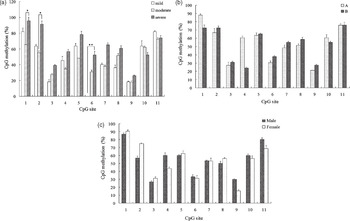
The methylation level of SI of SIRT1 gene changed within different severities of AD patients (Fig. 2a). And the changes were different from each other at different CpG sites of SI. The methylation level at CpG site 6 was higher in the severe AD patients than the mild ones (p < 0.01, Fig. 2a). Besides, compared with the moderate AD patients, the methylation level in severe AD patients were both higher at CpG sites 1 and 2 (p < 0.05, Fig. 2a). Moreover, the methylation profiles of CpG sites 2 (p < 0.05, Fig. 2a) and 6 (p < 0.01, Fig. 2a) had significant associations with the severity of AD. However, no significant associations between the whole methylation profiles and the severity of AD were found (p > 0.05).
Changes in the methylation level of the first CpG islands of SIRT1 gene (SI). (a) The changes within different symptoms in AD patients. Mild: mild AD patients (sample number: 11), moderate: moderate AD patients (sample number: 29), severe: severe AD patients (sample number: 23). Multiple comparisons were performed by Bonferroni correction, and the significance level was corrected. *The significance between each two groups to which the each side of a white bar was pointed. (b) The change between different aged AD patients. (a) less than 80 years old; (b) greater than 80 years old. (c) The changes between male and female AD patients.

Concerning with the methylation profiles of SI in SIRT1 gene of AD patients, no significant association between age and methylation pattern was found (Fig. 2b). Besides, there was no significant difference on the methylation level between male and female AD patients (p > 0.05) (Fig. 2c).
DNA methylation profiles of SII in SIRT1 gene and some other AD-related genes between AD and control groups
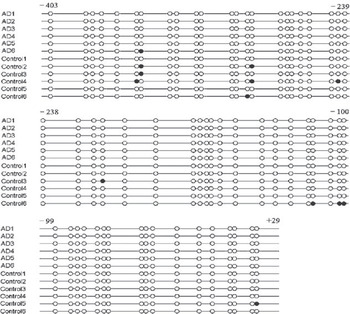
According to the present results, no changes were found on the methylation level of both SII1 and SII2 between AD and the control groups. Besides, almost all the CpG sites were unmethylated either in the sequence of AD or control groups (data not shown). The results showed that the whole methylation level of APP gene in AD patients was lower than that of control group (Fig. 3). In AD groups, the total ratio of unmethylated and methylated CpGs was 98.93 and 0.30%, respectively. However, in the control group, the ratio of unmethylated and methylated CpGs was 95.91 and 3.33% respectively. Compared with control group, the whole methylation level was significantly lower in the AD group (p < 0.05, Fig. 3). Nevertheless, no significant association between methylation pattern and severity, age or gender was found (data not shown). However, for other AD-related genes (ApoE4, Tau, PS1 and PS2), no significant differences of methylation patterns between AD and control groups were found (Table 1).
Methylation patterns of APP gene (−403 to +29) between AD and control group. Each cycle (black or white) represents a CpG site. +1 refers to the transcription start site. Black circles are corresponding to methylated cytosine positions, while white circles are corresponding to unmethylated cytosine positions. AD 1, AD 2, AD 3, AD 4, AD 5 and AD 6 represents randomly selected samples from total of 63 AD samples. Control 1, control 2, control 3, control 4, control 5 and control 6 represents randomly selected samples from total of 72 samples in the control group.

mRNA expression levels of SIRT1 and APP genes in peripheral blood leucocytes of AD patients
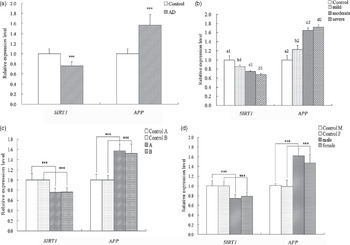
Results revealed that the relative expression level of SIRT1 gene was significantly decreased in AD patients compared with control group (Fig. 4a). And the relative expression level of SIRT1 gene all showed a decrease either in the mild, moderate or severe AD patients than that of control group (p < 0.001) (Fig. 4b). Besides, compared with the mild AD patients, the relative expression level of SIRT1 gene was significantly decreased in the moderate (p < 0.05) and severe (p < 0.001) AD patients. Although significant differences were found between AD patients and control group, no significant correlation between age/gender and SIRT1 gene expression level was shown in AD patients (p > 0.05, Fig 4c and d).
mRNA levels of SIRT1 and APP genes in AD patients. (a) Real-time PCR analysis for mRNA levels of SIRT1 and APP genes between AD and control groups. AD: AD patients; control: control groups. ***p < 0.001 between AD and control groups. (b) Real-time PCR analysis for mRNA levels of SIRT1 and APP genes between different symptoms of AD patients. Mild: mild AD patients (sample number: 11), moderate: moderate AD patients (sample number: 29), severe: severe AD patients (sample number: 23). a1 versus b1, c1, d1; b1 versus d1; a2 versus b2, c2, d2; b2 versus c2, d2, p < 0.001. b1 versus c1, p < 0.05. (c) Real-time PCR analysis for mRNA levels of SIRT1 and APP genes between AD patients with different ages. (a) Less than 80 years old. (b) Greater than 80 years old. ***p < 0.001 between AD and control groups. (d) The changes between male and female AD patients. ***p < 0.001 between AD and control groups.

Compared with control group, results of real-time PCR showed that more than 1.5-times higher expression levels of APP gene in AD patients (p < 0.001, Fig. 4a). Moreover, all of the relative expression level of APP gene increased either in the mild, moderate or severe AD patients than control group. And expression level of APP gene in the mild AD patients was significantly lower than that of moderate and severe AD patients (p < 0.001, Fig. 4b). However, no significant difference of APP gene expression level was shown between different age or gender groups of AD patients (p > 0.05, Fig. 4c and d).
Discussion
The work presented in this paper mainly showed changes of methylation patterns and gene expression level of several genes from leucocytes of AD patients. As is well known, blood collection and diagnosis by peripheral blood are more convenient and humanistic than other tissues such as brain tissue or CSF. Consequently, looking for some useful biomarkers from peripheral blood of AD to provide some useful information for AD diagnosis has been becoming a popular topic. Actually, some researchers have chosen peripheral blood as their research material, and the gene methylation pattern of peripheral blood has been successfully addressed Reference Wang, Oelze and Schumacher21, Reference Sperança, Batista and Lourenço Rda22. Moreover, close relations between epigenetic changes in peripheral blood and the brain of AD also have been found Reference Seshadri23. And some factors in the blood not only affect DNA methylation but also have key relations with the pathogenic mechanism of AD Reference Fuso, Nicolia, Cavallaro and Scarpa24. It should be noted that lymphocytes may be an important neural and genetic probe in AD-related studies. Accordingly, in the present paper, several genes that have been confirmed to have some relations with AD were chosen as the subject, and their methylation patterns and gene expression level in leucocytes of AD patients were investigated. Hopefully, present work might find some interesting biomarkers from peripheral blood for AD diagnosis and provide some information for further pathogenic mechanism research of AD.
Until now, this is the first observation on the methylation status and gene expression level of SIRT1 gene in the peripheral blood leucocytes of AD patients. Both results of BSP and MSP indicated that the significant increase of methylation patterns in the first CpG island of SIRT1 gene occurred in AD patients compared with that of control group. Moreover, present results also showed that there was no change in the other CpG islands of SIRT1 gene between AD and control groups, which may indicate that DNA methylation of SIRT1 gene was related to gene-specific CpG islands, rather than global DNA methylation level. Under most circumstances, DNA methylation is one of the inactivation mechanism alternatives to genetic mechanisms and usually represses transcription. DNA methylation could repress gene transcription either by inhibiting the binding of positive factors to the promoter and/or by recruiting transcriptional co-repressors Reference Chouliaras, Rutten and Kenis7. When genes are methylated in these regions, the transcription machinery may not access the DNA and gene is not expressed Reference Marques, Oliveira, Outeiro and Pereira2. Additional evidence indicated that DNA methylation was linked to histone medication by methyl-binding domain proteins and DNA methyltransferases during regulation of the gene transcription. SIRT1, an important regulator of metabolism, could modulate chromatin function through direct deacetylation of histone as well as by promoting alterations in the methylation of histones and DNA, leading to chromatin silencing and transcription repression. So methylation of SIRT1 may also affect transcription by changing the chromatin structure Reference Chouliaras, Rutten and Kenis7. Therefore, the hypermethylation of CpG island SI might induce the abnormal physiological role of SIRT1. For example, the dysfunction of some transcription factors or other related proteins or the abnormal gene transcription and expression may further cause a series of problems. In the present study, reduced expression level of SIRT1 gene expression in the leucocytes of AD patients was observed. Meanwhile, some relations between the hypermethylation and decrease of SIRT1 gene expression in the leucocytes of AD patients were also shown. SIRT1 gene is of great potential to promote longevity, increase cell survival and prevent against disease. Moreover, evidence from mechanistic studies also provided further support for the possibility that SIRT1 played crucial roles in AD mechanisms by protecting against apoptosis, interfering with the generation of β-amyloid peptides and other processes Reference Wang, Fivecoat, Ho, Pan, Ling and Pasinetti25. Consistent with previous studies, downregulation of SIRT1 mRNA level may have important relations with pathophysiology of AD Reference Wang, Ho and Qin26, Reference Julien, Tremblay and Emond27. Present results implied that DNA methylation of SIRT1 might have some relations with AD onset and/or progression. SIRT1 may be a potential target for developing novel strategies for AD prevention and/or therapy.
In the present studies, not only the hypomethylation of APP gene but also the significant increase of its gene expression in the leucocytes of AD patients was observed and both were consistent with previous observations in AD patients or aged brain Reference West, Lee and Maroun28, Reference Tohgi, Utsugisawa, Nagane, Yoshimura, Genda and Ukitsu29, Reference Elmoualij, Dupiereux, Seguin and de la Monte4. In contrast to hypermethylation, hypomethylation always could activate gene transcription. One of the mechanisms may be due to dysfunction of the transcription repressors, such as methyl-CpG binding domain proteins which are capable of binding specifically to methylated DNA Reference Chouliaras, Rutten and Kenis7, Reference Gonen, Bram and Assaraf31. Increasing of APP gene expression in the peripheral blood leucocytes of AD patients also indicates a correlation between the demethylation of APP and the higher gene expression level. Consistent with previous studies, present results supported that demethylation of APP gene was correlated with the increase of APP mRNA level Reference Jiang, Zhang and Ren30, Reference Ledoux, Nalbantoglu and Cashman32. Hypomethylation of APP gene may alter the transcription and induce the gene over-expression. As one of the most related gene, the over-expression of APP apparently enhances APP and Aβ production, and they play key roles in the pathogenesis of AD. Thus, demethylation of APP may be related to the development of AD.
Except for APP, the over-expression and abnormal regulation of ApoE4, Tau, PS1, PS2 and other AD-related genes in certain areas of the brain were important factors during the development of AD Reference Chouliaras, Rutten and Kenis7. Normally, both hypomethylation and hypermethylation could affect gene transcription and expression Reference Bird8, Reference Lahiri, Maloney and Zawia33. Therefore, the abnormal expression and regulation of these AD-related genes might have some relations with the change of methylation status. However, no statistical differences on DNA methylation frequencies of these genes between AD and control groups were found in the present paper. DNA methylation of ApoE gene, induced by homocysteine, plays a potential role in ApoE expression in atherosclerosis. However, no change on methylation status was found in the promoter of ApoE in AD patients, which was coincided with previous result Reference Yi-Deng, Tao and Hui-Ping34. Besides, no significant difference on methylation patterns in the promoter of PS2 between AD and corresponding control groups was found in the present study. And it was the first study on the methylation status of PS2 in AD patients by BSP method. As for Tau gene, Tohgi et al. indicated that the methylation status of cytosines in Tau gene promoter region altered with age to downregulate transcriptional activity in human cerebral cortex Reference Tohgi, Utsugisawa, Nagane, Yoshimura, Ukitsu and Genda35. However, their samples were autopsy human cerebral cortexes aged 35–90 years which were clinically and pathologically free from neurological disease. Present samples were the more than 60-year-old AD patients. Moreover, it indicated that both AD and aging correlated with DNA methylation Reference Marques, Oliveira, Outeiro and Pereira2, Reference Chouliaras, Rutten and Kenis7, Reference Zawia, Lahiri and Cardozo-Pelaez36. Thus, the different results might be related to different kinds of samples. For the gene PS1, Fuso et al. found that the promoter of PS1 (nucleotides 451–454) was regulated by methylation in cell model Reference Fuso, Seminara, Cavallaro, D’Anselmi and Scarpa37, which was different from the present results. This could be explained from two reasons: firstly, the source of sample was different. Samples of present studies were from AD patients and the normal individuals, but their work was based on cell model. Secondly, the method in our study was BSP rather than HpaII/PCR. Actually, BSP, though complex and time-consuming, could evidence methylation status of each cytosine in the analysed target sequence Reference Clark, Harrison, Paul and Frommer38. Moreover, some other factors might also have influence on the results, such as the environmental factor. Recent studies suggest that environmental factors could be involved in the development of neurodegeneration by inducing epigenetic modifications, such as DNA methylation and chromatin remodeling Reference Chouliaras, Rutten and Kenis7, Reference Debomoy and Maloney39. No significant alteration in the AD patients may indicate that the complex mechanisms of the over-expression of ApoE4, Tau, PS1 and PS2 in the pathogenesis of AD and might not be caused by the under-methylation of their promoters. Nonetheless, gene regulation alone cannot explain the complex pathogenic mechanism of AD. There are still various other trigger factors, such as environment and nutrition Reference Lahiri, Maloney and Zawia33, Reference Debomoy and Maloney39. Further studies should be carried out to explore the detailed information and mechanisms.
Although our present results showed some changes of methylation profiles and mRNA expressions of SIRT1 and APP genes between AD patients and normal population, there were still many limitations, such as limited numbers and kinds of samples, lacking studies on concrete mechanisms. The modification of the DNA methylation patterns of SIRT1 and APP gene indicated that it might take part in the AD pathology/progression. Furthermore, these genes might be potential diagnostic/therapeutic targets for neurodegenerative disorders. If SIRT1 or APP could be used as a biomarker, the diagnosis could be performed by MSP method to observe the methylation status of these target genes in samples. Moreover, if necessary, BSP could be done to find the site of changed cytosine for further study on the concrete mechanisms. However, it is still an idea, there are still potential weaknesses on the wider application of using these genes as biomarker for testing of AD, and more samples still needed for further testing and validation. Further clinical and experimental studies are needed to clarify the role of epigenetic mechanism in the pathophysiology of AD. Therefore, full understanding of the concrete epigenetic mechanism in SIRT1 and APP genes appears urgent and worthwhile.
Acknowledgements
We are grateful to Doctor Guanjie Cheng of Guangzhou Senior Hospital for kindly providing the blood specimens. We appreciate all the patients and volunteers for their participation in this study. This work was supported in part by the National Basic Research Program of China (Grant No. 2006cb500700), the National Natural Science Foundation of China (Grant No. 30470904) and Guangdong Provincial Natural Science Foundation of China (Grant No. 2008B030301320, 2010B031600070) and Guangzhou Science and Technology Project (Grant No. 12C22061584). We would like to express our gratitude to Dr Fanghua Wang and Junting Huang for reviewing the manuscript. Yaping Hou carried out experimental design, drafted and revised the manuscript. Huayun Chen, Yunshao He and Qiong He carried out the experimental design and techniques. Wei Jiang and Tao Luo performed the sample collection and treatment. Nan Mu and Jinhai Duan provided, selected and diagnosed the clinic specimens. Huaqiao Wang provided directions for the conception and the process of the research and final agreement with the version to be published.