Photonic crystal nanolaser
A photonic crystal is a multidimensional periodic structure whose period is similar to its optical wavelength.[ Reference Joannopoulos, Johnson, Winn and Meade 1 ] When the structure comprises high-index-contrast media, it produces a photonic bandgap and acts as a distributed Bragg mirror.[ Reference Yablonovitch 2 ] Therefore, when a cavity is made of an emitting material such as III–V semiconductors and surrounded by a high-index-contrast photonic crystal, it will become a laser.[ Reference Painter, Lee, Scherer, Yariv, O'Brien, Dapkus and Kim 3 ] A cavity size that is comparable with its emission wavelength is often referred to as a photonic crystal defect, whereas a laser with such a small cavity is referred to as a nanolaser. The fabrication of three-dimensional (3D) structures is very complicated, whereas effective 3D optical confinement is achievable by employing a photonic crystal slab comprising a high-index thin membrane with a 2D hole array. Light is confined by the photonic bandgap and total internal reflection inside and outside of the slab plane, respectively.
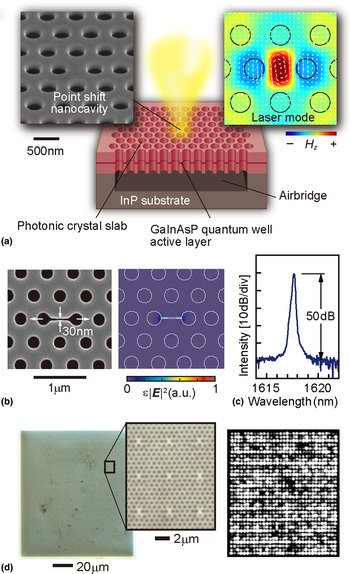
Figure 1 shows the schematic of a nanolaser discussed in this paper.[ Reference Nozaki, Kita and Baba 4 , Reference Kita, Nozaki, Hachuda, Watanabe, Saito, Otsuka, Nakada, Arita and Baba 5 ] As an emitting material, an InP-based semiconductor is often used because the nonradiative surface recombination on processed surfaces is insignificantly large compared with other semiconductors. A GaInAsP single-quantum well and surrounding GaInAsP barrier and optical confinement layers, all of which are epitaxially grown on InP substrate, represent the membrane with a typical thickness of 180 nm. The standard epitaxial wafer is commercially available as a laser wafer at telecom wavelengths (λ) approximately equal to 1.55 µm. The photonic crystal pattern is defined in a resist by e-beam lithography. The hole diameter and hole pitch are typically 260 and 500 nm, respectively. Here high-throughput drawing is possible because the total area of one nanolaser including all holes is smaller than 20 × 20 µm2. The holes are constructed through the resist via inductively-coupled plasma etching using a HI gaseous source at 70 °C. After removing the resist and reactive products chemically, the InP substrate is partially etched by HCl to form an air-bridge photonic crystal slab. Finally, the whole structure is covered with an oxide film, e.g., ZrO2, to protect the semiconductor from harmful chemicals.[ Reference Watanabe, Hachuda, Isono and Baba 6 ] The film's thickness is precisely controlled to several nm, and complete step coverage is achieved using atomic layer deposition.
Photonic crystal nanolaser. (a) Schematic of the scanning electron micrograph (SEM) and calculated modal profile (magnetic field) without the nanoslot. (b) SEM view of the nanoslot cavity and calculated modal profile (electric field). (c) Laser spectrum under the continuous wave (cw) condition in water, without the nanoslot. (d) Integration of 1089 nanolasers. Optical microscope view (left) and near-field pattern of laser emission.

There is a long history with regards to cavity structure optimization aimed at achieving a high Q. The H0-type cavity shown in Fig. 1 has a simple structure, small size, and a high Q. Only some of its holes shift, where a typical shift is 80 nm. The effective modal area is ~1 µm2. The Q is usually larger than 104, which is sufficient for laser operation. To enhance the sensitivity of the laser, a nanoslot of 30–60 nm width is added to the center of the cavity.[ Reference Kita, Nozaki, Hachuda, Watanabe, Saito, Otsuka, Nakada, Arita and Baba 5 ] Such a narrow nanoslot can be constructed simultaneously with the holes. The nanoslot strongly localizes the major modal electric field into the nanoslot. In other words, the electric field is localized well outside the semiconductor, which is advantageous for sensing as discussed later. The diameters of some of the holes around the cavity are periodically modified so that the far-field pattern of laser emission is oriented in the vertical, which simplifies the measurement.[ Reference Narimatsu, Kita, Abe and Baba 7 ] As a result of its simple structure and fabrication process, many nanolasers can be coarsely or densely integrated. During the coarse integration, 25–36 photonic crystal slabs, each having one cavity, are arranged with a pitch of 30–50 µm. During the dense integration, many cavities are formed in one photonic crystal slab with a pitch of 3–10 µm. To date, more than 10,000 nanolasers have been integrated in a ~1 mm2 photonic crystal slab, which was bonded on a host glass substrate.[ Reference Watanabe, Abe, Nishijima and Baba 8 ]
Laser operation can commence in air and even in liquids by room-temperature photopumping using a microphotoluminescence (μ-PL) setup. The laser characteristics are measured by irradiating pump light at λ = 980 nm through a ×50 objective lens, and the laser emission is coupled to an optical spectrum analyzer by the same lens for spectral analysis. Even though the nanolaser is tiny and fragile, the laser can be operated for more than a day without severe degradation. When many nanolasers are integrated, they can be measured one-by-one automatically using a computer-controlled stage. Each device exhibits single-mode lasing under a continuous-wave condition, with an effective threshold power (absorbed power around the cavity) of 1 µW. The laser spectrum exhibits a peak intensity 50 dB higher than the background spontaneous emission level observed in water. However, since the nanolaser has high thermal resistance (>105 K/W), pulsed pumping is typically done for sensing to avoid excess heating around the nanolaser. Even under pulsed pumping, thermal chirping broadens the spectrum by 10 nm width in air and subnanometer levels in water. The nanoslot structure is effective for suppressing the chirping and obtaining a spectral width on the order of 0.01 nm in water, because the positive thermo-optic effect in the semiconductor can be canceled out by the negative one in water where the nanoslot mode is localized.
Nanolaser as a sensor
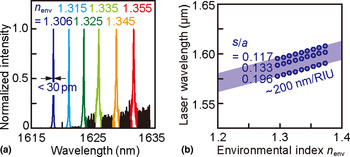
Because the cavity of the photonic crystal nanolaser is exposed to an outer medium, the laser characteristics are directly influenced by the outer medium. When the nanolaser is operated in water, the laser mode penetrates the water in 120 nm depth. Therefore, the modal wavelength is shifted by the environmental index change. In other words, the index change can be sensed from the wavelength shift.[ Reference Lončar, Scherer and Qiu 9 ] Figure 2 shows such a shift that is observed when the nanolaser was operated in liquids with different indices.[ Reference Kita, Nozaki, Hachuda, Watanabe, Saito, Otsuka, Nakada, Arita and Baba 5 , Reference Kita, Nozaki and Baba 10 ] The bulk sensitivities for these liquids are 300–400 and 200–300 nm per refractive index unit (RIU) with and without the nanoslot, respectively. For the sensitivity with the nanoslot, the index resolution can be smaller than 3 × 10⁻⁵ RIU, because the spectral width is on the order of 0.01 nm. However, without temperature control, the nanolaser wavelength fluctuates by ±0.03 nm during continuous, long-term operation and by ±0.1 nm between repeated measurements by removing the nanolaser chip and immersing it in water. Therefore, 5 × 10⁻⁴ RIU is a resolution that can be obtained easily.
Environmental index sensing, n env, using a photonic crystal nanolaser. (a) Laser spectrum and (b) peak wavelength shift for different n env. s/a denotes hole shift s in the H0 nanocavity normalized by lattice constant a. In this measurement, the device was used without the nanoslot and continuous wave (cw) pumping condition.

Similar shifts are observed during the adsorption of biomolecules, such as proteins, dispersed in water. Here the nanolaser is immersed in a solution containing proteins with various concentrations, then rinsed by pure water. The laser wavelength is measured in different water. As shown later, standard proteins including bovine serum albumin (BSA, molecular weight = 68 kDa) and streptavidin (SA, 53 kDa) were used as sensing targets in model experiments.[ Reference Kita, Otsuka, Hachuda, Endo, Imai, Nishijima, Misawa and Baba 11 , Reference Hachuda, Otsuka, Kita, Isono, Narimatsu, Watanabe, Goshima and Baba 12 ] When the protein concentrations in the solution were greater than 1 µM, a large wavelength shift of several nanometers was usually observed because of the index change of the solution. When the concentration is in the range of 10 nM–1 µM, the proteins adsorbed on the surface of the nanolaser through chemisorption and/or physisorption produce a comparable wavelength shift due to the localized index increase near the nanolaser surface within the modal penetration depth. This shift is not saturated in this range, thus this indicates that multilayer protein stacking due to the physisorption continuously shifts the spectrum as long as the protein layer is lying within the penetration depth. As the concentration decreases below 1 nM, one may think that the wavelength shift would disappear because the number of adsorbed molecules is limited. However, a sub-nm shift is observed from very low concentrations, which depends on the affinity constants, K A, between the protein and nanolaser surface. If the surface is functionalized by another molecule, which is specifically combined with the target molecule, the affinity constant is greatly modified and the detectable concentration will be lower, as described in the section ‘Protein sensing’. The mechanism for this is still open for discussion. One candidate mechanism is the optical gradient force in the nanoslot. After considering the pump power, absorption and emission efficiencies, cavity mode profile and Q factor, molecular size, and refractive indices, the optical gradient force for BSA was estimated to be 15–2.5 k B T (k B T is the thermal energy), which is sufficiently higher than the thermal fluctuation. In general, molecular adsorption and desorption reach equilibrium, which is represented by the affinity constant. The optical gradient force could trap the molecules and accelerate the adsorption, resulting in a higher affinity constant. The other mechanism considered is the influence of the electrostatic interaction and electro-optic effect produced around the nanolaser surface, which is suggested to result from the dependence of the laser emission intensity on the surface charge, as discussed below.
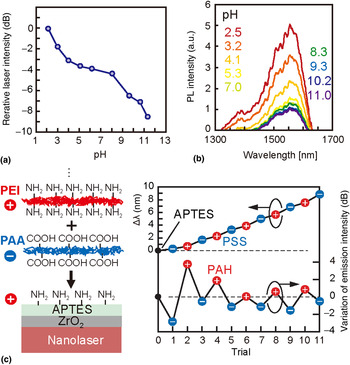
To date, the nanolaser sensor sensitivity has only been related to the wavelength shift caused by the modal index change. However, the nanolaser also detects the surface charge,[ Reference Watanabe, Kishi, Hachuda, Watanabe, Sakemoto, Nishijima and Baba 13 ] which is recognized when the laser emission is measured in different pH solutions. All solid-state material surfaces have their own isoelectric point (pI), defined as the pH value at which the surface is electrically neutralized. Changing the pH of the solution is equivalent to changing the surface charge. When pH is lesser or greater than pI, the surface is positively or negatively charged, respectively. As shown in Fig. 3(a), the laser emission intensity increases and decreases for lower and higher pH, respectively. Such an intensity change is observed not only while lasing but also during PL below the laser threshold. The measured carrier lifetime of PL decreases when the PL intensity is decreased at higher pH. This indicates that the PL intensity change is caused by nonradiative surface recombination modulation, which is physically explained by the Schottky barrier formed in the surface of the semiconductor. The acid dissociation equilibrium is known to equalize the Fermi-level in the semiconductor and redox potential of the solution. Here the GaInAsP semiconductor used in this experiment, grown by metal-organic chemical vapor deposition without intentional doping, exhibits a weak n-type conductivity. If the solution pH is greater than the pI, electrons (majority carriers) tunnel through the thin oxide layer at the surface to the solution and form an upward Schottky barrier in the semiconductor. Under these circumstances, donor ions attract the tunneling electrons and the surface becomes negatively charged. Here holes (minority carriers), which are produced by photopumping, are captured near the surface of the device, and surface recombination is accelerated, which results in a short carrier lifetime and low PL intensity. Thus, this phenomenon enables the detection of pH and/or surface charge. In particular, simultaneous sensing of the environmental index and surface charges is achievable with the nanolaser. This is confirmed when two polyelectrolytes, negatively-charged polystyrene sulfonate (PSS) and positively-charged polyallylamine hydrochloride (PAH), are alternately deposited layer-by-layer on the nanolaser surface, as shown in Fig. 3(b). The wavelength simply redshifts due to the increase of the surface index, whereas the emission intensity repeatedly decreases and increases depending on the surface charge polarity. Thus the environmental index and surface charge are detected independently for these polyelectrolytes. Here, how completely the independence is may be of great interest toward more detailed analysis of adsorbed materials using these two parameters, which will be an attractive issue in future studies.
Surface charge sensing using a photonic crystal nanolaser. (a) Laser emission intensity change with pH of solution, in which the nanolaser is immersed. (b) PL spectrum change with pH. (c) Laser wavelength Δλ change and variation of laser emission intensity for alternate deposition of PAA and PEI polyelectrolytes on a nanolaser surface. In this experiment, a slotted nanolaser and pulsed condition was used.

Protein sensing
Proteins in body fluids, including blood, have been used for medical diagnoses as biomarkers for particular diseases, including cancer. However, biomarker proteins currently used for medical diagnoses have relatively high critical concentrations on the order of nM for the positive effect. Thus, the specificity for target diseases is generally weak. If a much lower concentrated biomarker protein, specific to a disease, is detected from a significantly contaminated fluid, it will greatly improve medical diagnoses. However, the current screening method, enzyme-linked immuno-sorbent assay (ELISA),[ Reference Lequin 14 ] requires labels and a complicated procedure, which result in high cost. In addition, the detection limit of a standard ELISA is not sufficient for the proteins of interest; e.g., sub-pM for prostate specific antigen (PSA, 33 kDa), a well-known biomarker for prostate cancer. Thus, label-free sensing and a sufficiently low detection limit is expected with the nanolaser.
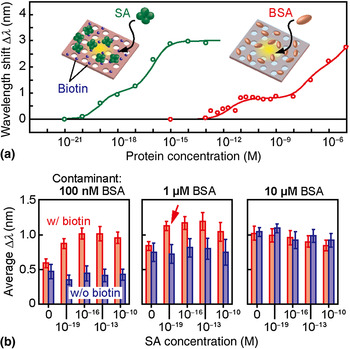
Because the physisorption through the van der Waals force is thought to have a low affinity constant (K A on the order of 105 M−1), some functionalization is necessary on the nanolaser surface, which yields a higher K A for protein adsorption. As model proteins, BSA and SA were detected, as shown in Fig. 4(a).[ Reference Kita, Otsuka, Hachuda, Endo, Imai, Nishijima, Misawa and Baba 11 , Reference Hachuda, Otsuka, Kita, Isono, Narimatsu, Watanabe, Goshima and Baba 12 ] Here the surface was functionalized by N-2-(aminoethyl)-3- aminopropyl-trimethoxysilane (APTES) and glutaraldehyde (GA), which were used as adhesives to nonspecifically adsorb BSA. A wavelength shift was observed from sub-pM, although K A for this functionalization is still as low as 107 M−1. If a standard Langmuir adsorption isotherm is applied, the detection limit concentration C DL for this K A would be on the order of 10 nM. The sub-pM C DL suggests that the K A was effectively enhanced to 1011 M−1, the candidate mechanisms of which were discussed above. The surface was functionalized further by biotin to detect SA; the biotin-SA specific binding has a large K A ~ 1015 M−1. Subsequently, the wavelength shift on the order of 10 zM was observed, which might partly reflect the large increase in K A. Such ultralow C DL was maintained even when the solution contained significant BSA as a contaminant, as shown in Fig. 4(b). The BSA concentration was changed from 100 nM to 10 µM. Even though the surfactant Tween 20 was mixed in the solution to suppress the nonspecific adsorption of BSA, the wavelength shift was observed in all cases due to BSA physisorption, independent of the SA concentration. However, when the BSA concentration was no larger than 1 µM, the wavelength shift differs with and without biotin, implying that SA is selectively detected. The largest selectivity was 1013 when detecting 100 zM SA compared with 1 µM BSA. Of course, this high selectivity is attributed to the large K A between biotin-SA, but still it is a promising result towards detecting a practical biomarker protein from human blood.
Standard protein sensing. (a) Sensing of nonspecific BSA adsorption and specific binding of biotin-SA. (b) Sensing of SA in samples with BSA as a contaminant. Error bars show 95% confidence interval. Arrow indicates the result showing the largest selectivity.

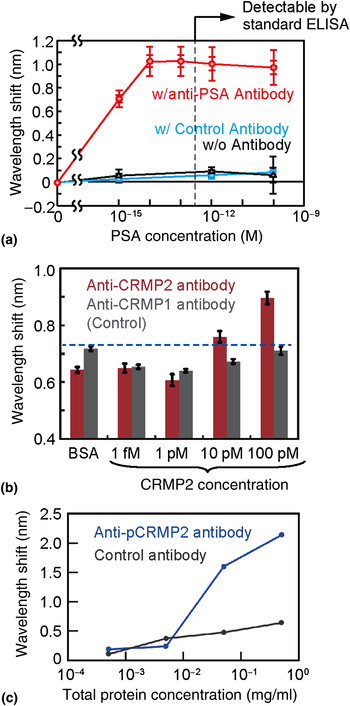
Figure 5(a) shows the similar sensing characteristics for PSA.[ Reference Hachuda, Watanabe, Takahashi and Baba 15 ] The critical concentration for the positive status of prostate cancer is ~100 pM, but a much lower concentration must be detected to monitor the recurrence of the cancer after surgery. In a test experiment, the nanolaser surface functionalized with APTES/GA was further immobilized by an anti-PSA antibody or control antibody (mouse antibody). In this case, ethanolamine, a surfactant, was injected into the solution to optimize the hydrophilicity of the device and accelerate the penetration of the solution into the holes of the photonic crystal slab. The antibody-antigen reaction for the anti-PSA antibody enables PSA detection from a concentration of 1 fM in the nanolaser; the C DL is on the order of sub-fM, which lies in-between the C DL of BSA and SA. The results are consistent when considering K A = 108–109 M−1 between the PSA and anti-PSA antibody. This C DL was maintained even when 10 µM BSA was mixed in the solution as a contaminant (selectivity: 1010). Human blood contains ~1 mM serum albumin. If we consider BSA to be similar to serum albumin, this is equivalent to detecting 100 fM of PSA in human blood, which is diluted to 100× lower concentration to suppress the noise signal from the contaminants.
Biomarker protein sensing. (a) PSA sensing. Inner and outer error bars show standard error and standard deviation, respectively. (b) CRMP2 sensing. Error bars show the standard error. (c) pCRMP2 sensing from human blood.

Figures 5(b) and 5(c) are different examples, showing the ability to detect the antibody-antigen reaction of collapsin response mediator protein 2 (CRMP2, 60–66 kDa),[ Reference Isono, Hachuda, Watanabe, Yamashita, Goshima and Baba 16 , Reference Isono, Hachuda, Watanabe, Yamashita, Goshima and Baba 17 ] which is an intracellular protein that mediates a repulsive axon guidance molecule, Semaphorin3A. The phosphorylation of CRMP2 has attracted attention as a promising Alzheimer's disease (AD) biomarker in human blood. AD is a progressive neurodegenerative disorder characterized by amyloid-β protein and tau deposition in the brain. CRMP2 is also accumulated in neurofibrillary tangles in AD brains. The relationship between amyloid-β neurotoxicity and the phosphorylation of CRMP2 has been studied using CRMP2 phosphorylation-deficient knock-in mice.[ Reference Isono, Yamashita, Obara, Araki, Nakamura, Kamiya, Alkam, Nitta, Nabeshima, Mikoshiba, Ohshima and Goshima 18 ] Although in the mouse model increased phosphorylation occurs prior to the onset of pathology, the phosphorylation of CRMP2 can be a marker signal of AD. To detect low-concentration CRMP2 specifically, the nanolaser sensor must be first immobilized by the anti-CRMP2 antibody. Subsequently, BSA was adsorbed to prevent nonspecific adsorption. A CRMP2-overexpressed cell lysate was prepared through transfection to HEK293T cells. The lysate was diluted by a mixture of disrupted cell suspension and 1/3 phosphate buffered saline (PBS). The wavelength shift of the nanolaser was observed after immersion in the solution. For a control, the same process was conducted for another nanolaser immobilized by anti-CRMP1 antibody. In both devices and at all concentrations, a wavelength shift was observed, which is due to contaminant adsorption in the sample solution. However, larger shifts appeared for the anti-CRMP2 antibody at 10 pM and higher concentrations. This indicates that the specific binding with CRMP2 was successfully detected. This detection limit for CRMP2 is two orders of magnitude lower than that obtained by standard ELISA. The detection of CRMP2 and its phosphorylation was also attempted for samples taken from T lymphocytes in human blood, because the change of these proteins in the brain has also been reported to be monitored from a sample of peripheral blood. During sample preparation, lymphocytes were isolated from human blood using a centrifugal separator and by mixing a gel which separates mononuclear cells, including erythrocyte and lymphocytes. After removing plasma proteins, they were dissolved and diluted by 1/3-PBS. The protein concentration in the sample was measured by spectrophotometry. Three nanolaser chips were prepared, each of which were immobilized by either anti-CRMP2 antibody, anti-phosphorylated-CRMP2 antibody, or anti-green fluorescent protein (GFP) antibody as a control. The sample clearly exhibited a larger wavelength shift with the devices containing the two former antibodies, which also indicates that these samples were selectively detected.
Deoxyribonucleic acid (DNA) sensing
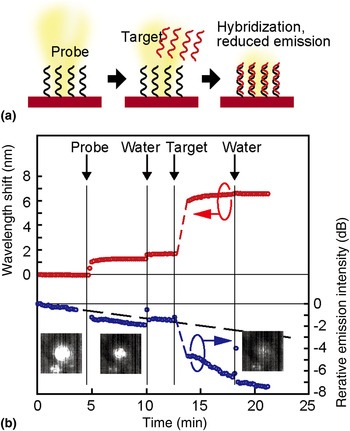
The screening of DNA is conventionally conducted by the hybridization of target DNA with complementary probe DNA immobilized on a substrate. This event is detected by fluorescence labels modified with the target DNA, which complicates the overall procedure. The nanolaser sensor can detect this event without labels, not only from the wavelength shift but also from the emission intensity change, because DNA and its hybridization is negatively charged in water. In particular, detection through emission intensity eliminates the need for spectral analysis, which is necessary for other methods that exploit optical cavities and plasmon resonance. Therefore, our technique greatly simplifies the procedure. Figure 6 shows the simultaneous sensing of DNA immobilization and hybridization through these two methods.[ Reference Watanabe, Kishi, Hachuda, Watanabe, Sakemoto, Nishijima and Baba 13 ] Here two polyelectrolytes, polyacrylic acid (PAA) and polyethylenimine (PEI), were deposited after the APTES treatment. The nanolaser chip was placed in a polydimethylsiloxane (PDMS) fluidic channel and a solution containing single-strand 12 mer random sequence probe DNA and that including its complementary DNA were successively injected and rinsed with pure water. The wavelength redshifted simply due to the index change caused by the adsorption of these DNAs. Corresponding to this behavior, the emission intensity exhibits a large decrease when the DNA was injected. The target DNA is considered to be hybridized with the probe DNA, and a portion of the DNA might be chemically adsorbed on the positively-charged PEI surface, which was not covered completely with the probe DNA. Again, this result proves that the presence of surface charge changes the emission intensity. In general, such charge sensing in biomolecules will be effective for discriminating between charged and neutral particles and may also be applicable to bioimaging.
DNA sensing through both wavelength shift and emission intensity change. (a) Procedure. (b) Temporal wavelength and emission intensity changes when DNA and water were successively injected into the PDMS fluidic channel in which the nanolaser was placed.

Biotoxin sensing
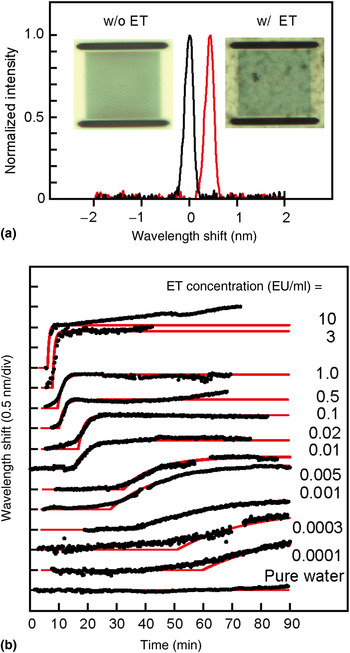
Endotoxin (ET) is a lipopolysaccharide toxin existing on the surface of gram-negative bacteria and is widely distributed throughout the environment, e.g., even in tap water.[ Reference Beutler and Rietschel 19 ] However, when a small amount of ET is mixed with blood in the body, it causes a high fever and septic shock. Critical ET concentrations for injection liquids and dialyses are 0.01 and 0.001 EU/ml, respectively. The contamination of medical equipment and pharmaceutical products by ET is a serious concern; therefore, the detection and elimination of active ET are essential in clinical treatments. The current standard for detecting ET is the limulus amebocyte lysate (LAL) assay, where the LAL reagent reacts with ET and produces a gel. However, over an hour is needed to observe the gel formation for the aforementioned low critical concentrations, which is too long for emergency medical care. The photonic crystal nanolaser is also applicable for high-speed gel formation monitoring, as shown in Fig. 7.[ Reference Takahashi, Hachuda, Watanabe, Nishijima and Baba 20 ] The onset time and slope of the wavelength shift due to solution gelation reflects the concentration of ET. Even for a very low concentration of 0.0001 EU/ml, which is lower than what is guaranteed by the commercial LAL Wako Pure Chemical Industries Ltd., Limulus ES-II Single Test (0.015 EU/ml), a clear shift was observed. Assuming a critical wavelength shift, we can obtain a working curve showing the relation between the detection time and ET concentration. The correlation of the working curve with the experimental plots is larger than 97% when the wavelength shift exceeds 0.1 nm. Based on this working curve, the detection time for a required concentration of 0.001 EU/ml was estimated to be 33 min, which is nearly half of the current monitoring method using optical absorbance.
Sensing of ET mixed in pure water. (a) Spectral shift and microscope image with and without ET. (b) Temporal change of wavelength shift measured for various concentrations of ET (black dots) and fitting curves (red lines).

Cell imaging
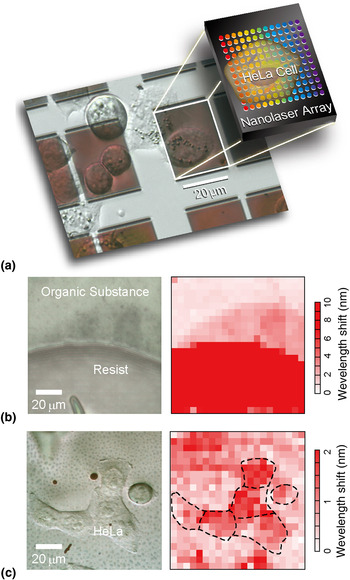
As aforementioned, it is straightforward to integrate multiple nanolasers in one photonic crystal slab and operate them with a high yield. Therefore, when a cell is directly cultured on the photonic crystal slab, the behaviors of the cells can be imaged by mapping the wavelength shifts of all nanolasers.[ Reference Abe, Narimatsu, Watanabe, Furumoto, Yokouchi, Nishijima, Kita, Tomitaka, Ota, Takemura and Baba 21 ] To avoid the modal coupling between neighboring nanolasers, the spacing between nanolasers must be wider than 2 µm, which defines the image's spatial resolution. When the nanolaser pitch is set to 5 µm, integrated 20 × 20 nanolasers can cover a 100 µm2 area. To obtain such a wide photonic crystal slab with sufficient mechanical strength, the slab is bonded on a glass substrate with PDMS resin. To avoid the penetration of PDMS into the holes of the photonic crystal slab, the holes are buried by silica, deposited from the hydrolysis of tetraethyl orthosilicate in advance, and removed after the bonding. Examples of acquired images obtained with 441 nanolaser pixels without the nanoslot are shown in Fig. 8. In the resist image, not only is the resist well displayed but also a thin organic substance adjacent to the edge of the resist is well demonstrated. In the image of HeLa cells, which are each 10–20 µm in size, the acquired image partly agrees and disagrees with the optical microscope image. This suggests that the image reflects the attachment condition determined by the footing of the cells. The behaviors of the cells against the injection of a reagent were also observed in the continuous measurement. In these images, the index resolution over the image is limited to the order of 10−2 RIU due to the thermally chirped wide spectrum and nonuniform sensitivity of the nanolaser array without nanoslot. By introducing the nanoslot for narrowing the spectrum and calibrating the nonuniform sensitivity, the resolution is improved to ~2 × 10⁻³ RIU.
Using the nanolaser array as an imager. (a) Microscope image of the nanolaser array on which HeLa cells were cultured. (b) Image of the resist and organic substance on a nanolaser array. (c) Observation of HeLa cells.

Comparison
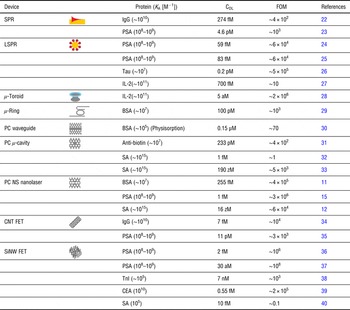
Finally, the nanolaser sensor performance is compared with those of other micro/nanosensors, based on photonics and electronics.[ Reference Lau, Young, Baev, Hu and Prasad 22 − Reference Lin, Hsieh, Lin, Fang, Yang, Tsai, Chiang, Pan and Chen 38 ] As a performance parameter, a high bulk index sensitivity is often claimed with a resolution of e.g., <10−6 RIU. However, in biosensing, it is difficult to maintain such a stable sensing condition. The sensors are easily affected by noise and signal drift due to thermal, chemical and electrostatic effects, surface condition of the functionalization, and adsorption and desorption of contaminants. In addition, the high sensitivity is not always feasible and stable. Therefore, here we focus not only on the bulk index sensitivity but also on the nanolaser's ability to sense proteins. During protein sensing, the performance is dominated by the target protein's affinity constant K A. When the adsorption of the protein on the nanolaser is dominated by the Langmuir isotherm, the wavelength shift, Δλ, as the sensing signal is given by
 $$\Delta \lambda = \displaystyle{{\Delta {\lambda _{{\rm max}}}{K_{\rm A}}C} \over {{\rm 1} + {K_{\rm A}}C}},$$
where Δλmax is the maximum signal and C is the protein concentration. The C DL is defined when Δλ detectable takes minimum. From Eq. (1), we obtain
 $${K_{\rm A}}{C_{{\rm DL}}}^{ - {\rm 1}} = \displaystyle{{\Delta {\lambda _{{\rm max}}}} \over {\Delta {\lambda _{{\rm min}}}}} - {\rm 1}.$$
Because the right side of this equation shows the number of resolution points, we can define (K A C DL)−1 as the biosensor figure of merit (FOM) parameter. Table I summarizes K A and C DL, which have been reported in the literature for label-free protein sensors, and the corresponding FOM. K A varies widely from 105 to 1015 M−1 between target proteins. A high K A is expected to give a low C DL, but the FOM varies because each sensor may have a detection limit independent of the proteins' affinities. Overall, high FOMs (>104) are obtained for localized surface plasmon resonance (LSPR), ultrahigh Q micro-toroidal cavity, photonic crystal nanolaser, and field effect transistor functionalized by Si nanowires (SiNW FET). Although they are promising as high-performance biomarker sensors, we must also take into account the following considerations for practical use in medical diagnoses: sufficient selectivity for target protein against contaminants; low invasiveness and protein denaturalization; sufficient stability, repeatability, and reliability; easy manufacturing and low cost, suitable for disposability; and simple procedure and easy handling. The selectivity is strongly dependent on surface functionalization. However, the nanolaser can already achieve enhanced selectivity of 1013 for streptavidin and 1010 for PSA against BSA as a contaminant and the selective detection of CRMP2, which is promising as a biomarker of AD, from human blood. The pulsed operation of the nanolaser suppresses heating, and the statistical analysis using the nanolaser array improves the reliability. The fabrication process of the nanolaser is very simple and ensures low cost manufacturing in the future. The photopumping of the nanolaser chip by the μ-PL setup enables remote operation and disposable use. Thus, the nanolaser sensor is an excellent candidate that satisfies all of these requirements.
Comparison of protein sensing performance between various label-free nano and microbiosensors.

Acknowledgments
The author would like to thank Dr. S. Kita, Dr. T. Isono, Mr. H. Abe, Mr. S. Hachuda, Mr. M. Narimatsu, Mr. S. Otsuka, Mr. K. Watanabe, Mr. T. Furumoto, Mr. T. Watanabe, Mr. Y. Kishi, Mr. D. Takahashi, Mr. Y. Furuta, Ms. M. Sakemoto, and Dr. Y. Nishijima (Yokohama National University); Dr. H. Misawa, Hokkaido University, Dr. T. Endo and Mr. Y. Imai (Tokyo Institute of Technology); and Dr. Y. Goshima (Yokohama City University) for their contributions to the development of nanolaser biosensors. This work was partly supported by the Grant-In-Aid #24226003 from MEXT.