



1. Introduction
Microscale and rarefied gas flows inside channels underpin a wide range of advanced technologies – from pressure-driven MEMS devices and vacuum pumps, to bleed systems in satellite thrusters (Yamamoto, Mori & Ji Reference Zhang, Xu, Zhang and Chen2009; Tang et al. Reference Torrilhon and Struchtrup2013; Sun et al. Reference Sun, Fan and Boyd2025). When a rarefied gas flows through a channel with width of the order of tens of mean free paths, the classical compressible Navier–Stokes–Fourier (NSF) equations – derived under the assumption of local thermodynamic equilibrium – fail to provide accurate predictions (Eu Reference Eu1992; Colin Reference Colin2006; Shan, Yuan & Chen Reference Sharipov and Seleznev2006; Gu & Emerson Reference Gu and Emerson2009). Phenomena such as velocity slip, temperature jump, and most notably, the Knudsen paradox (the non-monotonic variation of mass flow rate with Knudsen number
 $\textit{Kn}$
) (Akhlaghi, Roohi & Stefanov Reference Akhlaghi, Roohi and Stefanov2023) and its disappearance under molecular confinement (Corral-Casas et al. Reference Corral-Casas, Li, Borg and Gibelli2022) highlight the breakdown of first-order continuum theory in the transitional and rarefied regimes (
 ${\textit{Kn}}\gtrsim 0.1$
) (Ewart et al. Reference Ewart, Perrier, Graur and Méolans2007).
Another striking example of NSF’s limitations is its prediction of a flat pressure profile across the channel cross-section, even under steady forcing in force-driven compressible micro Poiseuille flow (Rana et al. Reference Rath, Yadav and Agrawal2016; Jadhav, Singh & Agrawal Reference Jadhav, Singh and Agrawal2017). The NSF solution stands in contrast to deterministic molecular dynamics (MD) and probabilistic direct simulation Monte Carlo (DSMC) data. In particular, Myong (Reference Myong2011) derived an analytical solution for the cross-stream pressure field based on the nonlinear coupled constitutive relation (NCCR) model, a second-order framework obtained from the Boltzmann kinetic equation using Eu’s modified moment method (Eu Reference Eu1992), and compared the analytical solution with DSMC and MD data, as shown in figure 1. Under force-driven compressible Poiseuille flow of a monatomic gas, the NCCR theory yields a closed-form solution
 \begin{equation} p^{*}\left(y^{*}\right)=1+\tan ^{2}S^{*},{\quad}S^{*}=\sqrt{\frac{2}{3}}\,\varepsilon _{h}\,s^{*}, \end{equation}
where p
* is the normalised pressure,
 $\varepsilon _{h}$
is the non-dimensional force parameter, and s
* is a temperature-weighted quantity of the spatial coordinate y
*. The solution remains valid for arbitrary
 $\textit{Kn}$
and forcing strength, being derived from the second-order constitutive relations that capture essential non-equilibrium effects. Associated expressions for viscous stress, velocity and temperature fields are also available in closed form (Myong Reference Myong2011).
Figure 1 shows that both DSMC and MD exhibit a convex pressure profile with maxima near the walls, which is precisely captured by the NCCR solution but absent in NSF. This non-uniform pressure induces near-wall density peaks via the equation of state, which NSF also fails to capture. Theoretically, the convexity arises from the coupling between the kinematic viscous stress constraint
 \begin{equation} {\varPi}_{xy}^{2}=-\frac{3}{2}\left(p+{\varPi} _{yy}\right){\varPi} _{yy}, \end{equation}
and the momentum balance
 \begin{align} \begin{aligned} &\frac{{\rm d}{\varPi} _{xy}}{{\rm d}y}=\rho a, \\ &p+{\varPi} _{yy}=p(0), \end{aligned} \end{align}
where Π
xy
and Π
yy
are, respectively, the shear and streamwise normal components of the traceless viscous stress tensor
 $\boldsymbol{\varPi}$
. Equations (1.2) and (1.3) enforce a non-zero bulk normal stress (Π
yy
≠ 0) in response to the applied body force a, which, through the closure relation, directly drives a spatially varying pressure field in the absence of a wall-normal pressure gradient. This effect is characteristic of non-equilibrium flows in the slip and transition regimes, and explains the long-standing discrepancy between kinetic-level simulation and classical continuum descriptions as confirmed by experimental measurements of pressure and temperature gradient-driven flows (Brancher et al. Reference Brancher, Johansson, Perrier and Graur2021). It is worth noting that the kinematic stress constraint (1.2) has recently been independently validated against DSMC data for the one-dimensional velocity-shear Couette flow over a wide parameter range, up to Mach number 20 and Knudsen number 50 (Garg, Mankodi & Myong Reference Garg, Mankodi and Myong2026).
Comparison of normalised pressure profiles
 $p(y^{*})/p(0)$
predicted by MD, DSMC, NSF and NCCR models for force-driven compressible Poiseuille gas flow at
 $\varepsilon _{h} = 0.6$
and
 $\textit{Kn} = 0.1 $
. Reproduced from Rana et al. (Reference Rath, Yadav and Agrawal2016) with permission.

Figure 1. Long description
A scatter plot comparing normalized pressure profiles predicted by MD, DSMC, NSF, and NCCR models for force-driven compressible Poiseuille gas flow. The x-axis represents the normalized position y-star, ranging from approximately negative 0.4 to 0.4. The y-axis represents the normalized pressure p(y-star) over p(0), ranging from approximately 0.99 to 1.06. The plot includes data points for MD (black filled circles), DSMC (black open circles), a solid line for NCCR, and a dashed line for NSF. Two clusters of data points are highlighted with ellipses around y-star values of approximately negative 0.4 and 0.4. The data points show a non-monotonic variation, indicating the Knudsen paradox and the breakdown of first-order continuum theory in the transitional and rarefied regimes. All values are approximated.
Over the past three decades, microscale and rarefied gas flows inside channels have served as a fertile testing ground for kinetic theory, higher-order hydrodynamic models, and particle-based simulations. The DSMC method remains the primary standard for rarefied gas flows due to its robustness and modular treatment of collision mechanisms, despite its high computational cost relative to continuum methods. Enhancements in boundary algorithms, e.g. Ikegawa & Kobayashi (Reference Ikegawa and Kobayashi1990) and Wang & Li (Reference Xu2004), adaptive sub-cell meshing (Stefanov, Roohi & Shoja-Sani Reference Sun, Li, He, Wang, Zhang, Wang and Tang2022) and variance reduction techniques have rendered long-channel DSMC simulations routine, even for channels with large aspect ratios (Sun, Fan & Boyd Reference Taheri and Struchtrup2009).
Interestingly, recent DSMC studies have revealed non-Fourier heat transport (Mohammadzadeh et al. Reference Mohammadzadeh, Roohi, Niazmand, Stefanov and Myong2012; Ebrahimi, Shahabi & Roohi Reference Ebrahimi, Shahabi and Roohi2021), entropy-producing effects of velocity slip (Esfahani, Ejtehadi & Roohi Reference Esfahani, Ejtehadi and Roohi2013; Venugopal, Praturi & Girimaji Reference Vincenti and Kruger2019), and scale-dependent non-isochoric effects in Poiseuille flow (Ravichandir & Alam Reference Rojas-Cárdenas, Graur, Perrier and Méolans2024). Hybrid approaches, such as DSMC–LBM (Di Staso et al. Reference Di Staso, Srivastava, Arlemark, Clercx and Toschi2018) and GSIS–DSMC (Luo et al. Reference Luo, Li, Fei and Wu2025), now extend molecular fidelity across the slip to free-molecular regimes.
Despite advances in computational simulation, ranging from DSMC to high-order numerical methods – e.g. Ravichandir & Alam (Reference Rojas-Cárdenas, Graur, Perrier and Méolans2024), Elguennouni et al. (Reference Elguennouni, Hssikou, Baliti and Alaoui2020), Torrilhon & Struchtrup (Reference Venugopal, Praturi and Girimaji2008), Zhang et al. (Reference Zhang, Xu, Zhang and Chen2018) – exact analytical solutions to the Boltzmann kinetic equation or its closures remain rare. Among the few tractable models, a subset of NSF-based slip-flow theories stands out for balancing analytical tractability with improved rarefaction accuracy. Arkilic, Schmidt & Breuer (Reference Arkilic, Schmidt and Breuer1997) used a first-order Maxwell slip boundary condition and perturbation expansion to derive closed-form velocity fields and a nonlinear streamwise pressure profile for gases in microchannels. Their model predicted mass-flow rates accurate to
 $10^{-12}$
kg s–1, in agreement with experiments at
 ${\textit{Kn}}\approx 0.06$
–0.16. Dongari, Sharma & Durst (Reference Dongari, Sharma and Durst2009) incorporated a second-order slip condition to yield expressions for velocity, streamwise pressure, mass flux, friction factor and conductance valid up to
 ${\textit{Kn}}\approx 5$
. Their model captures the Knudsen paradox and pressure curvature reversal, matching results of the Boltzmann kinetic equation in the transition regime and experimental data on slip laws (Maurer et al. Reference Maurer, Tabeling, Joseph and Willaime2003).
Additional analytical developments include the super-Burnett solution for force-driven Poiseuille flow (Xu Reference Yadav, Jonnalagadda and Agrawal2003) and Burnett-class solutions for long channels (Rath, Yadav & Agrawal Reference Ravichandir and Alam2021). Extensions such as augmented Burnett, O-Burnett and super-O-Burnett models (Singh, Dongari & Agrawal Reference Singh, Jadhav and Agrawal2014; Jadhav et al. Reference Jadhav, Singh and Agrawal2017; Singh, Jadhav & Agrawal Reference Stefanov, Roohi and Shoja-Sani2017; Rath et al. Reference Ravichandir and Alam2021; Yadav, Jonnalagadda & Agrawal Reference Yamamoto, Mori and Kawaguchi2024) continue to improve predictive range. The regularised 13-moment (R13) equations demonstrate quantitative accuracy for Knudsen numbers up to approximately 1.0. For planar Poiseuille flow, Taheri, Torrilhon & Struchtrup (Reference Tang, Zhai, Tao, Gu and Emerson2009) obtained analytical R13 solutions capturing essential rarefaction phenomena – Knudsen boundary layers, tangential heat flux, temperature dips, non-zero normal stresses and convex pressure distributions – in good agreement with kinetic theory across the transition regime (
 $\textit{Kn} \lt 1$
). For annular (cylindrical) Poiseuille flow, Taheri & Struchtrup (Reference Taheri, Torrilhon and Struchtrup2012) derived analytical R13 solutions demonstrating the same rarefaction features while capturing the Knudsen paradox with agreement to Bhatnagar–Gross–Krook and linearised Boltzmann predictions. Martínez (Reference Martínez2011) provided analytical baselines for the Grad 13 and R13 moment hierarchies in rarefied cylindrical Hagen–Poiseuille flow. However, due to the high degree of variable coupling within the regularised equations, analytical tractability for the R13 model was limited to velocity and flow rate, leaving higher-order profiles to be verified as order-
 $\textit{Kn}$
corrections.
While the R13 and Grad moment approaches yield closed-form analytical solutions, other studies employ similar extended hydrodynamic methodologies but rely on numerical solution techniques. Higher-order formulations such as the Onsager–Burnett equations (Singh et al. Reference Stefanov, Roohi and Shoja-Sani2017) provide stable second-order constitutive relations capturing non-constant pressure profiles and tangential heat flux, though their solutions require numerical computation. Likewise, linearised Boltzmann equation approaches – including systematic numerical solutions (Ohwada, Sone & Aoki Reference Qiao and Shang1989) – offer rigorous kinetic baselines across the full Knudsen spectrum, as compiled in comprehensive reference reviews (Sharipov & Seleznev Reference Singh, Dongari and Agrawal1998). These complementary approaches validate the R13 predictions while extending coverage to regimes or geometries requiring numerical discretisation. While these and similar higher-order approaches often prioritise numerical precision over closed-form expressions, they offer less immediate physical intuition compared to simpler models.
Despite the interpretability of the NCCR model in prior studies (Myong Reference Myong2011, Reference Myong2014a
), a fully analytical solution for pressure-driven Poiseuille flow – capturing cross-stream variations under arbitrary longitudinal gradients – is currently lacking. While the theory is well-validated for force-driven configurations via DSMC and MD data, the pressure-driven case introduces a non-trivial two-dimensional coupling between the evolving centreline pressure and cross-stream viscous stress gradients. Scaled by the ratio
 $\varepsilon$
of the channel length (L) to its height (H), this coupling generates a unique tangent-form solution family that is absent in the mathematically simpler one-dimensional structure of volume-force-driven flows, yet essential for the accurate modelling of microscale and rarefied devices.
The objectives of this work are to advance both analytical theory and microscopic validation for pressure-driven microscale and rarefied Poiseuille gas flow. Building on the NCCR model derived from the Boltzmann kinetic equation via balanced closure, cumulant expansion, and the second law of thermodynamics (Myong Reference Myong2014b ), we present – for the first time – a closed-form analytical solution for the cross-stream pressure distribution under pressure-driven compressible Poiseuille gas flow. The solution takes the compact form
 \begin{equation} p^{*}\left(x^{*},y^{*}\right)={p}_{m}^{*}\left(x^{*}\right)\left\{1+\tan ^{2}\left[\sqrt{\frac{2}{3}}\frac{1}{\varepsilon }\left(-\ln {p}_{m}^{*}\right){'}y^{*}\right]\right\}\!, \end{equation}
where
 ${p}_{m}^{*}(x^{*})$
is the mid-plane streamwise pressure profile, and
 $\varepsilon$
is the aspect ratio (L/H).
To validate this analytical solution, high-resolution DSMC simulations are carried out with proper subsonic boundary conditions in the ranges
 $ 0.0053 \leqslant \textit{Kn} \leqslant 13.23 $
and
 $ 0.027 \leqslant M \leqslant 0.868 $
, where
 $\textit{Kn}$
and Mach number M are defined at the channel outlet. In addition to standard hydrodynamic fields, we compute spatially resolved maps of Boltzmann entropy density and entropy-generation rate to diagnose non-equilibrium effects in depth, including the non-classical phenomenon associated with the direction of heat transfer, and to verify thermodynamic consistency at the molecular level. By combining closed-form analytical solutions with particle-resolution simulations, this work bridges continuum and kinetic perspectives, establishes new benchmarks for transport phenomena in microscale and rarefied gas flows inside channels, and provides direct insight into second-law behaviour and the breakdown of classical heat transfer in pressure-driven microscale and rarefied gas flows.
This paper is organised as follows. In § 2, we derive the closed-form analytical solution for the cross-stream pressure and viscous stress profile in pressure-driven microscale and rarefied Poiseuille gas flow, based on the second-order NCCR framework. Section 3 details the DSMC methodology, computational set-up and simulation protocol used for molecular-level validation. Section 4 presents our main results, including (i) new behaviour associated with cross-stream pressure distribution, (ii) the entropy density and entropy-generation rate, (iii) second-order effects and their implications for pressure and heat transfer, and (iv) comprehensive analyses of thermophysical behaviours, rarefaction, pressure and aspect ratio dependencies. Section 5 summarises the main findings and discusses their broader relevance to microscale and rarefied gas dynamics.
2. New analytical solution of the pressure distribution based on the second-order NCCR model
In this section, an analytical solution of pressure distribution based on the second-order NCCR model will be derived. The NCCR model of gases in a thermal non-equilibrium has been derived from the viewpoint of the moment method applied to the Boltzmann kinetic equation and the so-called closing-last balanced closure (Myong Reference Myong2014b ). An important result obtained from the new closure was that the number of places for closing the moment equations is two – kinematic and collision terms – thus the order of approximations in handling two terms must be the same, e.g. second-order for both kinematic and collision terms. This balanced closure effectively resolved the weakness of Eu’s closure, where the third-order moment in the constitutive equation of heat flux is assumed to be zero (Eu Reference Eu1992). Eu’s closure has been criticised for contradicting the fact that the third-order moment cannot be zero in general, especially in strong thermal non-equilibrium.
It should also be noted that in the past, Eu’s canonical distribution function in the exponential form might have some difficulty when it is truncated to a finite number of terms. A numerical difficulty may arise when calculating the normalisation factor associated with the canonical distribution function because the heat flux contribution containing the third-order term for the integrand may give rise to a divergence, causing a serious computational problem. Eu showed, however, that this difficulty can be avoided if the set is truncated in such a way as to produce a truncated distribution function in the fourth order for the integrand while ensuring convergence of the integral (Al-Ghoul & Eu Reference Al-Ghoul and Eu2001).
For a monatomic gas, the exact moment equation for the viscous shear stress tensor Π is obtained by first differentiating the statistical definition of the variables with time, then combining them with the Boltzmann transport equation. This procedure yields a balance of the form
 \begin{equation} \rho \frac{{\rm d}(\boldsymbol{\varPi }/\rho )}{{\rm d}t}+\boldsymbol{\nabla }\boldsymbol{\cdot }\boldsymbol{\psi }^{\left(\boldsymbol{\varPi }\right)}+2\left[\boldsymbol{\varPi }\boldsymbol{\cdot }\boldsymbol{\nabla }\boldsymbol{u}\right]^{\left(2\right)}+2p\left[\boldsymbol{\nabla }\boldsymbol{u}\right]^{\left(2\right)}=\boldsymbol{\varLambda }^{\left(\boldsymbol{\varPi }\right)}. \end{equation}
In the above constitutive equations, p and
u
denote the pressure and the velocity vector, respectively,
 $\boldsymbol{\psi }^{(\boldsymbol{\varPi })}$
represent the open high-order terms of the viscous shear stress, and
 $\boldsymbol{\varLambda }^{(\boldsymbol{\varPi })}$
on the right-hand side represents the dissipation in the non-conserved quantities, which is attributed to the collisional operator in the kinetic equation. The notation
 $[\cdot]^{(2)}$
stands for a traceless symmetric part of the tensor. Details, including the derivation of the constitutive relations for the heat flux and excess stress, as well as the general NCCR theory, can be found in Myong (Reference Myong1999, Reference Myong2014b
, Reference Myong2026), Chourushi et al. (Reference Chourushi, Rahimi, Singh, Ejtehadi, Mankodi and Myong2022), Ejtehadi et al. (Reference Ejtehadi, Mankodi, Sohn, Kim and Myong2023) and Mankodi et al. (Reference Mankodi, Ejtehadi, Chourushi, Rahimi and Myong2023).
As a result of the balanced closure, an NCCR expressed in a mathematically implicit ‘sinh’ form, which is an exact consequence of the Boltzmann kinetic equation of a monatomic gas within second-order accuracy, was derived. In the case of steady-state flow, the second-order NCCR model of the viscous stress Π is reduced to
 \begin{equation} 2\left[\boldsymbol{\varPi }\boldsymbol{\cdot }\boldsymbol{\nabla }\boldsymbol{u}\right]^{\left(2\right)}+2p\left[\boldsymbol{\nabla }\boldsymbol{u}\right]^{\left(2\right)}=-\frac{p}{\eta }\boldsymbol{\varPi }q_{2nd}\left(\kappa \right). \end{equation}
In this expression, η is the linear Navier viscosity. The second-order scalar dissipation term is derived from the cumulant expansion of the collision integral and is expressed in a mathematically implicit hyperbolic sine form as
 $q_{2nd}(\kappa )=\sinh \kappa /\kappa$
, where the term κ represents the first-order reduced collision integral. Physically, it is equal to a modified Rayleigh–Onsager dissipation function, which provides a direct measure of the flow’s departure from thermal equilibrium. For a monatomic gas, it is defined as
 \begin{equation} \kappa =\frac{(mk_{B})^{1/4}}{\sqrt{2}d}\frac{T^{1/4}}{p}\left[\frac{\boldsymbol{\varPi }\colon \boldsymbol{\varPi }}{2\eta }+\frac{\boldsymbol{Q}\boldsymbol{\cdot }\boldsymbol{Q}/T}{k}\right]^{1/2}. \end{equation}
In the above relation, m, d, k, k B and Q are the molecular mass, diameter, thermal conductivity, the Boltzmann constant, and the heat flux vector, respectively.
In conjunction with the following conservation laws of momentum (for purely pressure-driven flow with no volume forces, two-dimensional steady planar geometry, centreline symmetry, with the inertia term being neglected due to the near one-dimensional nature of Poiseuille flow),
 \begin{equation} \boldsymbol{\nabla }\boldsymbol{\cdot }(p\boldsymbol{I}+\boldsymbol{\varPi })=\boldsymbol{0}, \end{equation}
the second-order NCCR model (2.2) will determine the pressure (and viscous stress) distribution in channels. The analytical solutions of the pressure-driven compressible gaseous (monatomic) Poiseuille flow through channels can be obtained by solving the following equations (three ordinary differential equations and six algebraic equations) simultaneously:
 \begin{align} &\dfrac{{\rm d}}{{\rm d}y}\left[\begin{array}{llll} {\varPi} _{xy}\\[9pt] p+{\varPi} _{yy}\\[9pt] {\varPi} _{yz} \end{array}\right]=\left[\begin{array}{llll} -{\rm d}p/{\rm d}x\\[9pt] 0\\[9pt] 0 \end{array}\right]\!, \nonumber\\[9pt] &-\dfrac{1}{\eta }\left[\begin{array}{lllllll} (4/3)\left[{\varPi} _{xy}\right]_{0}\left[{\varPi} _{{xy_{0}}}\right]_{0}\\[11pt] -(2/3)\left[{\varPi} _{xy}\right]_{0}\left[{\varPi} _{{xy_{0}}}\right]_{0}\\[11pt] -(2/3)\left[{\varPi} _{xy}\right]_{0}\left[{\varPi} _{{xy_{0}}}\right]_{0}\\[11pt] \left(p+\left[{\varPi} _{yy}\right]_{0}\right)\left[{\varPi} _{{xy_{0}}}\right]\\[11pt] \left[{\varPi} _{yz}\right]_{0}\left[{\varPi} _{{xy_{0}}}\right]_{0}\\[11pt] 0 \end{array}\right]=-\dfrac{p}{\eta }\left[\begin{array}{l} \left[{\varPi} _{xx}\right]_{0}\\[11pt] \left[{\varPi} _{yy}\right]_{0}\\[11pt] \left[{\varPi} _{zz}\right]_{0}\\[11pt] \left[{\varPi} _{xy}\right]_{0}\\[11pt] \left[{\varPi} _{xz}\right]_{0}\\[11pt] \left[{\varPi} _{yz}\right]_{0} \end{array}\right]q_{2nd}\left(\kappa \right)\!. \end{align}
The constitutive relations are expressed in terms of non-conserved variables measured from their value at the centre of the channel, denoted by an abbreviation
 $[A]_{0}\equiv A-A(0)$
. This system can be solved analytically in the following steps. From the constitutive relations, we can derive
 \begin{equation} \textstyle{\left[{\varPi} _{yz}\right]_{0}=\left[{\varPi} _{xz}\right]_{0}=0,} \end{equation}
 \begin{equation} \textstyle{\left[{\varPi} _{yy}\right]_{0}=\left[{\varPi} _{zz}\right]_{0}=-\left[{\varPi} _{xx}\right]_{0} \big/2.} \end{equation}
In addition, when the y-momentum equation in the conservation laws,
 ${\rm d}(p+{\varPi} _{yy})/ {\rm d}y=0$
, is integrated once with respect to y, the equation is reduced to
 \begin{equation} \textstyle{p+{\varPi} _{yy}=p_{m}+{\varPi} _{yy}\left(0\right)\quad\mathrm{or}\quad p+\left[{\varPi} _{yy}\right]_{0}=p_{m}.} \end{equation}
Here, p m represents the pressure at the centre of the channel.
On the other hand, when the nonlinear sinh factor
 $q_{2nd}$
and the driving force
 $[{\varPi} _{x{y_{0}}}]_{0}$
are eliminated from the constitutive equations of
 ${\varPi} _{xy}$
and
 ${\varPi} _{yy}$
in (2.5), there exists a kinematic stress constraint on the shear and normal stresses, implying their strong interdependence:
 \begin{equation} \textstyle{\left[{\varPi} _{xy}\right]_{0}^{2}=-\frac{3}{2}\left(p+\left[{\varPi} _{yy}\right]_{0}\right)\left[{\varPi} _{yy}\right]_{0}\!.} \end{equation}
Equation (2.9), together with (2.8), is then reduced to a very instructive form for
 $0 \leqslant y \leqslant H/2 $
:
 \begin{equation} \begin{array}{l} \dfrac{\left[{\varPi} _{xy}\right]_{0}}{p_{m}^{}{}{}}=\text{sign}\left({\varPi} _{xy0}\right)\sqrt{\dfrac{3}{2}\left(\dfrac{p}{p_{m}}-1\right)},{\quad}\\ \mathrm{or}\quad N_{{\delta _{L}}}\frac{\left[{{\varPi} }_{xy}^{*}\right]_{0}}{{p}_{m}^{*}}=\text{sign}\left({\varPi} _{xy0}\right)\sqrt{\frac{3}{2}\left(\frac{p^{*}}{{p}_{m}^{*}}-1\right)}. \end{array} \end{equation}
In the process, similar to the approach (Myong Reference Myong2011) for the derivation of a full analytical solution of the force-driven Poiseuille gas flow, the following dimensionless variables were introduced:
 \begin{align} \begin{aligned} &x^{*}=x/L,\quad y^{*}=y/H,\quad p^{*}=p/p_{{m_{L}}},\quad \textstyle{{{\varPi} }_{xy}^{*}={\varPi} _{xy}} \big/\left(\eta u_{av{e_{L}}}/H\right)\!, \\ &\varepsilon =L/H,\quad N_{{\delta _{L}}}=\eta u_{av{e_{L}}}/(p_{{m_{L}}}H), \end{aligned} \end{align}
where the subscripts m and L denote the states at the middle and the exit of the channel, respectively.
When (2.10) is combined with the non-dimensional x-momentum equation
 \begin{equation} \frac{{\rm d}{{\varPi} }_{xy}^{*}}{{\rm d}y^{*}}=\frac{1}{\varepsilon N_{{\delta _{L}}}}\left(-p^{*}\right){'},\end{equation}
it is then reduced to an ordinary differential equation of the cross-stream pressure:
 \begin{equation} \textstyle{\frac{\rm d}{{\rm d}y^{*}}\left(\text{sign}\left({\varPi} _{xy0}\right){p}_{m}^{*}\,\sqrt{\left(\frac{p^{*}}{{p}_{m}^{*}}-1\right)}\right)=\frac{1}{\varepsilon }\left(-p^{*}\right){'}.} \end{equation}
The centreline normalisation exploits the channel symmetry and serves as a natural reference state where several non-conserved quantities vanish by symmetry (e.g. shear stress
 ${\varPi} _{xy}$
, odd velocity moments). This choice is mathematically advantageous because it eliminates explicit dependence on the non-equilibrium parameter
 $N_{{\delta _{L}}}$
in the resulting cross-stream pressure equation (2.11), yielding a universal ordinary differential equation where rarefaction effects enter solely through the mid-plane pressure distribution. Physically, the centreline represents the plane of minimum pressure by symmetry, containing complete information about the flow state. A global reference state (e.g. inlet values or domain averages) would retain
 $N_{{\delta _{L}}}$
dependence and obscure the role of symmetry in determining pressure variations across the channel width.
Since the streamwise pressure distribution at the centreline
 $p_{m}(x^{*})$
can best represent the x
*-dependence of the two-dimensional pressure distribution
 $p(x^{*},y^{*})$
, the differential equation (2.11) is then reduced to an amenable form:
 \begin{equation} \textstyle{\frac{{p}_{m}^{*}}{p^{*}}\,{\rm d}\sqrt{\left(\frac{p^{*}}{{p}_{m}^{*}}-1\right)}=\text{sign}\left({\varPi} _{{xy_{0}}}\right)\sqrt{\frac{2}{3}}\frac{1}{\varepsilon }\left(-\ln {p}_{m}^{*}\right){'}\,{\rm d}y^{*}.} \end{equation}
By using an integral formula,
 \begin{equation} \int \frac{1}{p^{*}}\,{\rm d}\left(\sqrt{p^{*}-1}\right)=\tan ^{-1}\sqrt{p^{*}-1}, \end{equation}
the differential equation (2.12) yields the following full analytical solutions for the pressure distribution inside the channel
 $(0\leqslant x^{*}\leqslant 1,\ {-1/2}\leqslant y^{*}\leqslant 1/2)$
:
 \begin{equation} p^{*}(x^{*},y^{*})={p}_{m}^{*}(x^{*})(1+\tan ^{2}S^{*}), \end{equation}
where
 \begin{equation} S^{*}\equiv \sqrt{\frac{2}{3}}\frac{1}{\varepsilon }\left(-\ln {p}_{m}^{*}\right){'}y^{*}. \end{equation}
The dimensionless parameter
 $\varepsilon$
scales the argument of the tangent-function form of the cross-stream pressure (2.14). Though purely geometric, parameter
 $\varepsilon$
controls pressure non-uniformity curvature via viscous stress-gradient coupling;
 $N_{{\delta _{L}}}$
cancels from (2.11), making profile shape independent of
 $\textit{Kn}$
or M, while
 ${p}_{m}^{*}(x^{*})$
evolution depends on them.
Using (2.8) and (2.10), we can also obtain analytical solutions for the viscous stress distribution inside the channel:
 \begin{equation} \begin{array}{l} \left[{{\varPi} }_{xy}^{*}\left(x^{*},y^{*}\right)\right]_{0}=\text{sign}\left({\varPi} _{xy0}\right)\dfrac{\sqrt{3/2}}{N_{{\delta _{L}}}}{p}_{m}^{*}\left(x^{*}\right)\tan S^{*},\\[9pt] \left[{{\varPi} }_{yy}^{*}\left(x^{*},y^{*}\right)\right]_{0}=-\dfrac{1}{N_{{\delta _{L}}}}{p}_{m}^{*}\left(x^{*}\right)\tan ^{2}S^{*}. \end{array} \end{equation}
Note that these analytical solutions were primarily derived from four of the nine equations in (2.5), namely the following two components of the momentum conservation law and two components of the viscous stress constitutive equation:
 \begin{align} \begin{aligned} &\dfrac{\rm d}{{\rm d}y}\left[\begin{array}{c} {\varPi} _{xy}\\[9pt] p+{\varPi} _{yy} \end{array}\right]=\left[\begin{array}{c} -{\rm d}p/{\rm d}x \\[9pt] 0 \end{array}\right]\!, \\[9pt] &-\dfrac{1}{\eta }\left[\begin{array}{c} -(2/3)\left[{\varPi} _{xy}\right]_{0}\left[{\varPi} _{{xy_{0}}}\right]_{0}\\[9pt] \left(p+\left[{\varPi} _{yy}\right]_{0}\right)\left[{\varPi} _{{xy_{0}}}\right] \end{array}\right]=-\dfrac{p}{\eta }\left[\begin{array}{l} \left[{\varPi} _{yy}\right]_{0}\\[9pt] \left[{\varPi} _{xy}\right]_{0} \end{array}\right]q_{2nd}\left(\kappa \right)\!. \end{aligned} \end{align}
Since the balanced closure relation
 $\boldsymbol{\nabla }\boldsymbol{\cdot }\boldsymbol{\psi }^{(\boldsymbol{\varPi })}\underset{2nd}{=}\boldsymbol{0}$
and
 $\boldsymbol{\varLambda }^{(\boldsymbol{\varPi })}\underset{2nd}{=}-p\,\boldsymbol{\varPi }q_{2nd}(\kappa )/\eta$
is the only major assumption introduced in deriving the analytical solutions (2.14)–(2.16), the tangent-like functional form and the central minimum in the cross-stream pressure distribution are believed to be universal, rather than exceptional, and to hold for any monatomic gas. Notably, the specific functional form of the factor
 $q_{2nd}(\kappa )$
of the dissipation terms – encompassing temperature and heat flux effects – requires no approximations, as these terms cancel out during the derivation of the kinematic stress constraint (2.9). Consequently, the slip (jump) boundary conditions exert only a negligible, indirect influence on the cross-stream pressure and stress solutions, acting solely through their effect on the central streamwise pressure distribution.
From the tangent-function-form solutions (2.14)–(2.16), which we believe to be the first to be derived, we can obtain very instructive results. First, the cross-stream pressure and viscous stress distribution can be expressed in a compact tangent function form. Second, the length-to-height ratio
 $\varepsilon$
and the dimensionless relative pressure gradient along the central streamline,
 $(-{\rm d}{p}_{m}^{*}/{\rm d}x^{*})/{p}_{m}^{*}$
, are two essential parameters in establishing the convex cross-stream pressure distribution for microscale and rarefied gas flows inside the channel. Finally, the velocity and temperature boundary conditions play no role in the generic tangent function form of (2.14)–(2.16), while they will play an essential role in the determining the streamwise pressure distribution at the channel centreline
 $p_{m}(x^{*})$
. (It should be emphasised that the cross-stream pressure and normal stress distributions in the first-order Navier–Stokes theory are strictly uniform.)
The combined effects of Knudsen and Mach numbers are present in the relative pressure gradient, whose profiles are primarily determined by the pressure ratio, the inlet pressure, and the velocity slip and temperature jump conditions at the wall. Interestingly, a close examination of the tangent-function-form solutions (2.14)–(2.16) provides an observation that the streamwise pressure distribution at the channel centreline
 $p_{m}(x^{*})$
for a given inlet (
 $p_{m}(x^{*}=0)$
) or outlet (
 $p_{m}(x^{*}=1)$
) condition can be obtained from the pressure (
 $p^{*}(x^{*},1/2)$
) or shear stress (
 ${{\varPi} }_{xy}^{*}(x^{*},1/2)$
) data measured on the channel wall in an experimental study (which serve as boundary conditions), through the following nonlinear ordinary differential equations, respectively:
 \begin{equation} \begin{array}{l} \dfrac{{\rm d}{p}_{m}^{*}(x^{*})}{{\rm d}x^{*}}=-\sqrt{6}\varepsilon {p}_{m}^{*}\left(x^{*}\right)\cos ^{-1}\sqrt{\frac{{p}_{m}^{*}(x^{*})}{p^{*}(x^{*},1/2)}},\\[12pt] \dfrac{{\rm d}{p}_{m}^{*}(x^{*})\,}{{\rm d}x^{*}}=-\sqrt{6}\varepsilon {p}_{m}^{*}\left(x^{*}\right)\tan ^{-1}\left[\frac{N_{{\delta _{L}}}}{\sqrt{3/2}}\frac{\left| {{\varPi} }_{xy}^{*}(x^{*},1/2)\right| }{{p}_{m}^{*}(x^{*})}\right]\!. \end{array} \end{equation}
Although the present NCCR derivation provides exact closed-form solutions for pressure and viscous stress distributions, its applicability is constrained by several inherent assumptions: (i) the confinement to two-dimensional planar geometry, which neglects three-dimensional phenomena such as pipe flows or spanwise variations; (ii) the reliance on a predetermined streamwise centreline pressure p m (x), which restricts a fully autonomous closed-form implementation; and (iii) not explicitly incorporating the energy equation or heat flux constitutive relations, valid primarily for regimes where the flow Mach number is moderate with minimal viscous heating, and the second-order balance closure holds.
Furthermore, the convective term in the Navier–Stokes momentum equation is neglected under the assumption of weak inertial effects. This approximation is strictly valid when the Reynolds number, estimated using the kinetic theory relation Re ∼ M/
 $\textit{Kn}$
, is much smaller than unity, so that convective inertia remains weak compared to viscous and rarefaction effects. The present formulation is therefore primarily applicable to low-Reynolds-number rarefied flows in this regime. In our parameter range, some cases reach Reynolds numbers of order 1; for these, neglecting convection should be regarded as an approximation that may affect quantitative details while not altering the main non-equilibrium trends discussed here. Although an increased pressure ratio may lead to higher exit velocities, it is accompanied by a simultaneous reduction in gas density, such that the resulting Reynolds number remains moderate. For substantially higher Reynolds numbers, inertial contributions may become significant, and the accuracy of the present formulation may deteriorate.
3. The DSMC for validation and calculation of the non-equilibrium entropy
The DSMC method solves the Boltzmann kinetic equation by statistically simulating molecular motion and collisions, where each particle represents many real gas molecules. The DSMC decouples particle movement and collisions within small time steps, and operates on a grid divided into cells and sub-cells to manage interactions. Accurate results require small cell sizes (relative to the mean free path), short time steps (relative to collision time), and sufficient particles per cell. After initialisation and steady-state achievement, time-averaged sampling yields macroscopic properties such as temperature, velocity and pressure (Wagner Reference Wang and Li1992; Myong, Karchani & Ejtehadi Reference Myong, Karchani and Ejtehadi2019).
3.1. Computational boundary conditions for DSMC in channel flow
For imposing a specified pressure at the upstream (inlet) and downstream (outlet) at the middle of the channel, the method proposed by Wang & Li (Reference Xu2004) is used in the present work. For the upstream boundary, the characteristics theory yields
 \begin{align} \left(u_{\textit{in}}\right)_{\!j}=u_{\!j}+\frac{P_{\textit{in}}-p_{\!j}}{\rho _{\!j}a_{\!j}}, \end{align}
 \begin{align} (v_{\textit{in}})_{\!j}=v_{\!j}, \\[0pt] \nonumber \end{align}
where the subscript j represents the cell position, and u, v, p, ρ and a are the velocities in the x and y directions, pressure, density, and speed of sound, respectively. Then, by employing the equation of state, the number density can be obtained from a given pressure and temperature at the inlet:
 \begin{equation} n_{\textit{in}}=\frac{P_{\textit{in}}}{k_{B}T_{\textit{in}}}, \end{equation}
where k B is the Boltzmann constant. Subsequently, the number fluxes and the velocity components of entering molecules are determined locally from the Maxwellian distribution.
For the downstream boundary, the formulation presented by Liou & Fang (Reference Liou and Fang2000) is applied:
 \begin{equation} \left(\rho _{e}\right)_{\!j}=\rho _{\!j}+\frac{P_{out}-p_{\!j}}{(a_{\!j})^{2}}, \end{equation}
 \begin{equation} \left(u_{e}\right)_{\!j}=u_{\!j}+\frac{p_{\!j}-P_{out}}{\rho _{\!j}a_{\!j}}, \end{equation}
 \begin{equation} (v_{e})_{\!j}=v_{\!j}, \end{equation}
 \begin{equation} (T_{e})_{\!j}=P_{out}/\left[\left(\rho _{e}\right)_{\!j}R\right]\!, \end{equation}
where R is the gas constant.
To implement these conditions, the number flux of entering molecules is calculated from the local Maxwellian distribution. The streamwise thermal velocity
 $c'_{x}$
is sampled in the interval
 $[-u_{\!j},3V_{mp}]$
for the inlet, and
 $[-3V_{mp},-u_{\!j}]$
for the outlet, using the distribution
 \begin{equation} f_{{c'_{x}}}\propto (\beta c'_{x}+s_{\!j})\exp (-\beta ^{2}{c'}_{x}^{2}), \end{equation}
where
 $V_{mp}=\sqrt{2RT_{\!j}}$
is the local most probable thermal speed,
 $\beta =1/V_{mp}$
, and
 $s_{\!j}=u_{\!j}\beta$
is the molecular speed ratio at cell j. For both boundaries, the cross-stream components are determined by magnitude
 $A=\sqrt{-\ln (R_{\!f})}\,V_{mp}$
and a uniform angle
 $\phi =2\pi R_{\!f}$
.
Channel walls are treated as diffuse reflectors with full thermal and momentum accommodation. The reflected molecular velocity components
 $\boldsymbol{c}'$
are randomly assigned from a half-range Maxwellian distribution at the wall temperature
 $T_{w}$
:
 \begin{equation} \begin{array}{l} c'_{x}=\sqrt{-\log \left(R_{\!f}\right)}\,V_{mp,w}\sin \left(2\pi R_{\!f}\right)\!,\\[9pt] c'_{y}=\pm \sqrt{-\log \left(R_{\!f}\right)}\,V_{mp,w},\\[9pt] c'_{z}=\sqrt{-\log \left(R_{\!f}\right)}\, V_{mp,w}\cos \left(2\pi R_{\!f}\right), \end{array} \end{equation}
where
 $V_{mf,w}=\sqrt{2RT_{w}}$
is the most probable speed of the molecules at the wall temperature, and R
f
is a uniformly distributed random fraction between 0 and 1. The positive and negative signs for
 $c'_{y}$
correspond to reflections from the lower and upper walls, respectively.
3.2. Calculation of the non-equilibrium entropy
The non-conserved macroscopic properties of interest are derived using molecular gas dynamics relations (Bird Reference Bird1994). The viscous stress tensor is defined as the negative of the pressure tensor with the static pressure subtracted from the normal components:
 \begin{equation} \boldsymbol{\varPi }={\varPi} _{ij}=-\left(\rho\, \overline{c'_{i}c'_{\!j}}-\delta _{ij}p\right)\!, \end{equation}
where
 $c_i'$
and
 $c_j'$
are the components of the velocity of molecules relative to the stream velocity
c
ʹ, δ
ij
is the Kronecker delta, and p is the scalar pressure defined as
 \begin{equation} p=\frac{1}{3}\rho\, \overline{\boldsymbol{c}'^{2}}. \end{equation}
The heat flux vector is defined as
 \begin{equation} \boldsymbol{Q}=\frac{1}{2}\rho\, \overline{\boldsymbol{c}'^{2}\boldsymbol{c}'}+n\,\overline{\epsilon _{{int}}\boldsymbol{c}'}, \end{equation}
where εint is the internal energy of a single molecule.
In the framework of statistical mechanics, the thermodynamic probability or statistical weight
 $\varOmega$
represents the number of microstates associated with a given macrostate. Following the Boltzmann–Planck distribution for a dilute gas, the logarithm of the statistical weight is approximated via Stirling’s formula as (Vincenti & Kruger Reference Wagner1965)
 \begin{equation} \ln\varOmega \approx \sum _{\!j}N_{\!j}\left[1+\ln \left(\frac{c_{\!j}}{N_{\!j}}\right)\right]\!, \end{equation}
where N j denotes the number of particles in the jth energy group, and c j represents the number of available quantum states, or degeneracy, for that level.
By treating the energy spectrum as a continuum, and associating N j with the local molecular distribution function, the number of translational states for a particle of mass m is derived from the phase-space volume element as (Vincenti & Kruger Reference Wagner1965)
 \begin{equation} (c_{\!j})_{tr}=\frac{4\pi V}{h^{3}}\sqrt{2m^{3}\epsilon }\,{\rm d}\epsilon , \end{equation}
where V is the volume of the system,
 $\epsilon$
is the translational energy of the particle,
 ${\rm d}\epsilon$
is the energy increment, and h is Planck’s constant, which serves here as the fundamental constant for phase-space quantisation to ensure a dimensionless argument within the logarithm.
The resulting translational entropy density S
tr
is calculated by transforming the energy integral into velocity space (Vincenti & Kruger Reference Wagner1965; Schrock et al. Reference Shah, Gavasane, Agrawal and Bhandarkar2005; Chigullapalli et al. Reference Chigullapalli, Venkattraman, Ivanov and Alexeenko2010). We define the molecular distribution function f(
c
) such that its integral over velocity space yields the local number density,
 ${\int }_{-\infty }^{+\infty }f(\boldsymbol{c})\,{\rm d}\boldsymbol{c}=n$
. Under this normalisation, the local entropy density is expressed as
 \begin{equation} S_{tr}=k_{B}{\int }_{-\infty }^{+\infty }f\!\left(\boldsymbol{c}\right)\left[1-\ln \left(\frac{h^{3}n\,f(\boldsymbol{c})}{m^{3}}\right)\right]{\rm d}\boldsymbol{c}, \end{equation}
where c is the molecular velocity vector, m is the molecular mass, and k B is the Boltzmann constant. This expression accounts for the full velocity distribution sampled in the DSMC simulations, maintaining its validity in regions of significant translational non-equilibrium where the distribution deviates from the Maxwellian form.
To evaluate the entropy generation rate, we bypass the macroscopic entropy transport equations in favour of a kinetic formulation derived from a Boltzmann-based model equation (Chigullapalli et al. Reference Chigullapalli, Venkattraman, Ivanov and Alexeenko2010). The local entropy production is therefore quantified through a velocity-space integral involving the deviation of the distribution function from its corresponding equilibrium form:
 \begin{equation} \dot{s}_{\textit{gen}}=-\frac{\textit{Pr}\, p}{\eta }{\int }_{-\infty }^{\infty }\left(f\!\left(\boldsymbol{c}\right)-f_{0}\left(\boldsymbol{c}\right)\right)\ln \left(\frac{h^{3}\,f(\boldsymbol{c})}{m^{3}}\right){\rm d}\boldsymbol{c}, \end{equation}
where Pr is the Prandtl number, and f 0( c ) is the normalised Maxwellian (Maxwell–Boltzmann) velocity distribution function,
 \begin{equation} f_{0}\left(\boldsymbol{c}\right)=\left(\frac{m}{2\pi k_{B}T}\right)^{3/2}\exp \left[-\frac{m}{2k_{B}T}\boldsymbol{c}^{2}\right]\!. \end{equation}
4. Results and discussion
The gaseous compressible laminar flow is induced by the pressure difference (the inlet and outlet pressures P
in
and P
out
) imposed on the channel with length L and height H. The walls of the channel are kept at the same constant temperature T
w, which is equal to the upstream flow temperature T
in
. The flow velocity generated by the pressure difference varies in both the x and y directions. The DSMC code developed in previous studies (Ejtehadi, Roohi & Esfahani Reference Ejtehadi, Roohi and Esfahani2012; Ejtehadi, Roohi & Abolfazli Reference Ejtehadi, Roohi and Abolfazli2013; Esfahani et al. Reference Esfahani, Ejtehadi and Roohi2013) is modified in order to simulate the present microscale and rarefied channel gas flow. The variable hard sphere (VHS) collision model and collision pair selection based on the no time counter method are used. In all the simulations, the monatomic argon gas case is considered at reference temperature Tref
= 300 K, with reference dynamic viscosity
 $\eta _{{Ar}}=2.23\times 10^{-5}\ \mathrm{N\ s}\ \mathrm{m}^{-2}$
, molecular mass m = 6.63 × 10⁻²⁶ kg, viscosity–temperature index ω = 0.81, and VHS diameter dVHS
= 4.17 × 10⁻¹⁰ m. Simulations are performed for a wide range of rarefaction parameters, pressure ratios
 $\tilde{P}$
, and aspect ratios Ã, which lead to a Knudsen number variation from 0.0053 to 13.23, and a Mach number variation from 0.027 to 0.868. The Knudsen number is defined as
 $Kn=k_{B}T_{w}/\sqrt{2}\,\pi d^{2}pL$
in the present DSMC study.
For code verification, we compared our DSMC results with the approximate analytical Navier–Stokes solution of velocity and pressure distribution along channels subject to the velocity slip boundary condition for the plane channel geometry (Arkilic et al. Reference Arkilic, Schmidt and Breuer1997; Karniadakis, Beskok & Aluru Reference Karniadakis, Beskok and Aluru2005) for moderate Knudsen numbers and Mach numbers imposed by pressure ratios. Additional validation was performed against recent DSMC simulations by Ravichandir & Alam (Reference Rojas-Cárdenas, Graur, Perrier and Méolans2024) for Knudsen numbers as high as 50. Further details of these comparisons are provided in Appendix A.
The numerical resolution employed in the DSMC simulations satisfies established accuracy criteria for spatial discretisation, temporal integration and particle population (Alexander, Garcia & Alder Reference Alexander, Garcia and Alder1998; Hadjiconstantinou Reference Hadjiconstantinou2000; Hadjiconstantinou et al. Reference Hadjiconstantinou, Garcia, Bazant and He2003). The maximum computational cell dimension is 2 × 10⁻⁸ m, corresponding to a maximum ratio of cell size to the local mean free path
 $\Delta l/\lambda \leqslant 0.38 $
. The time step is chosen such that the ratio to the mean collision time satisfies
 $ \Delta t/\tau \leqslant 0.075 $
, remaining well within commonly accepted DSMC limits. Statistical convergence is ensured by maintaining a minimum of 20–30 simulation particles per cell in the steady state throughout the computational domain.
Furthermore, the spatially resolved entropy (3.15) and entropy generation rate (3.16) are computed using velocity distribution functions reconstructed from DSMC particle data via binning in discrete velocity bins of resolution Δv = 10 m s–1. This particle-based approach provide a rigorous statistical representation directly from the discrete molecular ensemble. Statistical uncertainties are spatially variable, with well-sampled bulk regions exhibiting low bin-population noise, and rarefied outlet regions experiencing larger scatter; the extended sampling procedure employed after reaching steady state ensures sufficient statistical resolution to capture non-equilibrium entropy generation features across the domain.
4.1. New second-order behaviour associated with cross-stream pressure distribution
The validity of analytical solutions of pressure distribution based on the second-order NCCR model derived in § 2 is investigated by comparing them with the DSMC results. As shown clearly in the final solutions (2.14) and (2.15) in compact tangent functional form, the height-to-length ratio
 $\varepsilon$
and the relative pressure gradient are found to play a dominant role in the cross-stream pressure distribution of the channels. Hence we consider monatomic argon gas in channels with two different aspect ratios and pressure ratios. The inlet pressure value P
in
= 1 atm is imposed for all the test cases.
It can be observed in figures 2(a) and 2(b) that for the smaller pressure ratio, i.e.
 $\tilde{P}$
= 2.5 (0.053 <
 $\textit{Kn} \lt 0.132$
), the NCCR model agrees well with the DSMC. For pressure ratio 10 (0.053 <
 $\textit{Kn} \lt 0.529$
) depicted in figures 2(c) and 2(d), the second-order NCCR model prediction is shown to be consistent with the DSMC result; nonetheless, a small discrepancy is observed at the channel exit for the case
 $\varepsilon$
= 8.
Comparison of NCCR analytical solutions and DSMC results for the normalised pressure field (p/Pin
) in pressure-driven rarefied Poiseuille flow of a monatomic gas in microchannels with aspect ratios
 $\varepsilon$
= 8, 16 and pressure ratios
 $\tilde{P}$
= 2.5, 10, at inlet pressure P
in
= 1 atm. Increasing pressure ratio enhances the convexity of the cross-stream pressure profiles, and strengthens rarefaction effects towards the outlet, with the second-order NCCR solution closely following the DSMC data throughout most of the channel; discrepancies appear near the entrance for
 $\varepsilon$
= 8 and exit for
 $\varepsilon$
= 8 and
 $\tilde{P}$
= 10, illustrating the sensitivity of the inlet and outlet regions to geometric constraints, especially at high pressure ratios.

Figure 2. Long description
A heat map compares normalized pressure fields in microchannels with aspect ratios of 8 and 16 and pressure ratios of 2.5 and 10. The heat map features a grid layout with the x-axis labeled as x/L and the y-axis labeled as y/L. The color scale ranges from blue to red, indicating normalized pressure values from 0.1 to 1.0. Higher values are associated with red, while lower values are associated with blue. The heat map shows four subplots, each representing different combinations of aspect ratios and pressure ratios. The subplots illustrate how increasing pressure ratio enhances the convexity of the cross-stream pressure profiles and strengthens rarefaction effects towards the outlet. The second-order NCCR solution closely follows the DSMC data throughout most of the channel, with discrepancies appearing near the entrance for an aspect ratio of 8 and near the exit for aspect ratios of 8 and 10. These discrepancies highlight the sensitivity of the inlet and outlet regions to geometric constraints, especially at high pressure ratios.
To investigate this issue in detail, the solutions obtained by DSMC, NSF and NCCR are plotted in figure 3(a). The first-order NSF solution predicts a uniform pressure distribution in the y direction, and remains close to the DSMC solution at the channel entrance. As the flow becomes more rarefied in the streamwise direction, the deviation from the DSMC solution increases. The second-order NCCR model, however, captures the nonlinear behaviour of pressure correctly. The NCCR solutions expressed in compact form
 $\tan ^{2}S^{*}$
are in close agreement with the DSMC results both qualitatively (i.e. a convex profile with maxima near the walls) and quantitatively at most sections of the channel. The present theoretical framework provides a detailed description of the convex cross-stream pressure distribution in channel gas flows, a phenomenon that is absent from classical continuum theory.
Streamwise variation of the normalised pressure p/Pout
at different cross-stream locations, comparing NSF, NCCR and DSMC solutions for pressure-driven Poiseuille flow in a channel with aspect ratio
 $\varepsilon$
= 8 and pressure ratio
 $\tilde{P} = 10 (0.053 \leqslant \textit{Kn} \leqslant 0.529$
), which corresponds to the case shown in figure 2(c). (a) The cross-stream pressure profile at a representative streamwise station. (b–d) Streamwise pressure distributions at the centreline, near-wall and intermediate locations.

Figure 3. Long description
The line graph compares the streamwise variation of the normalized pressure p/Pout at different cross-stream locations for NSF, NCCR, and DSMC solutions in pressure-driven Poiseuille flow within a channel. The channel has an aspect ratio of 8 and a pressure ratio, corresponding to the case shown in figure 2(c). The graph includes four subplots: (a) displays the cross-stream pressure profile at a representative streamwise station, while (b), (c), and (d) show the streamwise pressure distributions at the centerline, near-wall, and intermediate locations, respectively. The data series are represented by different line styles: solid lines for DSMC, dashed lines for NSF, and solid blue lines for NCCR. The x-axis represents the normalized streamwise coordinate x/L, and the y-axis represents the normalized pressure p/Pout. All values are approximated.
In figures 3(b–d), the streamwise pressure distributions are also plotted at different locations (including centre and wall) for further comparison. To address the observed discrepancy between NCCR and DSMC solutions at the channel exit, a parametric investigation was conducted across multiple aspect ratios and pressure ratios (see Appendix B for quantitative details). The results reveal that this discrepancy is primarily attributable to geometric constraints at low aspect ratios, rather than to a fundamental breakdown of the NCCR model or its underlying assumptions. Specifically, the analysis demonstrates that aspect ratio is the dominant controlling parameter for NCCR accuracy near the outlet, while pressure ratio effects become negligible at sufficiently large aspect ratios.
Furthermore, the classical notion of a fully developed flow does not strictly apply to compressible microscale and rarefied channel flows due to continuous variations in pressure, density and temperature. In this context, the interior region is defined as the portion where entrance and exit effects have sufficiently decayed. Streamwise analysis of the pressure field and the relative error between DSMC and NCCR solutions – evaluated near the walls where deviations are most pronounced – shows that boundary-affected regions depend strongly on the aspect ratio. For
 $\varepsilon$
= 4, approximately 15 % of the channel length near both the inlet and outlet exhibits increased error. However, for
 $\varepsilon$
= 8 and 16, these regions reduce to less than 10 % and 5 % of the length, respectively (see Appendix B). Consequently, for geometries with sufficiently large aspect ratios, the NCCR model provides excellent agreement with DSMC throughout the domain, ensuring that discrepancies near the boundaries are correctly identified as entrance/exit effects rather than modelling inaccuracies.
4.2. Thermophysical behaviours of microscale and rarefied gas flows inside channels
To provide in-depth information on microscale and rarefied gas flows inside channels, the contours of the thermodynamic variables, including entropy and entropy generation, are plotted in figure 4. Here, the vertical and horizontal coordinates are normalised by the distance between the parallel plates H and the channel width L, respectively. Density and pressure are normalised by their corresponding inlet values. The gas velocity and temperature are normalised by the speed of sound at the inlet, a 0, and the temperature of the wall, T w , respectively. Further, the heat flux and shear stress are normalised by the parameters ρ ∞ a 0 C p T w and 1/2ρ ∞ a 0 2, respectively, where ρ ∞ is the free-stream density, and C p is the specific heat capacity. The normalised heat flux, shear stress and normal stress are referred to as the heat flux coefficient C h , the friction coefficient C f , and the normal stress coefficient C n , respectively. Moreover, the entropy and entropy generation are normalised by k B and Pr p ∞ /η, respectively.
Contours of normalised primitive and non-equilibrium fields for pressure-driven rarefied Poiseuille flow of monatomic argon in a channel with isothermal walls at Tw
= Tin
, for P
in
= 2.4,
 $\tilde{P}$
= 2.4,
 $\varepsilon$
= 8 (
 $ 0.044 \leqslant \textit{Kn} \leqslant 0.11 $
), showing (a) density, (b) pressure, (c) streamwise velocity, (d) temperature, (e) streamwise heat flux Q
x
, (f) cross-stream heat flux, (g) shear stress, (h) streamwise normal stress, (i) entropy generation rate, and (j) translational entropy. The horizontal and vertical coordinates are normalised by the channel length L and plate spacing H, respectively; density and pressure are normalised by inlet values, velocity by the inlet speed of sound a
0, temperature by Tw
, heat flux and stress by ρ
∞
a
0
C
p
T
w
and 1/2ρ
∞
a
0
2, and entropy and entropy generation by k
B
and Pr p
∞
/η, respectively.

Figure 4. Long description
A heat map displays normalized fields for pressure-driven rarefied Poiseuille flow of monatomic argon in a channel with isothermal walls. The map includes ten subplots labeled (a) through (j), each representing different normalized fields: density, pressure, streamwise velocity, temperature, streamwise heat flux, cross-stream heat flux, shear stress, streamwise normal stress, entropy generation rate, and translational entropy. The horizontal and vertical coordinates are normalized by the channel length and plate spacing, respectively. Density and pressure are normalized by inlet values, velocity by the inlet speed of sound, temperature by wall temperature, heat flux and stress by specific combinations of these parameters, and entropy and entropy generation by Boltzmann constant and Prandtl number. Each subplot uses a color gradient to indicate the magnitude of the respective field, with specific color scales provided for each.
Figures 4(a–d) illustrate the density, pressure, velocity and temperature contours, respectively. As expected, both the density and the pressure decrease, while the velocity increases through the channel due to the imposed pressure boundary condition. Furthermore, the gas temperature decreases through the channel, and reaches its lowest at the centre of the exit due to the conversion of internal (thermal) energy into the kinetic energy of streamwise expansion and smaller viscous dissipation effects at the centre. Interestingly, the cross-stream distributions of density, pressure and temperature show very complex behaviours: concave, convex and convex, respectively. For example, the density at the centre of the channel is higher than that near the wall regions. The cross-stream distributions of temperature and density are the result of a precise balance within the internal energy equation.
For a compressible flow, the energy budget is governed by
 \begin{equation} \rho \boldsymbol{u}\boldsymbol{\cdot }\boldsymbol{\nabla }e=-p\,\boldsymbol{\nabla }\boldsymbol{\cdot }\boldsymbol{u}+\varPhi -\boldsymbol{\nabla }\boldsymbol{\cdot }\boldsymbol{Q}, \end{equation}
where e is the specific internal energy, and Ф is the viscous dissipation. The convex temperature profile is sustained by the spatial competition between these terms. Viscous dissipation (Ф) is concentrated near the walls due to high velocity gradients (
 $\partial u/\partial y$
), acting as a localised heat source. Conversely, the expansion work (
 $-p\,\boldsymbol{\nabla }\boldsymbol{\cdot }\boldsymbol{u}$
) acts as a volumetric sink that is most effective in the channel core, where the streamwise velocity and acceleration are highest. Crucially, as the gas becomes rarefied, the standard advective cooling (
 $\rho \boldsymbol{u}\boldsymbol{\cdot }\boldsymbol{\nabla }e$
) fails to balance this expansion work. This deficit is compensated by the heat flux divergence (
 $-\boldsymbol{\nabla }\boldsymbol{\cdot }\boldsymbol{Q}$
), which effectively redistributes energy towards the core.
While expansion work creates subtle cross-stream pressure variations to satisfy the transverse momentum balance, these variations are an order of magnitude smaller than the temperature gradients. Consequently, the established convex temperature profile, when coupled with the nearly uniform cross-stream pressure field, necessitates a concave density profile through the equation of state to maintain mechanical equilibrium. Thus the density distribution is the macroscopic manifestation of the internal energy balance. The spatial distributions of these budget terms for sample cases are provided in figure 8 below, supporting the proposed physical mechanism.
In the case of a convex cross-stream pressure distribution, a clear explanation of its origin was provided by the new second-order constitutive theory in § 4.1. However, for a deeper understanding of microchannel thermal gas flows in general, further theoretical and experimental investigations on the whole flow fields (Rojas-Cárdenas et al. Reference Samouda, Colin, Barrot, Baldas and Brandner2015; Samouda et al. Reference Schrock, McMullan and Camberos2015), including cross-stream distributions beyond usual reduced quantities such as the mass flow rate, may be required.
Figures 4(e–j) present the contours of the non-conserved variables. The study of such parameters is not only helpful in the thermal design of microfluidic devices but is also necessary to assess the accuracy of continuum-based thermodynamically consistent high-order constitutive models (Myong Reference Myong1999; Myong, Lockerby & Reese Reference Myong, Lockerby and Reese2006). Moreover, entropy and entropy generation are important thermodynamic quantities that are dependent upon both conserved and non-conserved variables. Figures 4(e) and 4(f) represent the heat flux in the x and y directions. It can be observed that the heat flux in the x direction has maximum value at the centre of the channel, while the heat flux in the y direction reaches maximum near the walls. Further, a comparison of these two parameters shows that the x component of the heat flux is dominant all over the domain due to the high gradients of temperature in the x direction.
The shear stress contour in figure 4(g) illustrates that the maximum value of the shear stress is found near the wall regions, and it increases as the flow becomes more rarefied, i.e. towards the channel exit. Furthermore, the contour of normal stress in figure 4(h) shows higher values of absolute stress in denser regions of the channel, and shows convex profiles that satisfy the y-momentum equation in the conservation laws given in (2.6).
4.3. Characteristics of the non-equilibrium entropy
Figure 4(i) presents the spatial distribution of entropy generation. Entropy production is markedly enhanced in the more rarefied regions of the channel, particularly near the channel exit, where non-equilibrium effects reach their maximum. The distribution of entropy generation exhibits an inverse relationship with temperature, as shown in figures 4(i) and 4(d). At a molecular level, entropy generation is the rate of increase in disorder associated with irreversible processes such as viscous friction and heat transfer. In the highly rarefied and strong non-equilibrium exit region, steep velocity and temperature gradients drive large irreversible fluxes of momentum and energy. Although molecular collisions are less frequent in a rarefied gas, the pronounced non-equilibrium in the local molecular velocity distribution means that each collision contributes more substantially to the relaxation towards equilibrium and entropy production.
Therefore, the rate of entropy generation remains elevated in these regions. In the cross-stream direction, the influence of temperature on entropy becomes apparent. At a given cross-section of the channel, rarefaction effects are minimal; thus entropy variation is primarily governed by the temperature distribution. Entropy increases from the centre of the channel towards the walls due to the rise in temperature in that direction. Near the cold centre region, molecules have a narrower velocity distribution, corresponding to lower translational energy. In contrast, near the hot walls, the velocity distribution becomes broader and more disordered, leading to higher entropy.
The contour of translational entropy is shown in figure 4(j). In statistical thermodynamics, the bulk temperature is proportional to the variance of the molecular velocity. Since variance is a measure of data spread from the mean and an indicator of randomness, one might infer a correlation between entropy and temperature profiles: specifically, that entropy (molecular disorder) increases in regions of higher temperature. However, as shown in figure 4(j), the translational entropy increases along the channel. This property reflects the disorder in the position and translational motion of molecules. Its behaviour is a competition between two effects: cooling (which decreases kinetic disorder) and expansion (which increases positional disorder). As the gas moves down the channel, the specific volume increases significantly, allowing molecules a much larger space to occupy. This increase in positional disorder (more microstates available) is the dominant factor, causing a net increase in translational entropy.
4.4. Non-Fourier heat transfer and its mechanisms in microscale and rarefied gas flows inside channels
The classic Fourier constitutive relation
 $\boldsymbol{Q}=-k\,\boldsymbol{\nabla }T$
rests upon the assumption of local thermodynamic equilibrium, where the molecular velocity distribution function deviates only slightly from a Maxwellian state. In rarefied and microscale flows, as the Knudsen number increases beyond the slip regime, this assumption fails (Akhlaghi, Roohi & Stefanov Reference Akhlaghi, Roohi and Stefanov2018; Qiao & Shang Reference Rana, Ravichandran, Park and Myong2024). Non-Fourier behaviour, often characterised by ‘anti-Fourier’ heat flux directed against the temperature gradient, has been documented in various non-equilibrium configurations. Prior studies have identified these anomalies in microscale cavity flows (Mohammadzadeh et al. Reference Mohammadzadeh, Roohi, Niazmand, Stefanov and Myong2012), microchannels subjected to complex heat-flux boundary conditions (John, Gu & Emerson Reference John, Gu and Emerson2013; Balaj, Roohi & Mohammadzadeh Reference Balaj, Roohi and Mohammadzadeh2017), and systems with non-uniform geometries such as diverging or converging channels (Ebrahimi et al. Reference Ebrahimi, Shahabi and Roohi2021).
The present work extends this understanding by investigating these behaviours in the fundamental case of a parallel-walled channel under purely pressure-driven conditions. While the existence of upstream-directed heat-flux components is consistent with Onsager reciprocal relations in linear irreversible thermodynamics, the present study mechanistically explains their dominant realisation in a purely pressure-driven, moderate-Mach-number channel with strong rarefaction and stress–work coupling in the absence of geometric complexity or external heat sources. Table 1 summarises the simulated cases and the corresponding range of Knudsen numbers considered in §§ 4.4.1 and 4.4.2 to investigate the details of this phenomenon.
Summary of the simulated channel-flow cases, including inlet and outlet pressures and the corresponding Knudsen numbers
 $(Kn=k_{B}T_{w}/\sqrt{2}\,\pi d^{2}pL)$
. All simulations are performed for channel aspect ratio 8 and pressure ratio 2.5.

Effect of rarefaction, controlled by inlet pressure P
in
, on the DSMC-computed streamwise and cross-stream components of the heat flux in a channel with aspect ratio
 $\varepsilon$
= 8 and pressure ratio
 $\tilde{P}$
= 2.5. (a–d) Cases 1–4 of table 1, P
in
= 10, 5, 1, 0.5 atm (Knin
= 0.0053, 0.0106, 0.0529, 0.1058), respectively, showing the Fourier contribution (based on local
 $\boldsymbol{\nabla}T$
), the non-Fourier contribution, and the total DSMC heat flux in the x and y directions normalised by ηRTw
/H.

Figure 5. Long description
A heat map showing the effect of rarefaction, controlled by inlet pressure Pin, on the DSMC-computed streamwise and cross-stream components of the heat flux in a channel with aspect ratio 8 and pressure ratio 2.5. The heat map includes four cases from table 1, with Pin values of 10, 5, 1, and 0.5 atm, corresponding to Knin values of 0.0053, 0.0106, 0.0529, and 0.1058, respectively. The heat map displays the Fourier contribution based on local values, the non-Fourier contribution, and the total DSMC heat flux in the x and y directions, normalized by RTw/H. The color scale indicates the intensity of the heat flux, with different colors representing different ranges of values.
Figure 5 demonstrates a striking departure from continuum predictions: the streamwise heat flux Q x exhibits a sign reversal, transporting energy upstream against the dominant temperature gradient. Each panel shows the Fourier and non-Fourier contributions to heat flux, and DSMC-obtained heat flux in x (left-hand panels) and y (right-hand panels) directions. Both Fourier and non-Fourier contributions decrease as the Knudsen number increases; however, the sign change happens at only larger Knudsen numbers. While the temperature monotonically decreases towards the outlet, the actual heat flux is directed upstream – the hallmark of non-Fourier transport.
This reversal is further visualised through the heat-line patterns in figure 6 obtained from Fourier’s classical law (left-hand panels) and direct DSMC molecular simulation (right-hand panels) across a range of inlet pressures and pressure ratios. For all cases, the Fourier temperature field is extracted directly from DSMC data, ensuring identical temperature input while isolating the effect of the constitutive relation on heat-line geometry. The Fourier law predicts heat transport from high to low temperature regions, exhibiting consistently similar patterns across all inlet pressures.
Heat-line patterns in the x–y plane obtained from Fourier’s law (left-hand panels) and from DSMC simulations (right-hand panels), overlaid on normalised temperature contours, for a channel with aspect ratio
 $\varepsilon$
= 8 and pressure ratio
 $\tilde{P}$
= 2.5. (a–d) Cases 1–4 of table 1, inlet pressures Pin
= 10, 5, 1, 0.5 atm (Knin
= 0.0053, 0.0106, 0.0529, 0.1058), respectively, with the Fourier heat-lines computed using the DSMC temperature field to isolate the effect of the constitutive relation. At high inlet pressure (low
 $\textit{Kn}$
), the DSMC heat-lines resemble Fourier predictions, but as Pin
decreases and rarefaction intensifies, the DSMC heat-lines clearly show heat flowing from colder outlet towards hotter inlet, in stark contrast with the classical Fourier patterns.

Figure 6. Long description
The image displays heat-line patterns in the xy plane obtained from Fourier’s law on the left-hand panels and from DSMC simulations on the right-hand panels, overlaid on normalized temperature contours. The channel has an aspect ratio of 8 and a pressure ratio of 2.5. The cases shown correspond to inlet pressures of 10, 5, 1, and 0.5 atm, with Knudsen numbers of 0.0053, 0.0106, 0.0529, and 0.1058, respectively. The Fourier heat-lines are computed using the DSMC temperature field to isolate the effect of the constitutive relation. At high inlet pressure and low Knudsen number, the DSMC heat-lines resemble Fourier predictions. However, as the inlet pressure decreases and rarefaction intensifies, the DSMC heat-lines show heat flowing from the colder outlet towards the hotter inlet, in stark contrast with the classical Fourier patterns.
However, the true DSMC heat-lines reveal a dramatic departure from Fourier behaviour as the inlet pressure decreases and rarefaction increases. At low
 $\textit{Kn}$
cases or high inlet pressure (P
in
= 10 atm), the DSMC heat-lines qualitatively resemble the Fourier prediction. As the inlet pressure drops to intermediate values (Pin
= 5 atm), the DSMC heat-lines begin to exhibit pronounced deviations, with localised reversals and enhanced cross-stream circulation that Fourier theory cannot capture. Most strikingly, at low inlet pressures (P
in
= 1 and 0.5 atm), the DSMC heat-lines display the counterintuitive phenomenon of heat transport directly from cold to hot – a violation of the classical Fourier’s law.
4.4.1. Kinetic decomposition of the heat flux
Following the microscopic sampling procedures in DSMC, the components of the heat flux vector
 $\boldsymbol{Q}$
for a monatomic gas are decomposed into contributions from the energy flux and the work done by the pressure tensor. We define the instantaneous molecular velocity as
 $\boldsymbol{c}=\boldsymbol{u}_{0}+\boldsymbol{c}'$
, where
 $\boldsymbol{u}_{0}=(u_{0},v_{0},w_{0})$
is the mean flow velocity, and
 $\boldsymbol{c}'=(c'_{x},c'_{y},c'_{z})$
is the peculiar velocity. The heat flux in the x direction is defined as
 \begin{equation} Q_{x}=\frac{1}{2}\rho\, \overline{c^{2}c_{x}}. \end{equation}
By substituting the molecular velocity decomposition (
 $c_{i}=u_{0,i}+c'_{i}$
) and applying the definition of the traceless viscous stress tensor, the relation is expanded as
 \begin{align} \begin{aligned} Q_{x}&=\rho \left(\overline{\frac{1}{2}c^{2}c_{x}}-\overline{\frac{1}{2}c^{2}}\,u_{0}\right)-\left(p_{xx}u_{0}+p_{xy}v_{0}+p_{xz}w_{0}\right) \\[9pt] &=\underset{\text{energy flux }\left(\mathrm{\mathcal{F}}\right)}{\underbrace{\rho \left(\overline{\frac{1}{2}c^{2}c_{x}}-\overline{\frac{1}{2}c^{2}}\,u_{0}\right)}}-\underset{\text{pressure work }\left(\mathrm{\mathcal{P}}\right)}{\underbrace{(pu_{0}+ \textstyle{{\varPi} _{xx}u_{0}+{\varPi} _{xy}v_{0}+{\varPi} _{xz}}w_{0})}}, \end{aligned} \end{align}
where
 $c^{2}={c}_{x}^{2}+{c}_{y}^{2}+{c}_{z}^{2}$
. This formulation allows for a direct comparison between the energy flux – representing the transport of translational kinetic energy by molecular fluctuations – and the pressure work, which describes the rate of work done by the total pressure tensor on the mean flow.
The spatial distribution of these components is presented in figure 7. The decomposition reveals that the pressure work
 $(\mathrm{\mathcal{P}})$
term dominates the non-Fourier behaviour in the core of the channel, particularly in the streamwise direction. While the energy flux
 $(\mathrm{\mathcal{F}})$
term – representing the standard convective–diffusive transport of molecular energy – remains positive and aligned with continuum expectations, the pressure work term attains a magnitude sufficient to reverse the sign of the heat flux Q
x
.
Decomposition of the streamwise and cross-stream heat flux, Q
x
and Q
y
, into energy-flux and pressure-work contributions normalised by ηRTw
/H in a channel with aspect ratio
 $\varepsilon$
= 8 and pressure ratio
 $\tilde{P}$
= 2.5, at different inlet pressures Pin
= 10, 5, 1, 0.5 atm. (a–d) Cases 1–4 of table 1, respectively. The decomposition follows the kinetic relation in (4.3), separating convective transport of translational energy by molecular fluctuations
 $(\mathrm{\mathcal{F}})$
from the work done by the anisotropic pressure tensor on the mean flow
 $(\mathrm{\mathcal{P}})$
.

Figure 7. Long description
A heat map showing the decomposition of streamwise and cross-stream heat flux, Qx and Qy, into energy-flux and pressure-work contributions normalized by RTw/H in a channel with aspect ratio 8 and pressure ratio 2.5 at different inlet pressures Pin = 10, 5, 1, 0.5 atm. The heat map is divided into four sections, each representing a different inlet pressure. Each section contains two subplots: one for the streamwise heat flux (Qx) and one for the cross-stream heat flux (Qy). The color scale ranges from blue to red, indicating the magnitude of the heat flux contributions. Higher values are represented by red, while lower values are represented by blue. The heat map shows variations in heat flux contributions across different inlet pressures, highlighting the impact of pressure on heat transfer in the channel.
Cross-sectional profiles of the terms in the dimensionless internal energy equation at a representative streamwise location (
 $x=7L/8$
). All terms are normalised by the local flow power density
 $pu/H$
. (a) Normalised viscous dissipation (
 $\varPhi$
) showing frictional heating localised within the Knudsen layer. (b) Normalised expansion work (
 $p\,\boldsymbol{\nabla }\boldsymbol{\cdot }\boldsymbol{u}$
) acting as a persistent energy sink across all regimes. (c) Normalised internal energy advection (
 $\rho\, \boldsymbol{u}\boldsymbol{\cdot }\boldsymbol{\nabla }e$
), illustrating the breakdown of convective cooling as the gas becomes rarefied. (d) Normalised heat flux divergence (
 $\boldsymbol{\nabla }\boldsymbol{\cdot }\boldsymbol{Q}$
), showing its emergence as the primary source term balancing expansion work at high Knudsen numbers.

Figure 8. Long description
The image contains four line graphs labeled (a) through (d), each depicting different terms in the dimensionless internal energy equation at a representative streamwise location. All terms are normalized by the local flow power density. Graph (a) shows normalized viscous dissipation, highlighting frictional heating localized within the Knudsen layer. Graph (b) illustrates normalized expansion work, acting as a persistent energy sink across all regimes. Graph (c) presents normalized internal energy advection, demonstrating the breakdown of convective cooling as the gas becomes rarefied. Graph (d) displays normalized heat flux divergence, emerging as the primary source term balancing expansion work at high Knudsen numbers. Each graph uses different line styles to represent various atmospheric pressures, including 10 atmospheres, 5 atmospheres, 1 atmosphere, and 0.5 atmospheres.
This dominance arises from the high degree of anisotropy in the pressure tensor p ij characteristic of rarefied expansion. In these flows, not only are the normal stress components (p xx , p yy , p zz ) comparable to the isotropic pressure p, but their evolution is decoupled from the local temperature gradient. As the gas accelerates (du/dx > 0), the streamwise normal stress performs work on the fluid. Within the kinetic energy budget, this mechanical coupling creates an energy transport pathway that is directed upstream.
Unlike Fourier’s law, which assumes an isotropic state where pressure work is purely a volumetric expansion effect (
 $-p\,\boldsymbol{\nabla }\boldsymbol{\cdot }\boldsymbol{u}$
), the rarefied energy transport is governed by the specific coupling of the anisotropic p
xx
and p
xy
components with the velocity gradients. Consequently, the non-Fourier heat flux is a result of not anomalous thermal diffusion, but rather a mechanical energy transport necessitated by the non-equilibrium stress state of the gas.
4.4.2. Quantitative energy budget and the advection–flux divergence shift
To isolate the physical drivers of this reversal, we examine the internal energy equation normalised by the local flow power density, pu/H. The steady-state balance is given by (4.1). The normalised cross-sectional profiles in figure 8 reveal a fundamental shift in transport mechanisms. Figure 8(a) confirms that viscous dissipation remains a near-wall phenomenon, while figure 8(b) shows that expansion work acts as a persistent volumetric energy sink across all regimes. The critical departure occurs in figures 8(c) and 8(d).
In the near-continuum regime, expansion work is balanced by a corresponding drop in internal energy, evidenced by the large negative advection profile. The gas cools as it expands. In the high Knudsen regime, however, the advection term collapses towards zero. Despite the gas performing work, its temperature does not drop. The energy balance is instead maintained by the heat flux divergence, which becomes the dominant positive source term in the core. This confirms that the upstream heat flux is a physical necessity; it supplies the energy required for expansion work when the gas enters a nearly isothermal, non-equilibrium state.
The microscopic and macroscopic origins of non-Fourier heat transport in rarefied expansion flows arise from a fundamental coupling between ballistic molecular motion and anisotropic stress–work. At the microscopic level, the increased mean free path in the transition regime allows molecules to traverse significant portions of the channel with minimal collisions, enabling high-energy molecules from the inlet to reach deep into the channel. This ballistic mixing of molecular populations – where energetic inlet molecules overlap with lower-energy outlet populations – creates a skewed velocity distribution function, as reflected in the normalised translational entropy (S tr ) profiles.
Simultaneously, the normalised entropy generation (
 $\dot{s}_{\textit{gen}}$
) reveals significant core-flow irreversibility towards the outlet. This irreversibility is driven not by thermal gradients but by the thermodynamic cost of maintaining a non-equilibrium state where the pressure tensor p
ij
is non-isotropic (
 $p_{xx}\neq p_{yy}\neq p_{zz}$
). As the gas accelerates, the work done against the streamwise normal stress p
xx
creates a stress–work coupling (
 $p_{xi}u_{i}$
) that effectively converts mechanical power into an upstream-directed energy flux, counteracting the cooling effect of expansion. Consequently, the resulting net heat flux becomes a global property of molecular trajectories and mechanical coupling rather than a local response to temperature gradients.
The DSMC method is widely regarded as computationally equivalent to solving the Boltzmann kinetic equation, and its results are considered accurate. It is sometimes used as a benchmark to validate other mathematical models. However, its application requires caution, especially when experimental validation is not possible or when available data for the flow problem in question are lacking. Although the core flow phenomena in micro-Poiseuille flow are not influenced by the boundary conditions (Farbar & Boyd Reference Farbar and Boyd2014; Shah et al. Reference Shan, Yuan and Chen2017), replacing simplified inlet and outlet boundary conditions with full simulations that explicitly include the upstream and downstream reservoirs could help to reduce such uncertainties. However, such an analysis is beyond the scope of the present study and is left for future work. Based on the present results, we can state with confidence that DSMC predicts the presence of cold-to-hot heat transfer in microscale and rarefied gas flows inside channels. We hope that future experimental and other computational studies will verify or refute this counterintuitive finding.
4.5. Combined effects of rarefaction, pressure ratio and aspect ratio
The rarefaction effects are investigated for two cases: (i) maintaining the inlet pressure constant while varying the pressure ratio (
 $\tilde{P}$
) and aspect ratio (
 $\varepsilon$
); (ii) maintaining the pressure ratio constant while varying the inlet pressure and aspect ratio. Figures 9–13 represent the non-dimensional profiles of different properties in the symmetry line of the channel. In these figures, panels (a–c) represent test cases with constant inlet pressure, while panels (d–f) represent test cases with a constant pressure ratio. Such a numerical set-up leads to gas flows of different densities in various Knudsen number and Mach number regimes. Here, Mout
represents the Mach number calculated using the averaged velocity at the channel outlet. The simulated cases are tabulated in table 2.
Simulation cases with various Knudsen numbers and Mach numbers.

Table 2. Long description
A table with 24 rows and 9 columns comparing simulation cases with various Knudsen numbers and Mach numbers. The columns include Case, Aspect ratio, Pin, Pressure ratio, Pout, Knin, Knout, and Mout. The table presents data for different scenarios, maintaining either constant inlet pressure or constant pressure ratio while varying other parameters. Notable trends include variations in Knudsen and Mach numbers across different cases.
Streamwise evolution of the normalised density along the channel centreline for various pressure ratios and aspect ratios, illustrating the combined influence of pressure drop and geometric confinement on rarefied expansion. (a–c) Cases with fixed inlet pressure Pin
= 1 atm (Knin
= 0.0529) and increasing pressure ratio
 $\tilde{P}$
= 1.25, 2.5, 5, 10 for aspect ratios
 $\varepsilon$
= 4, 8, 16, respectively. (d–f) Cases with fixed
 $\tilde{P}$
= 2.5 and decreasing Pin
, covering near-continuum to free-molecular regimes.

Figure 9. Long description
The line graph illustrates the streamwise evolution of normalized density along the channel centerline for various pressure ratios and aspect ratios. The x-axis represents the normalized distance along the channel, while the y-axis represents the normalized density. The graph includes multiple data lines, each corresponding to different pressure ratios and aspect ratios. For cases with a fixed inlet pressure of 1 atmosphere, the pressure ratios are 1.25, 2.5, 5, and 10, with aspect ratios of 4, 8, and 16. For cases with a fixed pressure ratio of 2.5, the inlet pressures decrease, covering near-continuum to free-molecular regimes. The data lines show how the density changes along the channel length under different conditions, highlighting the combined influence of pressure drop and geometric confinement on rarefied expansion. All values are approximated.
Streamwise variation of normalised streamwise velocity along the channel centreline for the same set of cases as in figure 9, showing the effect of pressure ratio, inlet pressure and aspect ratio on the acceleration of the gas: (a–c) fixed Pin
= 1 atm (Knin
= 0.0529) with increasing
 $\tilde{P}$
for
 $\varepsilon$
= 4, 8, 16; (d–f) fixed
 $\tilde{P}$
= 2.5 with decreasing Pin
.

Figure 10. Long description
The line graph displays the streamwise variation of normalized streamwise velocity along the channel centerline. The x-axis represents the normalized streamwise distance (x/L), ranging from 0 to 1. The y-axis represents the normalized streamwise velocity (u/a0), ranging from 0 to 1. The graph consists of six subplots labeled (a) through (f). Subplots (a), (b), and (c) show the effect of increasing aspect ratio (ε) with a fixed inlet pressure (Pin) of 1 atmosphere. Subplots (d), (e), and (f) show the effect of decreasing inlet pressure (Pin) with a fixed aspect ratio (ε) of 2.5. Each subplot contains multiple lines representing different pressure ratios (P) or inlet pressures (Pin). The lines indicate how the velocity varies along the channel centerline under different conditions. All values are approximated.
Streamwise variation of normalised temperature along the channel centreline for varying pressure ratios, inlet pressures and aspect ratios, complementing the density and velocity trends in figures 9 and 10. (a–c) The effect of increasing
 $\tilde{P}$
at fixed Pin
= 1 atm (Knin
= 0.0529) for
 $\varepsilon$
= 4, 8, 16, demonstrating strong cooling near the outlet due to conversion of internal energy into streamwise kinetic energy under large pressure drops, especially in long channels. (d–f) The influence of increasing rarefaction at fixed
 $\tilde{P}$
= 2.5, revealing that the overall temperature variation is primarily controlled by the imposed pressure ratio and becomes increasingly small (less than approximately 7 % for
 $\varepsilon$
= 4) as
 $\varepsilon$
increases, indicating an approach to quasi-isothermal behaviour in long, highly rarefied channels.

Figure 11. Long description
The line graph presents the streamwise variation of normalized temperature along the channel centerline for varying pressure ratios, inlet pressures, and aspect ratios. The x-axis represents the normalized channel length (x/L), ranging from 0 to 1. The y-axis represents the normalized temperature (T/T_in), ranging from 0.70 to 1.05. The graph is divided into six subplots labeled (a) to (f). Subplots (a), (b), and (c) show the effect of increasing aspect ratio (ε) at a fixed inlet pressure (P_in) of 1 atmosphere for ε values of 4, 8, and 16, respectively. Each subplot contains four lines representing different pressure ratios (P) of 1.25, 2.5, 5, and 10. Subplots (d), (e), and (f) illustrate the influence of increasing rarefaction at a fixed aspect ratio (ε) of 2.5 for ε values of 4, 8, and 16, respectively. Each subplot contains four lines representing different inlet pressures (P_in) of 1 atmosphere, 0.1 atmosphere, 0.05 atmosphere, and 0.01 atmosphere. The data shows strong cooling near the outlet due to the conversion of internal energy into streamwise kinetic energy under large pressure drops, especially in long channels. The overall temperature variation is primarily controlled by the imposed pressure ratio and becomes increasingly small as the aspect ratio increases, indicating an approach to quasi-isothermal behavior in long, highly rarefied channels. All values are approximated.
Normalised translational entropy profiles along the channel centreline for different combinations of pressure ratio, inlet pressure and aspect ratio, providing a measure of molecular disorder associated with expansion and rarefaction. (a–c) The increase of normalised entropy with
 $\tilde{P}$
at fixed Pin
= 1 atm (Knin
= 0.0529) for
 $\varepsilon$
= 4, 8, 16, with the effect amplified by larger aspect ratios due to greater spatial development of gradients. (d–f) At fixed
 $\tilde{P}$
= 2.5, decreasing Pin
(increasing rarefaction) also raises the normalised entropy but simultaneously reduces the influence of aspect ratio, leading to nearly collapsed profiles in the highly rarefied regime where the thermodynamic state becomes primarily governed by molecular expansion statistics rather than geometric details.

Figure 12. Long description
The line graph displays normalized translational entropy profiles along the channel centerline for various combinations of pressure ratio, inlet pressure, and aspect ratio. The x-axis represents the normalized position along the channel length (x/L), ranging from 0 to 1. The y-axis represents the normalized translational entropy (S_tr/k_B), ranging from 6.8 to 7.4 in the top row and from 6.5 to 9.0 in the bottom row. The top row of graphs (a, b, c) shows the increase in normalized entropy with position at a fixed inlet pressure of 1 atmosphere for aspect ratios of 4, 8, and 16. Different line styles represent different pressure ratios (P = 1.25, 2.5, 5, 10). The bottom row of graphs (d, e, f) shows the effect of decreasing inlet pressure (P_in = 1, 0.1, 0.05, 0.01 atmospheres) at a fixed pressure ratio of 2.5 for aspect ratios of 4, 8, and 16. The entropy profiles are nearly collapsed in the highly rarefied regime, indicating that the thermodynamic state is primarily governed by molecular expansion statistics rather than geometric details. All values are approximated.
Normalised entropy generation profiles along the channel centreline for the same cases as in figure 12, highlighting the rate of irreversible dissipation and the local degree of thermodynamic non-equilibrium. (a–c) Entropy generation increases downstream and is strongly enhanced by both higher pressure ratio and larger aspect ratio, reflecting steeper velocity and temperature gradients, and stronger non-equilibrium near the outlet in wide, pressure-driven channels. (d–f) In contrast, at fixed
 $\tilde{P}$
= 2.5, lowering Pin
(increasing
 $\textit{Kn}$
) reduces the normalised entropy generation despite the velocity distribution becoming more non-Maxwellian, consistent with the reduced collision frequency in highly rarefied flows.

Figure 13. Long description
The line graph displays normalized entropy generation profiles along the channel centerline for various pressure ratios and aspect ratios. The x-axis represents the normalized channel length (x/L), ranging from 0 to 1. The y-axis represents the normalized entropy generation rate (s_gen/ (Pr p/η)), ranging from 0 to 1.6. The graph consists of six subplots labeled (a) to (f). Subplots (a) to (c) show the effect of different pressure ratios (P = 1.25, 2.5, 5, 10) on entropy generation for aspect ratios (epsilon) of 4, 8, and 16 respectively. Subplots (d) to (f) show the effect of different inlet pressures (P_in = 1 atm, 0.1 atm, 0.05 atm, 0.01 atm) on entropy generation for a fixed pressure ratio (P = 2.5) and aspect ratios (epsilon) of 4, 8, and 16 respectively. The data lines indicate that entropy generation increases downstream and is strongly enhanced by both higher pressure ratio and larger aspect ratio, reflecting steeper velocity and temperature gradients, and stronger non-equilibrium near the outlet in wide, pressure-driven channels. In contrast, at a fixed pressure ratio, lowering the inlet pressure reduces the normalized entropy generation despite the velocity distribution becoming more non-Maxwellian, consistent with the reduced collision frequency in highly rarefied flows. All values are approximated.
For constant P in cases, pressure ratios 1.25, 2.5, 5 and 10 are selected, and cover near-continuum to early transition regimes. In other cases, with fixed pressure ratio 2.5, the inlet pressure is varied to cover a wide range of rarefied regimes, from near-continuum to free-molecular.
4.5.1. Behaviour of primitive variables
The physical behaviours of primitive variables with respect to pressure ratio, inlet pressure and aspect ratio are investigated. As shown in figures 9(a–c), high pressure ratios increase the nonlinearity of the density profile, especially near the outlet. Moreover, when the pressure ratio is higher than 2.5, the rate of density decrease with increasing pressure ratio decreases. Increasing aspect ratio shows almost the same trend in density profile; however, for larger aspect ratios, the rate of density decrease with increasing pressure ratio is higher. Figures 9(d–f) represent the rarefaction effects when the pressure ratio is kept constant. The most important feature is that the nonlinearity of the density profile is reduced, resulting in a nearly linear profile under highly rarefied conditions. In contrast, the aspect ratio was found to have no significant effect on the normalised density profile.
Figures 10(a–c) depict the effect of the pressure ratio on a normalised velocity profile. It can be observed that the velocity increases through the channel at a moderate rate, but rapidly increases near the outlet in the case of a high aspect ratio. The maximum exit speed decreases with increasing aspect ratio. Figures 10(d–f) illustrate that for a constant pressure ratio, the velocity at the centre of the channel decreases with increasing rarefaction. A turning point in the velocity profile can be observed near x/L = 0.05 for
 $\varepsilon$
= 4. It moves towards the inlet, and finally vanishes as the aspect ratio increases. A counterintuitive result was observed: while the velocity generally decreases with increasing rarefaction, the trend is reversed near the free-molecular regime when the inlet pressure is 0.01 atm.
Figure 11 shows the temperature variation in the middle of the channel. Figures 11(a–c) show that high pressure ratios lead to a strong cooling effect associated with streamwise gas expansion, especially near the outlet of the channel. Figures 11(d–f) show that temperature variation is dependent more on the imposed pressure ratio than the inlet pressure, as the maximum variation in temperature is only 7 % for
 $\varepsilon$
= 4, and becomes negligible as the aspect ratio increases.
4.5.2. Behaviour of second-law variables
The second-law variables, including translational entropy and entropy generation, exhibit distinct variations along the channel centreline that reflect the complex interplay of pressure ratio, rarefaction and channel aspect ratio. These quantities, shown in figures 12 and 13, provide insight into the irreversible processes and the progression of molecular disorder within the flow field. Rotational entropy is omitted here because the working fluid is monatomic and thus has no rotational degrees of freedom.
The normalised translational entropy profiles in figures 12(a–c) show an increase with increasing pressure ratios at fixed inlet pressure, most pronounced in channels with a larger aspect ratio. This trend occurs because increasing the pressure ratio imposes a steeper streamwise pressure gradient, which in turn enhances the expansion and rarefaction along the channel. With a larger aspect ratio, the channel provides more room for spatial development of temperature and density gradients, leading to a greater spread in molecular velocities and positions. It should be noted that translational entropy, formulated in (3.15), is a general measure of molecular disorder for a given distribution function, and is not a direct indicator of how far the distribution deviates from equilibrium. As such, the observed increase in normalised entropy represents the cumulative effects of density drop and expansion through the channel, rather than an explicit diagnostic of local non-equilibrium.
In figures 12(d–f), where the inlet pressure is varied at a constant pressure ratio, the profiles show a similar increase in normalised translational entropy as the inlet pressure decreases (i.e. as the flow becomes more rarefied). However, unlike the pressure ratio cases, the effect of aspect ratio becomes negligible. This is a direct result of the strong rarefaction: at sufficiently high Knudsen numbers, the normalised thermodynamic state suppresses geometric amplification of gradients, and the local increase in entropy becomes a function of molecular expansion and rarefied flow statistics primarily, and remains nearly universal for different aspect ratios at fixed pressure drop ratio.
The normalised entropy generation profiles, shown in figures 13(a–c), show a progressive growth along the channel, intensifying with both pressure ratio and aspect ratio. Entropy generation computed using (3.16) is a functional of the local deviation from the Maxwellian distribution, and directly quantifies the rate of irreversible entropy production due to molecular collisions. Higher pressure gradients and larger aspect ratios amplify the departure from equilibrium, build up steeper velocity and temperature gradients, and inevitably lead to enhanced rates of entropy generation, especially towards the channel exit.
Figures 13(d–f) highlight the influence of inlet pressure at fixed pressure ratio for various aspect ratios. Unlike translational entropy, normalised entropy generation decreases as the inlet pressure is lowered and the flow enters the free-molecular regime. This trend is physically consistent: with fewer molecular collisions occurring in highly rarefied conditions, there will be reduced irreversible dissipation, even as the distribution function itself may become increasingly non-Maxwellian. Once again, normalisation by local thermodynamic quantities diminishes the visible effect of aspect ratio and leads to a collapse of entropy generation profiles across different channel geometries under similar rarefaction.
Taken together, these results suggest that while normalised translational entropy primarily reflects the level of flow expansion and does not inherently indicate the degree of non-equilibrium, normalised entropy generation serves as a robust indicator of the breakdown of equilibrium, being particularly sensitive to large gradients in the pressure-driven and wide channels. The distinction between these two measures is essential for accurately interpreting non-equilibrium thermodynamic behaviour in microscale and rarefied gas flows, and for developing and validating advanced kinetic and continuum models.
5. Conclusions and remarks
This study presented analytical solutions for cross-stream pressure and viscous stress profiles for pressure-driven microscale and rarefied Poiseuille gas flow inside channels, derived within the framework of the second-order NCCR model. The solution establishes for the first time a compact tangent function form of the cross-stream pressure and viscous stress profiles under arbitrary pressure gradients. It captures key rarefaction and geometric effects that remain inaccessible to classical first-order continuum theories. Targeted comparisons with high-fidelity DSMC simulations confirm the accuracy of the NCCR cross-stream pressure solution in the interior region of channels over representative combinations of Knudsen numbers, pressure ratios and aspect ratios (§ 4.1 and Appendix B), while the broader DSMC study in §§ 4.2–4.5 is devoted to analysing irreversible thermodynamic behaviour under pressure-driven rarefied conditions. The NCCR model correctly predicts the existence of convex cross-stream pressure distributions, and succinctly describes the intricate interplay between rarefaction, non-equilibrium stress and channel geometry.
As an additional useful result, for a given inlet or out condition and the length-to-height ratio of the channel, a new method was presented to calculate the pressure value at the centre of the channel from pressure or shear stress data experimentally measured at the channel walls. This was achieved by numerically solving the nonlinear ordinary differential equations (2.15) for the streamwise pressure distribution at the channel centre.
The study also provided new physical insights into the thermodynamics and transport characteristics of microscale and rarefied channel flows by analysing the spatial distributions of density, velocity, temperature, and higher-order non-conserved variables such as heat flux and viscous shear stress. In particular, the introduction of translational entropy and entropy generation illuminates the irreversible processes and molecular disorder underlying non-equilibrium behaviour. The computed translational entropy reflects the overall molecular disorder prompted by flow expansion and rarefaction, but is not an explicit indicator of proximity to equilibrium. In contrast, the spatially resolved entropy generation, directly derived from the local deviation from Maxwellian velocity distributions, robustly characterises the degree and localisation of non-equilibrium effects, especially under high pressure gradients and for large aspect ratios.
This study further quantified and clarified the mechanisms of non-Fourier heat transfer in simple, parallel-walled channels subjected to pure pressure driving, a phenomenon previously not fully characterised for such canonical geometries. The DSMC simulations showed that heat flows from the channel downstream towards the hotter upstream, reversing the classical direction of thermal conduction as
 $\textit{Kn}$
increases, but still satisfying the second law of thermodynamics through a positive definite nature of the total entropy production rate. This finding underscores the need for higher-order kinetic models and advanced entropy diagnostics when addressing microscale and rarefied gas transport.
The results reported here offer reference data for theoretical and computational studies of microscale and rarefied gas flows in confined geometries. The detailed mapping of pressure, entropy, and entropy generation will facilitate the development and validation of higher-order continuum and kinetic models for devices involving microscale and rarefied gases, and deepen our fundamental understanding of irreversible transport processes in non-equilibrium molecular gas flows. The presence of anomalous heat transfer highlights the importance of non-local and statistical treatments of energy transport at small scales, and motivates further experimental and theoretical investigations to uncover the rich physics of microscale and rarefied gas dynamics.
The findings of this study, spanning the analytical development of a closed-form pressure solution via NCCR theory and a detailed computational investigation of non-equilibrium thermodynamics using DSMC, point to several promising research directions.
This analytical study assumed that the streamwise evolution of centreline pressure is provided by external sources (such as DSMC or numerical data) to decouple cross-stream properties from the more complex streamwise dynamics. Consequently, a closed-form solution for the full streamwise coupling of pressure and velocity has not yet been achieved. It remains to be determined whether the current analytical strategy can be extended to resolve the centreline pressure independently. Thus a key objective for future research is to derive the streamwise evolution entirely within the NCCR framework, eliminating the reliance on external mid-plane data.
Another significant challenge remains in the highly rarefied regime, where the flow approaches the free-molecular regime. The present second-order NCCR framework is inherently tied to a moment-method closure that requires sufficient molecular collisions to sustain the moment hierarchy; as such, a direct extrapolation of analytical solutions based on the second-order moment closure to the free-molecular regime is not straightforward. Rather, the tangent-form solution and the associated physical mechanisms identified here are intended as a reference for future work, where rigorous asymptotic analysis or genuinely kinetic approaches will be needed to determine whether these structures degenerate gracefully or give way to qualitatively different behaviour in the free-molecular limit.
Building on the thermodynamic insights gained through the DSMC portion of this work, a detailed kinetic decomposition of molecular transport will be pursued. This will allow for the separation of ballistic and collisional contributions, further clarifying the mechanisms underlying the non-Fourier, cold-to-hot heat transfer and the associated cross-stream entropy transport observed in pressure-driven rarefied channels.
Furthermore, the analysis will be expanded from isothermal, monatomic gases to more realistic settings, including polyatomic gases with internal degrees of freedom, and generalised to complex three-dimensional geometries to assess how confinement and gas microstructure modulate the pressure curvature and entropy generation. Although computationally demanding, incorporating physical reservoirs at the inlet and outlet boundaries also represents a promising future direction to obviate the uncertainties inherent in simplified boundary conditions.
Ultimately, the analytical solution presented here serves as a theoretical stepping stone, demonstrating that second-order moment closures can capture qualitative features of thermal non-equilibrium such as convex pressure profiles. Transitioning towards full analytical or numerical solutions of the NCCR theory and the investigation of higher-order moments will be essential for the continued development of a unified description that remains robust from the continuum through the transition regime, with the free-molecular limit requiring dedicated kinetic treatments beyond the present closure.
Acknowledgements
This work was supported by a National Research Foundation of Korea grant (RS2024-00397400) funded by the Ministry of Science and ICT, Republic of Korea. The authors thank the reviewers of this article for their valuable and helpful comments.
Declaration of interests
The authors report no conflict of interest.
Appendix A. The DSMC code verification
A.1. Low Knudsen number verification against analytical solutions
For code verification, we compare our DSMC results with the approximate analytical Navier–Stokes solution of velocity and pressure distribution along microchannels subject to the velocity slip boundary condition for the plane microchannel geometry (Arkilic et al. Reference Arkilic, Schmidt and Breuer1997; Karniadakis et al. Reference Karniadakis, Beskok and Aluru2005):
 \begin{equation} \frac{u}{U_{C}}=\left[-\left(\frac{y}{H}\right)^{2}+\frac{y}{H}+\frac{{\textit{Kn}}}{1+{\textit{Kn}}}\right]\Big/\left[\frac{1}{4}+\frac{{\textit{Kn}}}{1+{\textit{Kn}}}\right]\!, \end{equation}

These solutions are believed to be valid up to moderate Knudsen numbers and pressure ratios. A case of a microchannel with height 1 µm and length 8 µm is considered. The wall temperature and inlet gas temperature are set to 300 K. The inlet pressure is set to 1.2 atm, and pressure ratio 2.4 is applied. This set-up would lead to Knudsen numbers varying from 0.044 to 0.11 alongside the channel.
Figures 14(a–c) plot the distributions of the streamwise velocity along the channel height in three different sections of the channel, 0.25L, 0.5L and 0.75L. The DSMC solutions agree well with the approximate analytical solution. Both solutions indicate an increase in the slip velocity on the walls in the streamwise direction due to rarefaction of the flow through the channel. Figure 14(d) plots the pressure distribution in the horizontal centreline of the channel. As expected, the analytical solution begins to deviate from the DSMC from upstream to downstream. To check the convergence of the solution, the mass flow rate of upstream and downstream,
 $\dot{m}=\int_{0}^{H}\rho u\,{\rm d}y/H$
, is plotted for each step. The convergence criterion is set as the equality of these two quantities. Figures 15 plots the convergence behaviour for the verification test case. It can be seen that the solution has converged after 80 000 print cycles, which corresponds to a sample number of the order of 106.
Comparison of DSMC results with NSF analytical solutions.

Figure 14. Long description
The image contains four subplots labeled (a), (b), (c), and (d), each depicting a line graph. Subplots (a), (b), and (c) show the normalized velocity (u/Uc) profiles at different streamwise positions (x/L = 0.25, 0.5, and 0.75) across the channel height (y/H). The solid lines represent analytical solutions, while the circles represent DSMC results. Subplot (d) displays the normalized pressure (p/Pout) profile along the channel length (x/L) at a fixed position (y/L = 0.5). The solid line represents the analytical solution, and the circles represent DSMC results. The graphs illustrate the comparison between DSMC results and NSF analytical solutions for velocity and pressure profiles in microchannels. All values are approximated.
Convergence history in mass flow rate.

Figure 15. Long description
A line graph showing the convergence history in mass flow rate with upstream and downstream data over print cycles. The x-axis represents the print cycle ranging from 0 to 80,000, and the y-axis represents the mass flow rate in kilograms per meter per second, ranging from 0 to 200. The solid line represents the upstream data, which starts at approximately 160 kilograms per meter per second and quickly stabilizes around 60 kilograms per meter per second. The dashed line represents the downstream data, which starts at approximately 140 kilograms per meter per second and also stabilizes around 60 kilograms per meter per second. Both lines converge and remain stable around 60 kilograms per meter per second after the initial print cycles. All values are approximated.
A.2. Verification against high-Knudsen reference data
To provide additional verification of the present DSMC code for highly rarefied conditions (
 $\textit{Kn} \gt 1$
) relevant to the main study, we conducted supplementary simulations of pressure-driven Poiseuille flow in a rectangular microchannel and compared them against the recent reference DSMC solutions of Ravichandir & Alam (Reference Rojas-Cárdenas, Graur, Perrier and Méolans2024).
Four test cases spanning the rarefied flow spectrum were simulated (
 $\textit{Kn} = 0.05, 0.5, 5, 50 $
). The channel geometry and thermodynamic conditions were chosen to replicate the Ravichandir & Alam (Reference Rojas-Cárdenas, Graur, Perrier and Méolans2024) set-up. All simulations employed the same VHS molecular model and no time counter collision dynamics as the main study to ensure consistency. The Knudsen number was varied by adjusting the inlet pressure while maintaining constant channel width and wall temperature.
All flow properties are presented in dimensionless form using the reference scales employed by Ravichandir & Alam (Reference Rojas-Cárdenas, Graur, Perrier and Méolans2024): ρ
0 = ρav
(average density at inlet), T
0 = Tw
= 282 K (wall temperature),
 $u_{0}=\sqrt{2k_{B}T_{0}/m}$
(thermal speed at wall temperature), p
0 = (p
+ + p
−)
 $/2$
= ρavu
0
2 (mean pressure).
Lengths are normalised by the channel width Ly
such that the streamwise and wall-normal coordinates span −1.5 ≤ x/Ly
≤ 1.5 and −0.5 ≤ y/Ly
≤ 0.5, respectively. These scalings enable direct quantitative comparison across the full Knudsen number range studied. Figure 16 presents normalised mass flux profiles along the channel middle line and centreline direction for all four cases. The symbols (circles) represent the present DSMC results, while solid lines denote the reference solutions. Good agreement is observed across the full Knudsen range (
 $\textit{Kn} = 0.05$
–50), confirming the accuracy of the present DSMC implementation for both continuum and free-molecular limits. A slight underprediction of mass flux is observed at low Knudsen numbers (
 $\textit{Kn} \lt 1 $
), while modest overprediction occurs in the free-molecular limit (
 $\textit{Kn} \gt 5 $
) near the channel exit. These discrepancies likely reflect subtle differences in boundary condition implementation, and differing particle weighting and collision sampling strategies between the two codes.
Variations of (a) ρ(0, y) u
x
(0, y) at x = 0 and (b) ρ(x, 0) u
x
(x, 0) at y = 0 for different values of
 $\textit{Kn}$
. Symbols represent present DSMC results; solid lines show reference data from Ravichandir & Alam (Reference Rojas-Cárdenas, Graur, Perrier and Méolans2024).

Figure 16. Long description
A two line graph showing variations of (0, y) ux(0, y) at x = 0 and (x, 0) ux(x, 0) at y = 0 for different values of Kn. The x axis ranges from negative 0.5 to 0.5 and the y axis ranges from 0.2 to 0.6. The x axis ranges from negative 1.5 to 1.5 and the y axis ranges from 0.2 to 0.6. Symbols represent present DSMC results; solid lines show reference data from Ravichandir & Alam (2024).
Appendix B. Quantification of the NCCR pressure solution error with respect to the DSMC solution
To thoroughly investigate the source of the discrepancy between NCCR and DSMC solutions at the channel exit, a systematic error analysis of the NCCR pressure solution was conducted across three aspect ratios (
 $\varepsilon$
= 4, 8, 16) and two pressure ratios (
 $\tilde{P}$
= 2.5, 10), as illustrated in figure 17. Visual inspection demonstrates that the NCCR solution deviates most from DSMC at small aspect ratios and large pressure ratios. However, accuracy improves significantly as the aspect ratio increases; for
 $\varepsilon$
= 16, the closed-form NCCR solution is nearly identical to the DSMC reference even at high pressure ratio 10.
Comparison of NCCR pressure solutions with NSF and DSMC contours.

Figure 17. Long description
The line graph compares NCCR pressure solutions with NSF and DSMC contours for different aspect ratios and pressure ratios. The graph is divided into two sections, labeled (a) and (b). Section (a) shows data for a pressure ratio of 2.5, while section (b) shows data for a pressure ratio of 10. Each section contains three subplots for aspect ratios of 4, 8, and 16. The DSMC data is represented by solid blue lines, the NSF data by dashed black lines, and the NCCR data by solid black lines. The x-axis represents the length of the channel, and the y-axis represents the height of the channel. All values are approximated.
These observations are quantified using the relative L
2 norm (figure 18). The analysis reveals that NCCR accuracy is critically dependent on the coupling of the aspect ratio and pressure ratio. A pronounced worst-case scenario occurs at the combination of low aspect ratio and high pressure ratio. In the best-case scenario (
 $\tilde{P}$
= 2.5,
 $\varepsilon$
= 16), the NCCR solution demonstrates exceptional fidelity with L
2,
rel
value 0.001052. In contrast, for the high pressure ratio and low aspect ratio case (
 $\tilde{P}$
= 10,
 $\varepsilon$
= 4), the error degrades to L
2,
rel
= 0.033261, representing a 31.6 times increase in error relative to the best case. Intermediate cases, such as
 $\tilde{P}$
= 10,
 $\varepsilon$
= 8 (L
2,rel
= 0.00702), fall between these extremes but remain notably less accurate than comparable low pressure ratio cases (
 $\tilde{P}$
= 2.5,
 $\varepsilon$
= 8; L
2,
rel
= 0.002109).
Relative L
2 norms of NSF and NCCR solutions as functions of aspect ratio (
 $\varepsilon$
= 4, 8, 16) and pressure ratio (
 $\tilde{P}$
= 2.5, 10). Results demonstrate aspect ratio as the primary determinant of model accuracy near the channel exit.

Figure 18. Long description
The bar graph compares the relative L2 norms of NSF and NCCR solutions for different aspect ratios and pressure ratios. The x-axis represents different combinations of aspect ratio and pressure ratio, while the y-axis represents the relative L2 norms. There are two sets of bars for each combination, one for NSF (in blue) and one for NCCR (in gray). The first set of bars corresponds to a pressure ratio of 2.5 with aspect ratios of 4, 8, and 16. The second set of bars corresponds to a pressure ratio of 10 with the same aspect ratios. The NSF bars are consistently higher than the NCCR bars across all combinations. The highest values are observed for the pressure ratio of 2.5 and aspect ratio of 16. All values are approximated.
Relative L
2 error of the pressure field as a function of the channel aspect ratio
 $\varepsilon$
for different inlet pressures Pin
. Results are shown for Pin
= 1, 0.1, 0.05, 0.01 atm. The error decreases monotonically with increasing
 $\varepsilon$
, while higher inlet rarefaction levels (lower P
in
) lead to larger discrepancies.

Figure 19. Long description
The bar graph compares the relative L2 error of the pressure field as a function of the channel aspect ratio for different inlet pressures. The x-axis represents the inlet pressure (Pin) values of 1, 0.1, 0.05, and 0.01 atmospheres. The y-axis represents the relative L2 error (L2,rel) ranging from 0 to 0.01. The graph features three sets of bars, each representing different aspect ratios (ε = 4, ε = 8, ε = 16) in distinct colors: blue for ε = 4, gray for ε = 8, and light blue for ε = 16. For each inlet pressure, the error decreases as the aspect ratio increases. Higher inlet rarefaction levels (lower Pin) lead to larger discrepancies in the error. The data shows a clear trend where the error decreases monotonically with increasing aspect ratio, and higher inlet pressures result in smaller errors. All values are approximated.
This quantitative analysis identifies the aspect ratio as the dominant parameter controlling NCCR accuracy. At a fixed aspect ratio, increasing the pressure ratio from 2.5 to 10 causes a degradation that scales inversely with geometric size: error increases by 6.2 times at
 $\varepsilon$
= 4, 3.3 times at
 $\varepsilon$
= 8, and a negligible 1.15 times at
 $\varepsilon$
= 16. Conversely, holding the pressure ratio constant while increasing the aspect ratio from 4 to 16 yields error reductions of 5.1 times at
 $\tilde{P}$
= 2.5, and a significant 27.5 times at
 $\tilde{P}$
= 10. Most tellingly, at
 $\varepsilon$
= 16 and
 $\tilde{P}$
= 10, the NCCR achieves L
2,
rel
= 0.001206, nearly identical to the low-pressure case at the same aspect ratio. This demonstrates that adequate geometric length effectively suppresses pressure-induced accuracy degradation.
The dominance of the aspect ratio is further highlighted by comparing error reduction pathways. Increasing the aspect ratio from 4 to 16 at high pressure yields a 27.5 times error reduction – more than four times the magnitude of the maximum pressure-induced degradation (6.2 times). Furthermore, the improvement associated with the aspect ratio is monotonic across all regimes, whereas pressure effects vanish entirely as
 $\varepsilon$
increases. These findings unequivocally establish the geometric configuration as the primary determinant of NCCR validity, with thermodynamic conditions playing only a secondary role that becomes suppressed when geometric constraints are relaxed. This suggests that the observed deviations are not a fundamental failure of the NCCR formulation, but rather a consequence of the severe constraints imposed by the outlet boundary condition at low aspect ratios.
Furthermore, a quantitative assessment of the streamwise extent of the regions affected by inlet and outlet conditions in the DSMC simulations was performed. As illustrated in figure 19, this analysis is based on the streamwise evolution of the pressure field and the relative error between the NCCR and DSMC solutions for fixed pressure ratio 2.5, with inlet pressures ranging from 1 atm down to 0.01 atm at three different aspect ratios. Consistent with expectations, the global relative L 2 error increases across all aspect ratios as the Knudsen number increases, reflecting the growing influence of rarefaction on the solution accuracy.
Figure 20 presents the local relative error of the NCCR with respect to the DSMC solution for cases 13–24 in table 2, which include the largest outlet Knudsen numbers considered. The error is evaluated at a streamwise section near the channel walls, where the deviations are most pronounced. As shown in the figure, channels with small aspect ratios are more strongly affected by inlet/outlet boundary conditions. For aspect ratio 4, approximately 15 % of the channel length near both the inlet and outlet exhibits errors larger than the average interior value. As the aspect ratio increases, the overall error decreases, and the boundary-affected regions become shorter. Specifically, for aspect ratio 8, the entrance and exit regions are reduced to less than 10 % of the channel length, and for aspect ratio 16, they are reduced to less than 5 %.
Streamwise distribution of the relative pressure error between the NCCR and DSMC solutions near the channel walls, where deviations between the two solutions are most pronounced.

Figure 20. Long description
The line graph presents the streamwise distribution of the relative pressure error between the NCCR and DSMC solutions near the channel walls. The x-axis represents the normalized streamwise position (x divided by L), ranging from 0 to 1. The y-axis represents the relative pressure error (L 2 rel), ranging from 0 to 0.1. The graph includes four data lines corresponding to different inlet pressures: 0.01 atmosphere (black line), 0.05 atmosphere (red line), 0.1 atmosphere (blue line), and 1 atmosphere (magenta line). The data lines show variations in the relative pressure error across the streamwise position for each inlet pressure. All values are approximated.
This quantitative assessment allows us to distinguish discrepancies associated with entrance and exit effects from those arising in the interior region, thereby reducing the likelihood of attributing flow-development effects to modelling errors.

 p(y∗)/p(0)
 εh=0.6
 Kn=0.1

 ε
 P~
 ε
 ε
 P~

 ε
 P~=10(0.053⩽Kn⩽0.529

 P~
 ε
 0.044⩽Kn⩽0.11

 (Kn=kBTw/2πd2pL)

 ε
 P~
 ∇T

 ε
 P~
 Kn

 ε
 P~
 (F)
 (P)

 x=7L/8
 pu/H
 Φ
 p∇⋅u
 ρu⋅∇e
 ∇⋅Q
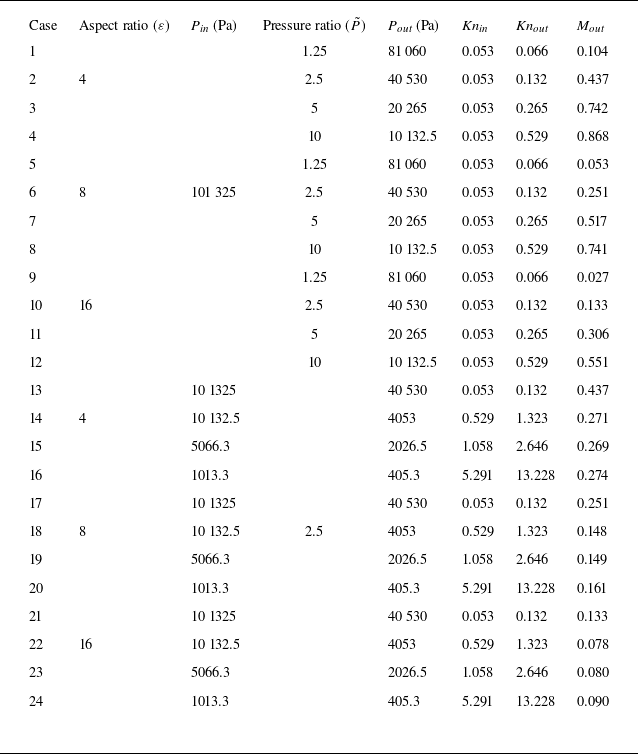

 P~
 ε
 P~

 P~
 ε
 P~

 P~
 ε
 P~
 ε
 ε

 P~
 ε
 P~

 P~
 Kn


 Kn


 ε
 P~

 ε
 ε



