I. INTRODUCTION
The results of a predominantly experimental investigation of nanoindentation deformation and cracking of gallium arsenide (GaAs) single crystals are reported in two parent papers. The present paper (part I) addresses the morphology of the crack field in the indentation region using two techniques:
(i) in situ nanoindentation in a scanning electron microscope (SEM) with an instrumented loading device;
(ii) controlled cleavage techniques to obtain cross-sections through the indentation region and reveal the subsurface crack field.
The second parent paper (part II)Reference Wasmer, Pouvreau, Breguet, Michler, Schulz and Giovanola1 investigates the deformation in the indentation region using cathodoluminescence and transmission electron microscopy and attempts to relate the observed dislocation structure and the mapped crack field.
The industrial production of GaAs laser diodes provides the motivation for this investigation. One of the critical steps in processing GaAs wafers is the dicing operation during which a whole wafer is separated into single devices. Many ways to achieve this separation are available on the market, but the more common one is the scribe and break method, where the wafer surface is first scratched with a diamond tool to produce an initial starter crack and subsequently cleaved along preferential crystallographic planes.Reference Scannell and Smith2–4 The main drawback of this technique is the generation of many undesirable particles during scratching.Reference Wasmer, Ballif, Gassilloud, Pouvreau, Rabe, Michler, Breguet, Solletti, Karimi and Schulz5–Reference Wasmer, Ballif, Pouvreau, Schulz and Michler7 In addition, chevron cracks extending behind the scratch path can cause chipping during the cleavage step. An alternative solution to this problem consists in replacing the scratch by a single nanoindentation with a diamond tool of appropriate geometry.Reference Pouvreau, Wasmer, Giovanola, Breguet, Michler, Karimi and Gdoutos8 In this approach, understanding and controlling the crack initiation and propagation process during nanoindentation is of the utmost importance because the quality of the laser's active surface obtained by subsequent cleavage strongly depends on the morphology and size of the starter crack.Reference Wasmer, Ballif, Pouvreau, Schulz and Michler6,Reference Wasmer, Ballif, Pouvreau, Schulz and Michler7
This and the parent paper therefore investigate the mechanics of crystal deformation, as well as crack initiation and propagation in GaAs single crystal wafers during nanoindentation. Section II of this paper describes the experimental techniques applied. Section III reports on the results and observations made for conical and wedge indenters of 60 and 120° opening angle. These results are discussed and interpreted in Sec. IV, with the help of classical linear elastic fracture mechanics concepts, in terms of crack nucleation conditions (pop-in), crack extension kinetics, crack field morphology, and material fracture toughness. Section V resumes the main findings of the investigation.
II. MATERIAL AND EXPERIMENTAL PROCEDURES
In this work, we investigated two types of commercially available GaAs wafers with different thicknesses (150 μm or 350 μm). Both types were Si-doped (doping level: 1 to 2 × 10⁻¹⁸ cm−3 Si atoms) and electrochemically polished on the indented surface, the (001) plane. Specimens cut into 150-μm wafers were used for conical nanoindentations to obtain observable cross-sections. With the wedge indenters, cross-sections could be easily obtained for wafer thicknesses up to 350 μm.
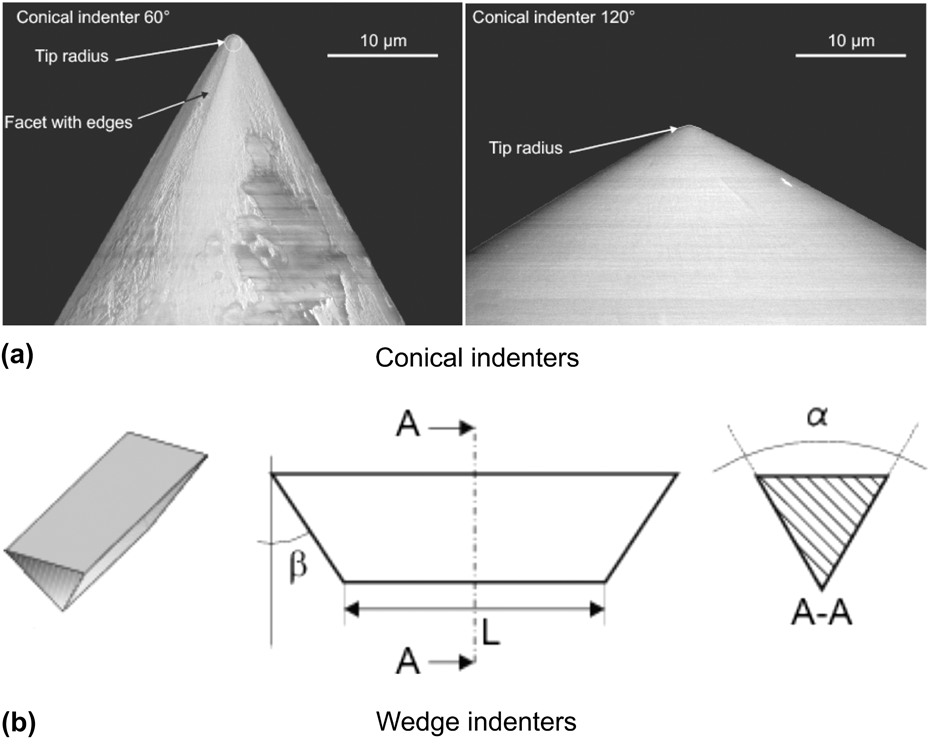
Experiments were performed using two indenter shapes: wedge or conical indenters, each type having 60° or 120° apex angle (see Fig. 1). These geometries were chosen to investigate the influence of plane strain (wedge) and axisymmetric (conical) stress fields on the crack field morphology. Because of the strong anisotropy of diamond crystals, it is not possible to obtain perfectly axisymmetric conical indenters, and evidence of this is shown in Fig. 1(a). For that reason, rounded edges are observed on the scanning electron microscopy micrographs presented in the following sections. The two wedge indenters have a length of 55 μm, and their end faces make an angle of 60° with respect to the main edge as illustrated in Fig. 1(b).
Geometry of the different indenters used in this work. (a) SEM pictures of conical indenters and (b) schematic of wedge 60° indenter.

We applied two novel experimental techniques developed at Empa-Thun and Ecole Polytechnique Fédérale de Lausanne (EPFL) to obtain reliable load, crack morphology (size and geometry), and cracking kinetics data: (i) in situ nanoindentation in the SEM while continuously recording the indentation load and displacement and (ii) cross-sectioning at specific locations of the indentation zones by means of a controlled cleavage technique.
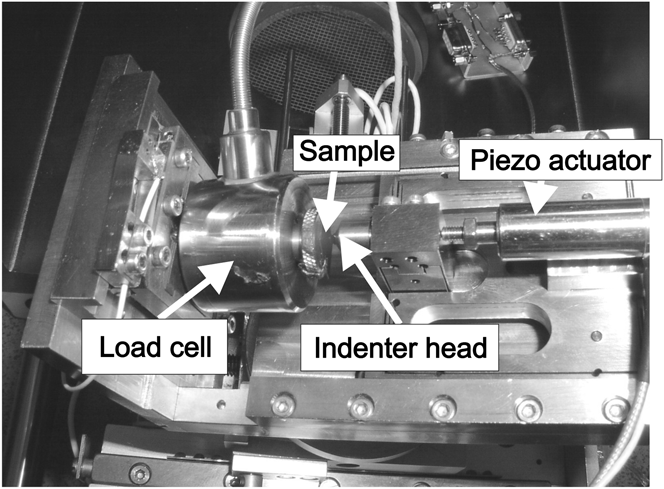
The first technique, described by Rabe et al.Reference Rabe, Breguet, Schwaller, Stauss, Haug, Patscheider and Michler9 serves to establish the cracking kinetics by correlating surface cracking observations with load–displacement histories. Experiments were carried out in a Zeiss DSM 962 SEM (Carl Zeiss International, Oberkochen, Germany) operating at 10 kV. The setup is presented in Fig. 2.
In situ SEM nanoindentation setup.
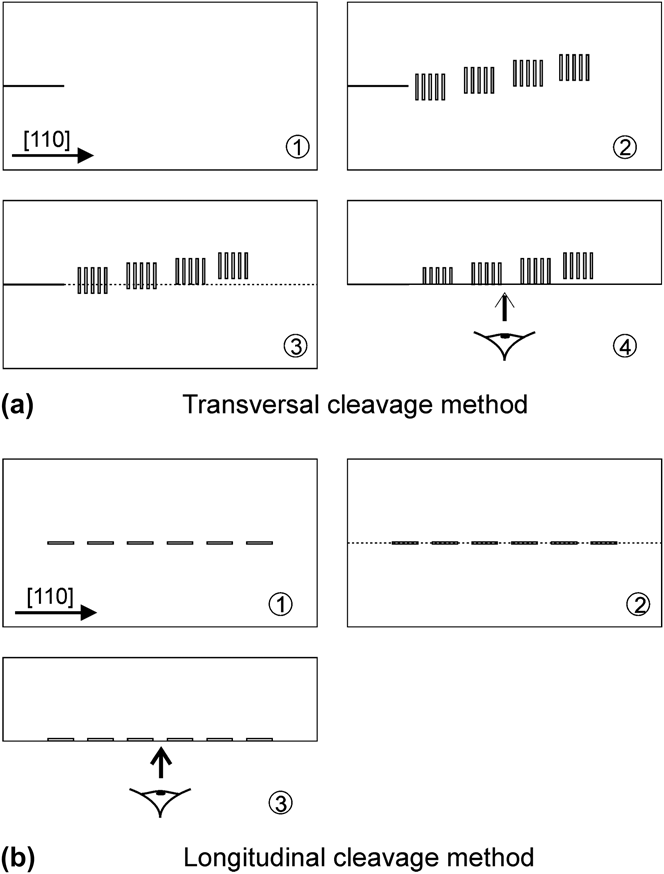
The second technique was adapted from experimental techniques often used in fractography to analyze cracks in different types of materials.Reference Lawn10 It serves to determine accurately the shapes, orientations, and sizes of subsurface indentation cracks. In this technique, illustrated in Fig. 3(a), a starter crack is generated by scratching the sample along the [110] direction with a manual scratching tool. Then, five series of five indents with a wedge indenter were made with a Nanoindenter XP at a given load level. Each series of nanoindentations is shifted by 5 μm (in a direction perpendicular to the [110] direction) with respect to the preceding series to get cross-sections at different positions in the indentation zone. Prior to cleavage, the indented surface is observed with the help of a Hitachi S-4800 SEM (Hitachi High Tech, Tokyo, Japan) field emission gun (FEG) operated at 2 kV to map and characterize indents. Finally, the starter crack is propagated through the whole set of indents with a specially designed cleaving device. The cleaved surfaces can then be observed in the SEM and the crack morphology and dimensions characterized. We applied the cross-sectioning technique by cleavage to wedge nanoindentations. Indeed, for point indenters such as the conical one, control of the position of nanoindentations with respect to the cleavage initiation scratch is not precise enough to allow reliable staggered cross-sections. In addition, the indentation zone is quite small, and the propagation of the cleavage crack through the damaged regions strongly disturbs its morphology. We also adapted the cleavage technique discussed here to reveal the shape of the median or half-penny shaped crack by cleaving along a series of aligned nanoindentations as illustrated in Fig. 3(b).
Schematic of the cleavage cross-sectioning techniques. (a) transversal cleavage method and (b) longitudinal cleavage method.
III. RESULTS
A. Conical indenter 60°
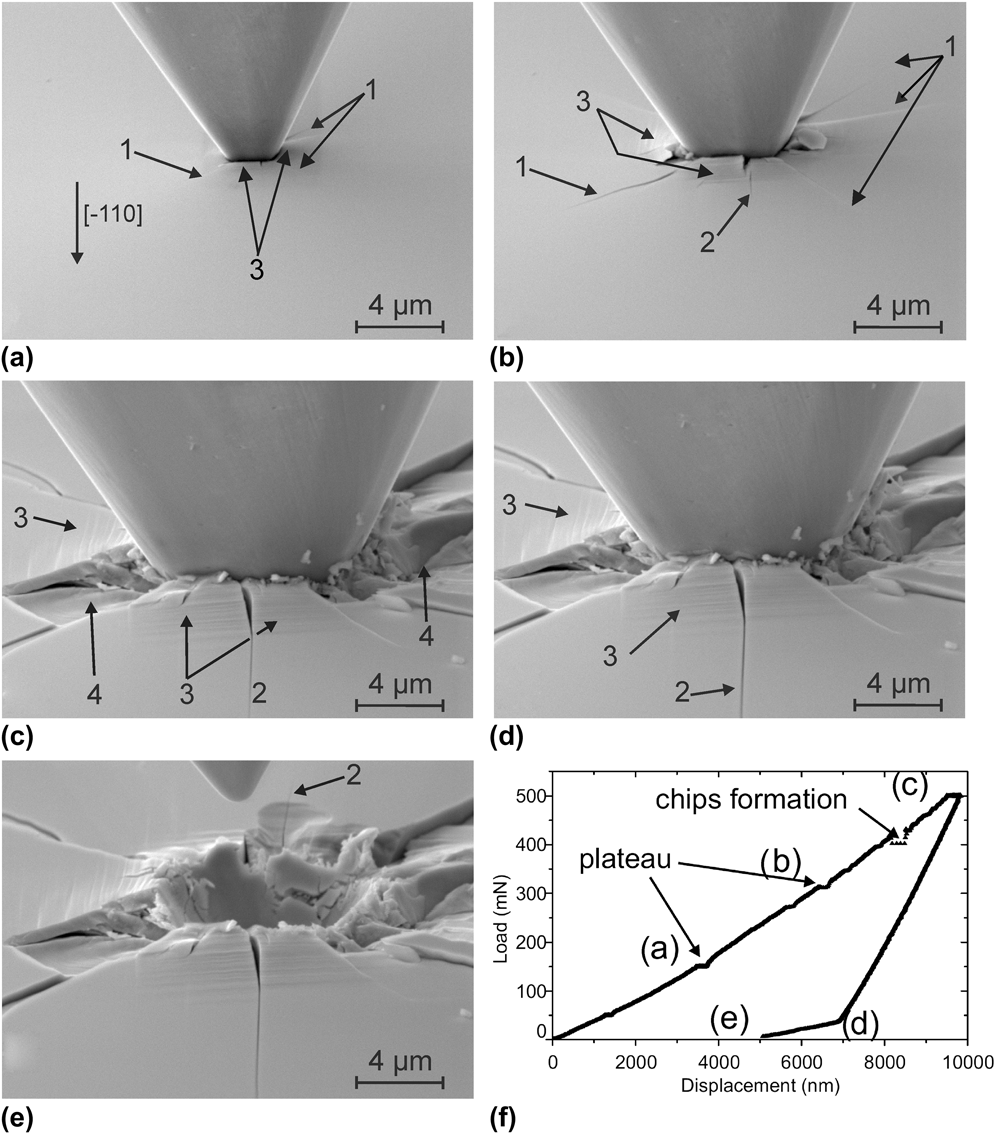
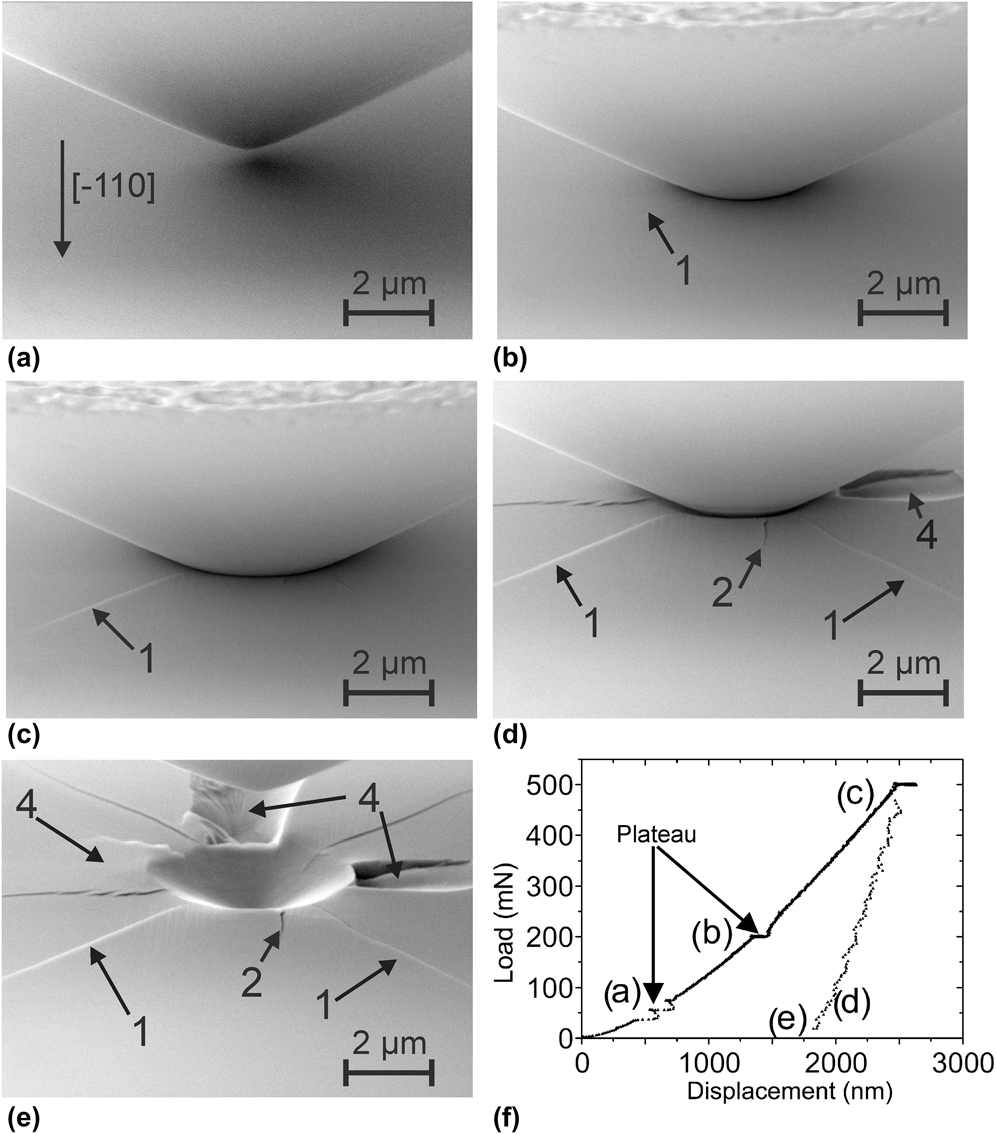
Figure 4 shows scanning electron microscopy micrographs of an in situ nanoindentation made with the conical indenter having a 60° apex angle and the corresponding load–displacement curve. The curve is corrected with a simple compliance correction method (see Reference RabeRef. 11 for details). The maximum load used was 500 mN, and the experiment was interrupted at different points to take pictures. During the loading-hold period, we observed small displacement increases on the loading curve [horizontal segments, e.g., at points (a) and (b) in Fig. 4(f)]. As chips separate from the surface, we noticed a sudden drop of the load at (c), and the chips are visible in Fig. 4(c) taken at the maximal load.
Series of micrographs of an in situ nanoindentation showing the cracking sequence for the conical 60° indenter at different loads: (a) loading at 150 mN, (b) loading at 300 mN, (c) full load at 500 mN, (d) unloading at 50 mN, (e) full unload and indenter withdrawn, and (f) corresponding load–displacement curve. Arrows (1) and (2) point to radial cracks, arrow (3) to slip lines, and arrow (4) points to chips.
In these in situ experiments, we observed the following cracking sequence:
(i) nucleation of a first set of radial cracks (1) aligned with either [100] or [010] directions in the early stage of loading. These cracks are also defined as Palmqvist cracks;
(ii) shortly thereafter, nucleation of a second set of radial cracks (2) aligned with the [110] or [
 $\overline {\rm{1}}$10] directions and growth of the first set. These crack are defined as half-penny cracks;
(iii) subsequently, chip formation (4) takes place at the surface either during loading [Fig. 4(c)] or unloading.

Slip bands (3) are visible “outside” the indentation imprint. Their orientation coincides with traces of {111} planes, an observation consistent with previous observations.Reference Lefebvre, Androussi and Vanderschaeve12–Reference Parlinska-Wojtan, Wasmer, Tharian and Michler17 For this indenter, we identified four activated slip planes [Figs. 4(c)–4(e)].
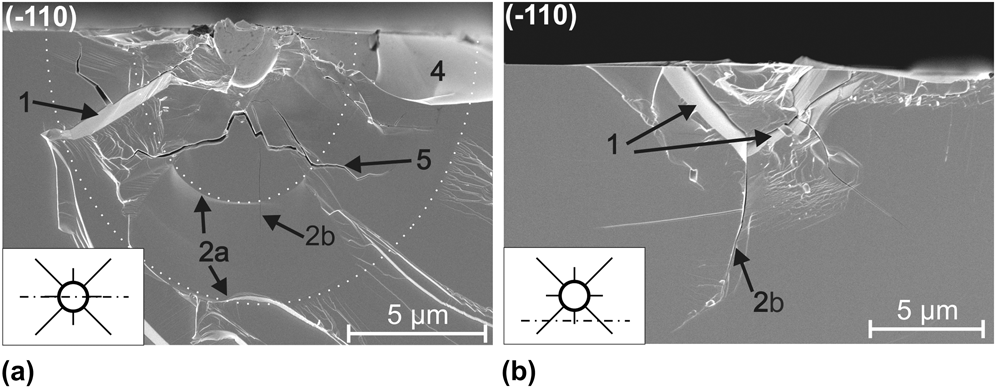
The subsequent cross-sectioning of nanoindentations provides more information about the crack field beneath the surface. Figure 5 presents cross-sections of indentation zones produced by the conical 60° indenter loaded in three steps to a maximum load of 200 mN. This maximum load was chosen to avoid excessive damage. The insets in Fig. 5 indicate the position of the cut with respect to the nanoindentation. Two distinct crack fronts labeled (2a) are highlighted in Fig. 5(a). These crack arrest lines delineate the crack jump when the load is increased from one load level to the next higher one. The label (2b) in Fig. 5 designates the very faint trace of a second half-penny crack system perpendicular to the cleaved surface. A system of deep lateral cracks labeled (5) propagates a few hundred nanometers below the surface. Additionally, chips (4), formed from the interaction of a shallower lateral crack and the surface, are on the verge of breaking off.
Cross-sections of conical 60° nanoindentations: (a) in the middle of the residual imprint, (b) outside the residual imprint. Dotted curves underline the different crack arrest fronts.
It is evident from Fig. 5(b) that traces of cracks (1) are not perpendicular to the indented surface. The angle was measured to be about 45° with the (001) indentation surface. Combining surface observations with cleavage cross-sections, we deduce that these radial cracks (1) are developing in (10 $\overline {\rm{1}}$) and (
 $\overline {\rm{1}}$01) planes and cracks (2) are developing in (110) and (
 $\overline {\rm{1}}$10) planes.
B. Conical indenter 120°
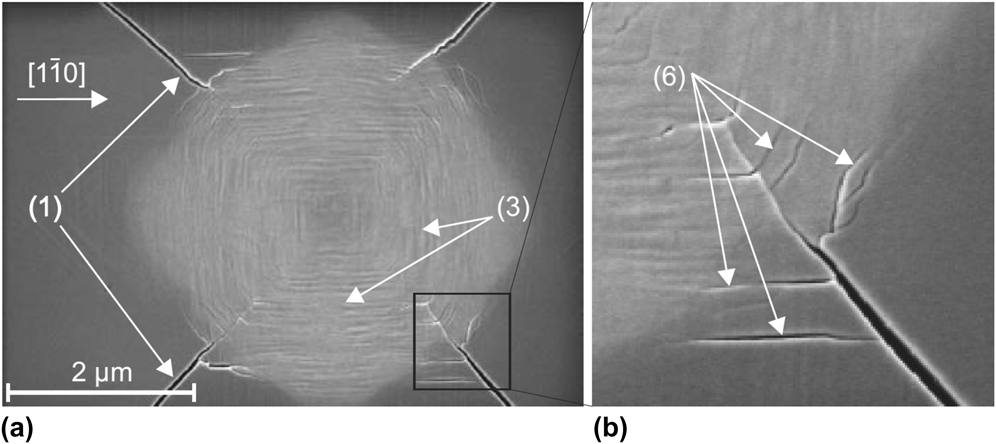
An in situ nanoindentation made with the conical indenter having a 120° apex angle is presented in Fig. 6. Radial cracks (1) and (2) emanate from the imprint and grow during load application. Chipping (4) is observed during the unloading [Figs. 6(d) and 6(e)] and appears to be dependent on the loading/unloading rate. At the surface, post nanoindentation observations reveal that the largest cracks (1) initiate at the crossing of slip bands (3) located “inside” the residual imprint as can be seen in Fig. 7. The magnified view shows the presence of small microcracks (6) inside and outside the residual imprint, possibly initiating along the {111} slip planes.
Series of micrographs of an in situ nanoindentation showing the cracking sequence for the 120° conical indenter at different loads: (a) loading at 50 mN, (b) loading at 200 mN, (c) full load at 500 mN, (d) unloading at 50 mN, (e) full unload and indenter withdrawn, and (f) corresponding load–displacement curve. Arrows (1) and (2) indicate radial cracks; arrow (4) shows chips.
Scanning electron microscopy micrographs showing: (a) the residual imprint of a nanoindentation with the conical 120° indenter at a maximum load of 200 mN and (b) a magnified view showing cracks (6) initiating at the intersection of slip bands.
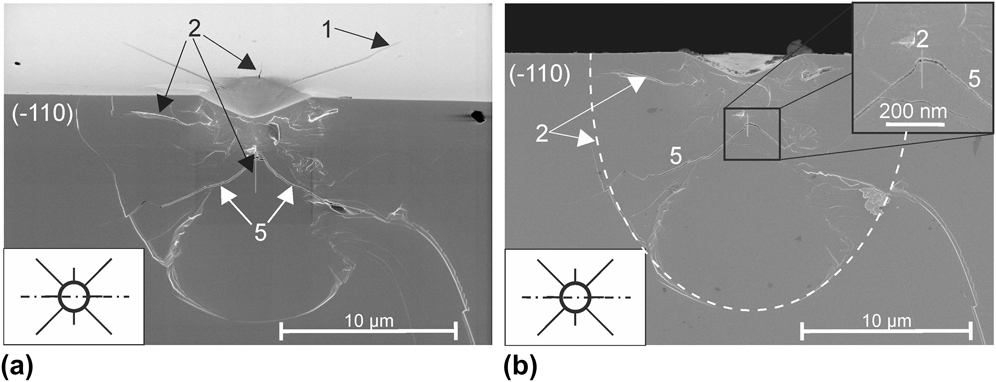
The cross-section of a nanoindentation with the 120° conical indenter (Fig. 8) reveals a complicated network of cracks below the surface. Visible radial cracks (2) initiate a few microns under the surface (about 2 μm) and propagate in (110) and ( $\overline {\rm{1}}$10) planes. In other cases, when these cracks (2) are not visible, a set of lateral cracks (5) propagating in a {112} family of planes meet under the apex of the imprint, and a network of small microcracks joins both lateral crack branches [see inset in Fig. 8(b)]. This crack field is somewhat similar to cone cracks generally observed during indentation.Reference Lawn10 However, as GaAs is strongly anisotropic with preferential cracking planes, cracks cannot be perfectly conical. Moreover, these cracks do not extend to and at the surface.
Cross-sections of the conical 120° nanoindentation: (a) indented and cleaved surfaces, (b) only the cleaved surface.
C. Wedge indenters 60°
Figure 9 presents a series of pictures taken at different stages of the loading–unloading cycle for a nanoindentation with the 60° wedge indenter. Because of the length of the indenter, only one extremity is observed during in situ experiments, so that sufficient details of the formation of cracks can be obtained. In this experiment, the main edge of the indenter was aligned with the [ $\overline {\rm{1}}$10] direction.
Series of micrographs of an in situ nanoindentation showing the cracking sequence for the 60° wedge indenter at different loads: (a) half loading at 250 mN, shortly after the pop-in event, (b) full load at 500 mN, (c) half unloading at 250 mN, (d) full unload, (e) indenter withdrawn, and (f) typical load–displacement curve.
The observed cracking sequence is generally as follows:
(i) in the early stage of the loading, surface traces of {111} slip bands, highlighted with thin lines in Fig. 9(a), appear on each side of the indentation site (3);
(ii) shallow Palmqvist cracks (1) extend at the surface during the early stage of loading. These cracks follow mainly <100> or <130> directions;
(iii) subsequently, a half-penny crack (2) nucleates in the <110> direction aligned with the main edge of the indenter;
(iv) when the maximum load is limited to 500 mN or less, limited chipping-out (4) takes place during unloading. Chips form mainly between the half-penny and the different Palmqvist crack systems.
The order of apparition of Palmqvist and half-penny cracks can sometimes be inverted. Traces of slip planes are visible on each side of the nanoindentation outside the imprint. The load–displacement curve presented in Fig. 9(f) exhibits a “pop-in” during the loading cycle. This pop-in was correlated with the breakthrough of the half-penny crack at the indentation surface. The nature of this process is discussed in more detail later in the paper.
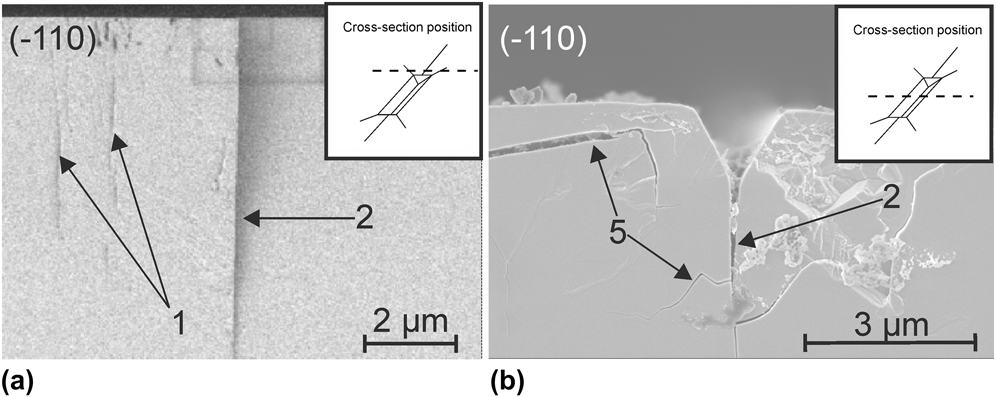
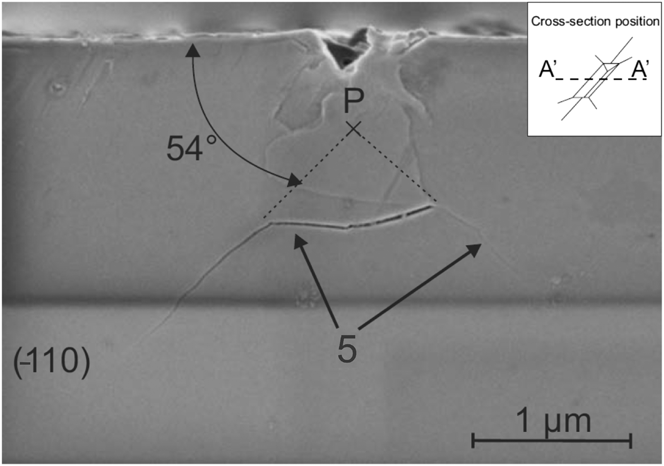
The nanoindentation cross-sections shown in Fig. 10 confirm that Palmqvist cracks (1) are shallow and form only at the indenter extremities, whereas the half-penny crack (2) propagates deeply into the crystal and extends along the whole length of the indentation. Lateral cracks (5) are present at varying depths. At loads lower than the pop-in seen in the nanoindentation curve of Fig. 9, no half-penny cracks were observed under the surface, as demonstrated by Fig. 11. Instead, lateral cracks (5) are visible that extend in (111) and ( $\overline {\rm{1}} $$$$\overline {\rm{1}}$1) planes. For nanoindentation tests performed at higher loads, these lateral cracks are not observed, which suggests that they form during unloading and only if no half-penny crack is initiated and propagated to relax some of the indentation residual stresses. The correlation between pop-in load and the appearance or not of lateral cracks indicates that the pop-in in the indentation curve corresponds to the indenter displacement associated with the initiation and rapid extension of the half-penny crack. In situ nanoindentation experiments confirm this interpretation. Indeed, the observed crack breakthrough to the surface correlates with the plateau (or pop-in) in the indentation curve.
Cross-sections through nanoindentation zones produced with the 60° wedge indenter for a maximum load of 500 mN: (a) at the extremity of the wedge, outside the residual imprint and (b) in the middle of the nanoindentation. The insets indicate the position of the cross-section with respect to the imprint.
Cross-section through the middle of a nanoindentation zone produced with the 60° wedge indenter for a maximum load of 200 mN.
D. Wedge indenters 120°
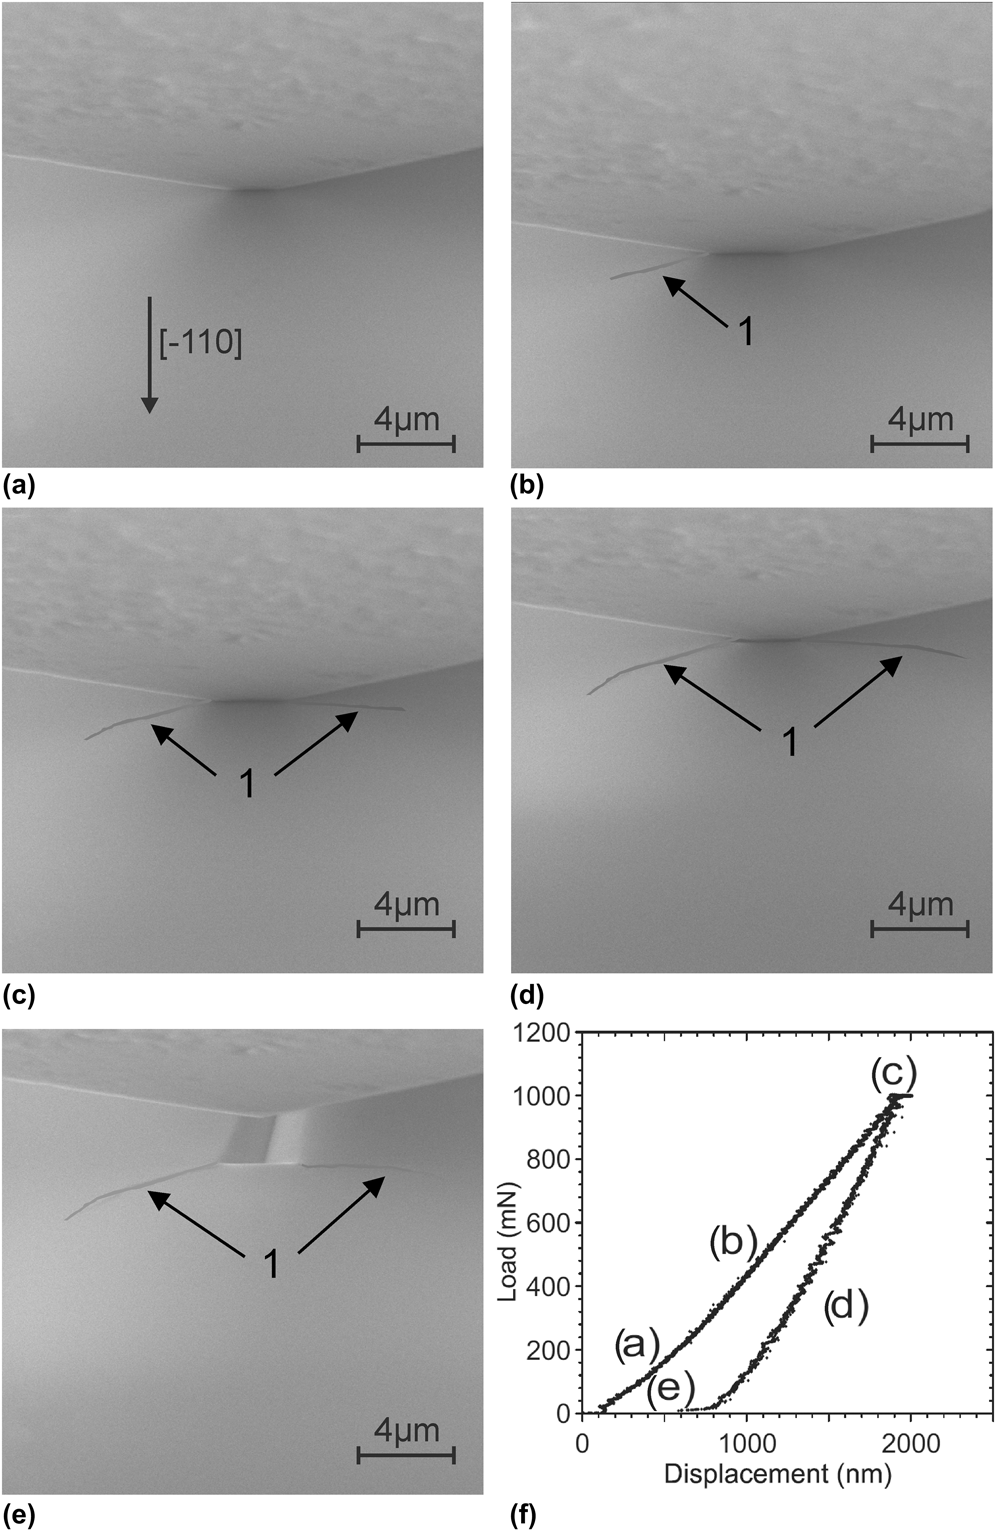
Figure 12 shows a series of micrographs taken during an in situ nanoindentation experiment and its corresponding curve for the 120° wedge indenter. Note that a maximum load of 1 N was necessary to induce crack initiation. Only a few Palmqvist cracks (1) form at the corners of the indentation imprint during loading. Cracking directions are the same as those observed for the 60° wedge indenter. Chipping-out is rarely observed even at loads as high as 1.5 N.
Series of micrographs of an in situ nanoindentation showing the cracking sequence for the 120° wedge indenter at different loads: (a) loading at 200 mN, (b) half loading at 500 mN, (c) full load at 1 N, (d) half unloading at 500 mN, (e) full unload and indenter withdrawn, and (f) corresponding load–displacement curve.
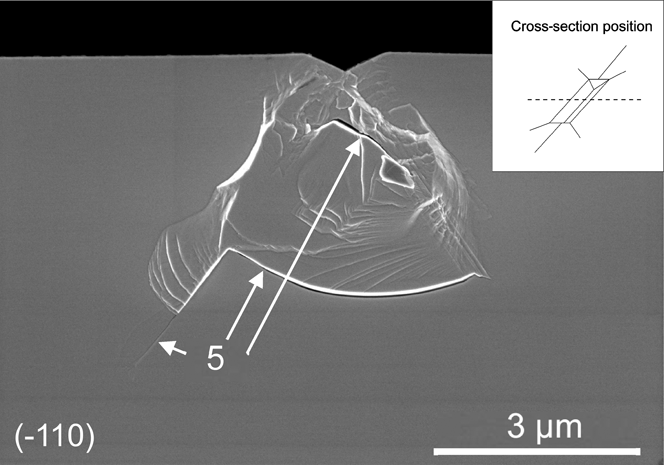
Figure 13 presents the cross-sectioning of a nanoindentation with a maximum load of 500 mN. Cross-sectioning reveals that although few cracks are observable at the surface, subsurface cracks are already nucleated. As for the 60° wedge indenter at low loads, lateral cracks (5) are aligned with { $\overline {\rm{1}}$11} and {1
 $\overline {\rm{1}}$1} planes.
Cross-section through the middle of a nanoindentation zone produced with the 120° wedge indenter for a maximum load of 500 mN.
IV. DISCUSSION
In the first part of the discussion, we address the occurrence of pop-ins in the load–displacement curve and how they relate to nanoindentation cracking events. We then focus on the influence of the indenter geometry on the crack field with respect to the methods used. The last part of the discussion assesses the estimation of indentation fracture toughness by the wedge nanoindentation technique and the limitations of this method.
A. Pop-in event
To start with, it is important to note that, for the case of in situ conical 60° indentation, many cracks are observed without any excursion in the P–h curve (see Fig. 4). This does not mean that there is no pop-in at all as they are visible when using a high compliance machine such as Nanoindenter XP. In the cases of in situ experiments, it is believed that the indenter displacement caused by the initiation of these cracks (the pop-in) is so small that (i) this displacement may not have been detected by the device sensors or (ii) the control loop has been able to compensate this sudden but small displacement.
Plateaus appear in the load–displacement curves obtained when indenting with the 60° wedge and conical indenters [see Figs. 4(f), 6(f), and 9(f)]. These plateaus may have at least three origins:
(i) drift, when the load is held at a certain level for a long time (typically to take a SEM picture);
(ii) spalling of chips;
(iii) rapid extension of the half-penny crack.
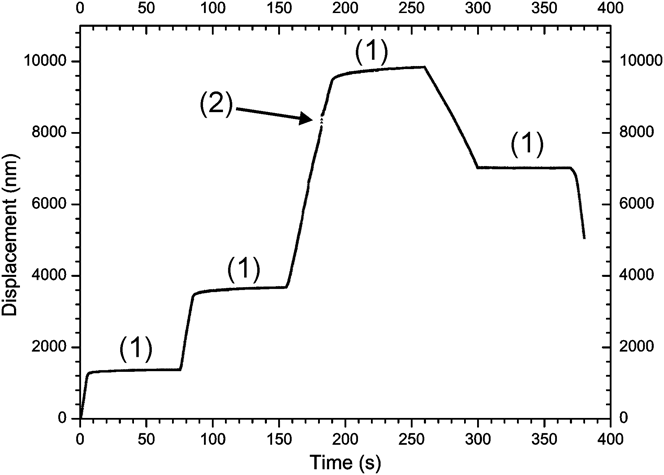
In the first case, the nature of the plateau is easily determined by careful examination of the displacement versus time curve illustrated in Fig. 14. This curve belongs to the experimental data set presented in Fig. 4 for the nanoindentation with the 60° conical indenter. Arrow (1) points to the instants where the load is maintained constant during loading at 150, 300, and 500 mN and during unloading at 50 mN, respectively, whereas arrow (2) points to the chipping-out event. Furthermore, in the case of drift, no decrease in loads is observed in the P–h curves, whereas it is the case when either spalling of chips or rapid extension of the half-penny crack occurs.
Displacement as a function of indentation time for the experiment with the 60° conical indenter presented in Sec. III. A. (1) Plateaus due to the load held constant ≈70 s, and arrow (2) points to sudden displacement due to chips formation.
The observed displacement drift (1) could have an electrical or a mechanical origin. We ruled out electrical drift of the measurement instrumentation by systematic tests. Mechanical drift under constant load could be associated with slow crack extension or “creep” of the permanently deformed zone. Creep could occur through rearrangement of the dislocated indentation region or/and because of slow slippage at the indenter–GaAs crystal interface. Slow growth of the median crack, possibly assisted by environmental effects, represents a more likely explanation. Indeed, a set of experiments conducted with combined low/high loads (50/500 mN) and short/long (5/500 s) holding times indicates that the drift is much more important at high load when cracks are formed and that it becomes negligible at low loads when none or few cracks are generated. However, the load level would also influence creep phenomena in a similar way, so that at this stage, we cannot discriminate with certainty between the two potential mechanisms for drift, which might act simultaneously.
The second and third origins of the pop-in excursions can be determined by direct observation during the experiment. The interest of in situ testing is thus demonstrated since it allows us to precisely relate an event in the load–displacement curve to a specific cracking event. However, for such investigations, the scanning rate of the SEM limits the ability of observing rapidly occurring events as in the case of simultaneous cracking events or events rapidly following one another: it is then ambiguous to associate specifically the pop-in event to either the nucleation or the extension of a specific crack.
Experiments with 60° wedge indenters, one with a larger (worn) indenter and the other with a sharper (new) edge radius, suggest an effect of the indenter acuity on the load level required to trigger pop-in. Indeed, for the two radii, we measured pop-in loads of 250 and 100 mN, respectively. The sharper edge radius led to a stronger scatter in the pop-in load than the worn one. This can be explained by the fact that the sharper radius induces a smaller stress field so that the chance of having a defect creating a stress intensity concentration is more random.
The loading rate influences the pop-in event as well. Figure 15 illustrates the dependence of the pop-in load on the loading rate. The pop-in load decreases with an increase in the loading rate. The physical mechanism for this effect may have its origin in the known strong interaction between deformation mechanisms by movement of dislocations and crack formation.Reference Wasmer, Ballif, Gassilloud, Pouvreau, Rabe, Michler, Breguet, Solletti, Karimi and Schulz5,Reference Wasmer, Parlinska-Wojtan, Gassilloud, Pouvreau, Tharian and Michler16,Reference Parlinska-Wojtan, Wasmer, Tharian and Michler17 A possible explanation could be that at higher loading rate, dislocations are confined to a much smaller area thus increasing the probability to generate a crack. The observed rate dependence of the pop-in loads is consistent with the low loads required for inducing cracks measured in scratching experiments. Surprisingly, for both load levels, the final size of the half-penny crack is not significantly affected. Indeed, variations in measured final crack lengths stay in the range of measurement errors. From this invariance, we conclude that the final size of the half-penny crack depends only on the maximum applied load, a conclusion that can be rationalized on the basis of simple static linear elastic fracture mechanics considerations.
Load level at crack pop-in as a function of the loading rate for two series of nanoindentations with 200 and 500 mN maximal loads.
B. Crack field and kinetics of crack formation
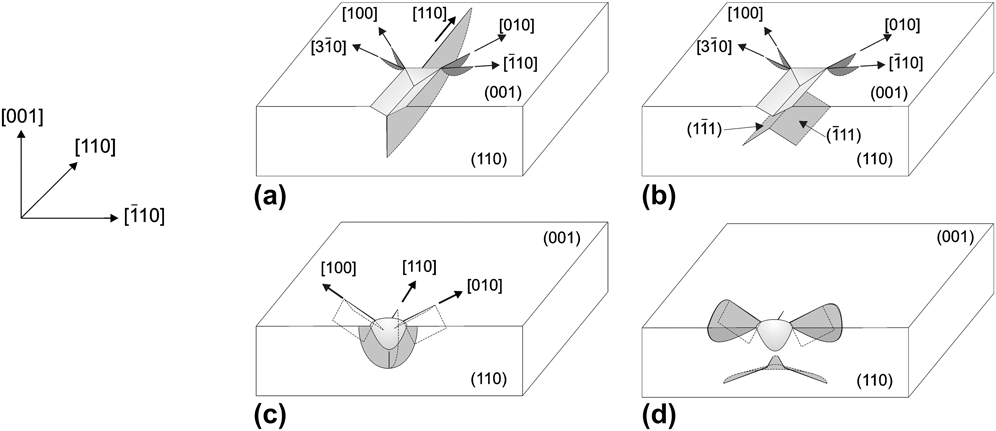
Figure 16 shows a schematic of the different types of cracks that have been observed in our experiments and indicates the plane in which these cracks propagate. For the sake of clarity, radial and lateral crack systems under conical nanoindentations have been separated into Figs. 16(c) and 16(d).
Planes and orientation of cracks generated during a nanoindentation with: (a) the 60° wedge indenter at a maximum load above pop-in, (b) the 60° wedge indenter with a maximum load below pop-in or the 120° wedge indenter, (c) the conical indenter: radial crack system, and (d) the conical indenter: lateral crack system.
For both conical indenters, two sets of radial cracks are nucleated upon loading in {110} planes perpendicular to the indented surface and in the {011} planes inclined at 45° to the surface, respectively.
When considering the chipping kinetics, we have to distinguish between two cases, depending on whether the load level is kept below or above a critical level. When the maximum load is kept sufficiently low (typically 100–200 mN for the 60° conical indenter), chipping occurs upon unloading by merging lateral cracks and {011} radial cracks. These observations are consistent with those of Cook and Pharr.Reference Cook and Pharr18 However, when the maximum load is higher than 200 mN, chipping can occur upon loading. In the case of GaAs, we believe that when chipping occurs during loading, it is most likely due to two or more radial cracks that have merged with lateral subsurface cracks.Reference Wasmer, Parlinska-Wojtan, Graça and Michler19
The apex angle of the indenter influences the critical load level necessary to induce chipping upon loading. This point is illustrated by the fact that, in contrast to nanoindentations with the 60° conical indenter, we could not induce chipping with the 120° conical indenter at the loads achievable with our in situ nanoindentation system.
Unlike pointed conical indenters, the long line edge of the 60° wedge indenter promotes the formation of a well-defined half-penny crack system in the {110} plane. Experiments were performed, in which the load was applied in three steps with intermediate unloading between each step. As a result of the loading history, the initiated crack jumps then arrests. Unloading and reinitiation upon subsequent loading contribute to leaving a faint trace of the arrested crack fronts in the crack plane. The experiments show, actually, that the half-penny crack evolves from an elongated semi-elliptical shape at low loads to a semicircular shape at higher loads as evident from Fig. 17. This figure presents a 60° wedge nanoindentation with the load applied in three steps: 125–250–500 mN and was made with an atomic force microscope (AFM) Topometrix TMX 1000 Explorer (Santa Clara, CA). The crack depth is defined by a, and c is the half crack length at the surface. The angle ϕ and radius r define the polar coordinates of the crack front.
AFM micrograph of a cross-section of a 60° wedge nanoindentation with the load applied in three steps: 125–250–500 mN.
In the case of the wedge indenter, as the load is distributed over a larger elongated area, the Palmqvist cracks are circumscribed at the extremities of the indenter, in the regions of stress concentrations. Their length rarely exceeds a few microns at the maximum loads used. Augmenting the apex angle of the wedge indenter to 120° reduces the occurrence of Palmqvist cracks and considerably shortens their length. It also prevents the formation of half-penny cracks. For these reasons, and in the perspective of using nanoindentation techniques in dicing of semiconductors, the wedge indenter is better suited than point indenters for inducing cleavage starter cracks.
Microscopic observations, at and beneath the indentation surface, show that the apex angle plays a crucial role in the nucleation and extension of the different crack systems. In the second parent paper (part II),Reference Wasmer, Pouvreau, Breguet, Michler, Schulz and Giovanola1 the relationship between the apex angle of the indenter, deformation mechanisms, and crack nucleation is investigated in more detail. The cross-sectioning technique is particularly well adapted to the analysis of crack fields in GaAs. The preferential cleavage {110} planes allow for easy production of optically flat cleavage surfaces that make subsequent observations convenient.
C. Fracture toughness estimate
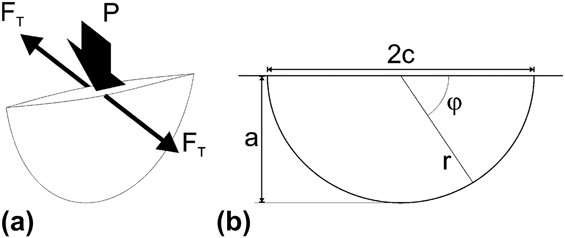
In this section, we combine our experimental measurements with a fracture mechanics analysis to obtain estimates of the fracture toughness of GaAs single crystal. Here, we extend to the wedge indenter an analysis of the indentation crack for a point indenter proposed by Fett and Munz,Reference Fett and Munz20 the so-called center loaded half-penny crack (CLHPC) configuration (Fig. 18). In this figure, P is the indentation load, F T is the crack opening force, a is the crack depth, and c is the half crack length at the surface. The angle ϕ and radius r define the polar coordinates of the crack front.
Sketch of the CLHPC configuration: (a) the loading configuration and (b) the geometric description of the half-penny crack.
In this case, the stress intensity factor at the surface (K Surf) and at the deepest point (K Depth) are written according to Fett and MunzReference Fett and Munz21:
 $${\rm{ }}{K_{{\rm{Surf}}}} = \left( {1.13 - 0.09\left( {{a \over c}} \right)} \right) \cdot 1.1 \cdot {{{F_{\rm{T}}}} \over {2{c^{3/2}}\sqrt {\rm{\pi }}\,\, {\rm{ }}E\left( k \right)}}\quad ,$$
 $${K_{{\rm{Depth}}}} = \left( {1.13 - 0.09\left( {{a \over c}} \right)} \right) \cdot {{{F_{\rm{T}}}} \over {2c\sqrt {{\rm{\pi }}a} \,\,{\rm{ }}E\left( k \right)}}\quad ,$$
with F T being equal to:
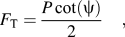 $${F_{\rm{T}}} = {{P\cot \left( {\rm{\psi }} \right)} \over 2}\quad ,$$
where ψ is the half-angle of the wedge indenter and E(k) being equal to:
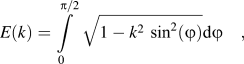 $$E\left( k \right){\rm{ }} = \int\limits_0^{{\rm{\pi }}/2} {\sqrt {1 - {k^2}\,\,{{\sin }^2}\left( {\rm{\varphi }} \right)} } {\rm{d\varphi }}\quad ,$$
and
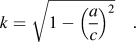 $$k{\rm{ }} = \sqrt {1 - {{\left( {{a \over c}} \right)}^2}} \quad .$$
Equations (1a) and (1b) can be recast in the form:
 $${F_{\rm{T}}} \cdot {f_1}\left( {{a \over c}} \right) = {K_{{\rm{cSurf}}}} \cdot {c^{3/2}}\quad ,$$
 $${F_{\rm{T}}} \cdot {f_2}\left( {{a \over c}} \right) = {K_{{\rm{cDepth}}}} \cdot c \cdot {a^{1/2}}\quad ,$$
with K c is the indentation fracture toughness. The crack opening force F T is given by Eq. 2 and f 1 and f 2 are the weight functions at the surface and at the maximal depth, respectively.
The evolution of F Tf 1 and F Tf 2 for the wedge 60° as a function of crack sizes a and c determined experimentally is plotted in Fig. 19. The same analysis could not be performed for the wedge 120° due to the fact that it was not possible to gather enough experimental data points for this indenter. The main reason was that the load required to initiate cracks under 120° exceeded the range of the load cell used on the in situ indentation device. In Fig. 19, the dashed lines represent the linear regressions by the least square fit method of the experimental data points. From the slope of the linear regression of the surface and depth plots in Fig. 19, values of the indentation fracture toughness K cSurf = 0.38 ± 0.04 MPa m1/2 and K cDepth = 0.44 ± 0.05 MPa m1/2 are obtained. The estimated fracture toughness measurements are summarized and compared with values from the literature in Table I. The values determined with the help of the CLHPC model agree well with experimental values usually obtained for (110) GaAs planesReference Michot and George22–Reference Margevicius and Gumbsch25 (K c = 0.31–0.49 MPa m1/2). This result suggests that the CLHPC configuration is a rather good approximation for the case of the wedge nanoindentation. However, we observe important scatter of the points calculated from experimental data with R 2 values equal to 0.76 and 0.74 for K Depth and K Surf, respectively. The more important scatter at lower loads is possibly due at least in part to two effects:
(i) at low loads, the crack has just nucleated and we are too close to the “nucleation zone” where the model does not apply;
(ii) in this case, the approximation of a centered point load that opens the crack is not valid since the crack has almost the length of the wedge and the load is distributed along the whole crack length.
Evolution of F Tf 1 and F Tf 2 with the crack length (blue) and crack depth (red) for the 60° wedge indenter.
Summary of fracture toughness values found in the literature by several authors and in the present study.
Taking the distribution of the load over a variable portion of the crack length might lead to a more accurate modeling of the crack growth.
V. SUMMARY AND CONCLUSIONS
We applied two original techniques, in situ scanning electron microscopy nanoindentation and cross-sectioning through indentations by means of controlled cleavage, to establish the crack fields in GaAs after nanoindentation with conical and wedge indenters. These complementary methods yielded valuable information about the cracking sequence and the crack morphology in the indentation region. We found that the shape and apex angles of the indenter are of critical importance in controlling the distribution and density of cracks.
When nanoindenting with a conical indenter, radial cracks form during loading. In contrast, the stage in the loading–unloading cycle at which lateral cracks extend at the surface depends on both the maximum applied load and the loading rate.
The plane strain stress field present under a wedge nanoindentation promotes the formation of a deep half-penny crack when compared to conical nanoindentations. When this half-penny crack extends at the surface, a pop-in event is observed as a discontinuity in the load–displacement curve. The load of pop-in depends on the indenter edge radius, and this increases with increasing edge radius. Furthermore, the loading rate also influences the pop-in event so that the pop-in load decreases with an increase in the loading rate.
Due to the high level of damage induced during nanoindentations with a conical indenter, cross-sectioning by cleavage is best suited to the investigation of subsurface crack fields resulting from nanoindentations with a wedge indenter. Further application of the in situ nanoindentation setup can serve for fracture studies such as the measurement of crack opening displacements during nanoindentation.
Finally, the 60° wedge indenter is a promising tool to generate well defined cleavage starter cracks necessary for many applications like singulation of laser devices or fracture testing since it minimizes the nucleation and growth of detrimental lateral cracks and the spalling of chips. Sharp point indenters are not suitable for dicing applications since numerous cracking systems are activated even at lower loads. The 120° wedge indenter may allow forming half-penny cracks when using higher loads than those used during this study. However, in this case, the obtuse angle is not the most appropriate to favor the half-penny crack, and our results suggest that spalling occurrences of chips would presumably be more developed than with a 60° wedge indenter.
ACKNOWLEDGMENT
The authors would like to thank the Commission for Technology and Innovation of the Swiss Government for funding of this work under Grant No. 6025.2.