


1. Introduction
Optical nebular emission lines are among the most widely used diagnostics of gas-phase metallicity in galaxies, as strong lines in this range are accessible from the ground and extensively sampled by large surveys. However, the auroral lines required for direct Te-based abundance determinations are intrinsically weak, limiting their use to a few hundred nearby galaxies and H II regions. This has motivated the development of strong-line calibrations, which rely on bright emission-line ratios, but existing calibrations are typically based on small, heterogeneous datasets, leading to inconsistencies at both low and high metallicities.
The aim of this work is to establish a new generation of optical strong-line calibrations derived from the most extensive, high-quality compilation of Te-based data to date: over 2700 star-forming galaxies and H II regions from the DESIRED project. By applying a homogeneous methodology, we refine previous calibrations and introduce six new relations, accounting for the first time, for observational uncertainties and temperature inhomogeneities.
2. Calibration sample
This work is based on the latest compilation from the DESIRED project (DEep Spectra of Ionised REgions Database; Méndez-Delgado et al. Reference Méndez-Delgado, Esteban, García-Rojas, Kreckel and Peimbert2023), a collaborative effort aimed at studying photoionised nebulae through homogeneous analyses of high-quality optical spectra. The full DESIRED sample includes 3154 extinction-corrected spectra of ionised regions collected from both dedicated observations and the literature, covering HII regions, local and high-z star-forming galaxies (SFGs), and planetary nebulae. All spectra contain at least one auroral-to-nebular line ratio of collisionally excited lines (CELs), such as [O III]
 $\lambda$
4363/
 $\lambda$
5007, [N II]
 $\lambda$
5755/
 $\lambda$
6584, [S III]
 $\lambda$
6312/
 $\lambda$
9069, enabling direct determinations of the electron temperature (
 $T_{\rm e}$
).
For calibration purposes we focus on a subsample of 2740 objects, restricted to extragalactic HII regions and SFGs (local and
 $z \gt 2$
). Galactic HII regions, PNe, and peculiar nebulae were excluded due to potential aperture biases. Physical conditions and abundances were derived with PyNeb (Luridiana et al. Reference Luridiana, Morisset and Shaw2015; Morisset et al. Reference Morisset, Luridiana and García-Rojas2020), solving for electron density (
 $n_e$
) and
 $T_{\rm e}$
using density-sensitive ratios and temperature-sensitive diagnostics, propagating uncertainties through Monte Carlo simulations. Ionic abundances (O
 $^+$
, O
 $^{2+}$
) were calculated under both the homogeneous temperature assumption (
 $t^2=0$
) and accounting for temperature inhomogeneities (
 $t^2\gt0$
; Peimbert Reference Peimbert1967). Total oxygen abundances were obtained as the sum of the ionic abundances, neglecting the minor contributions of O
 $^{3+}$
.
3. High-quality matters: beyond large numbers
Previous calibrations often relied on heterogeneous data, overlooking the critical role of high-quality data. In this work we impose strict selection criteria to ensure the robustness of the calibration sample. We exclude regions where auroral lines have relative errors above 40%, where nebular line ratios deviate by more than 20% from theoretical expectations, where the uncertainty in 12+log(O/H) exceeds 0.3 dex, or where the derived electron temperature is higher than 25,000 K, as such cases may indicate high-density conditions (
 $n_e \gt 1000$
cm
 $^{-3}$
) where
 $T_{\rm e}$
diagnostics become unreliable.
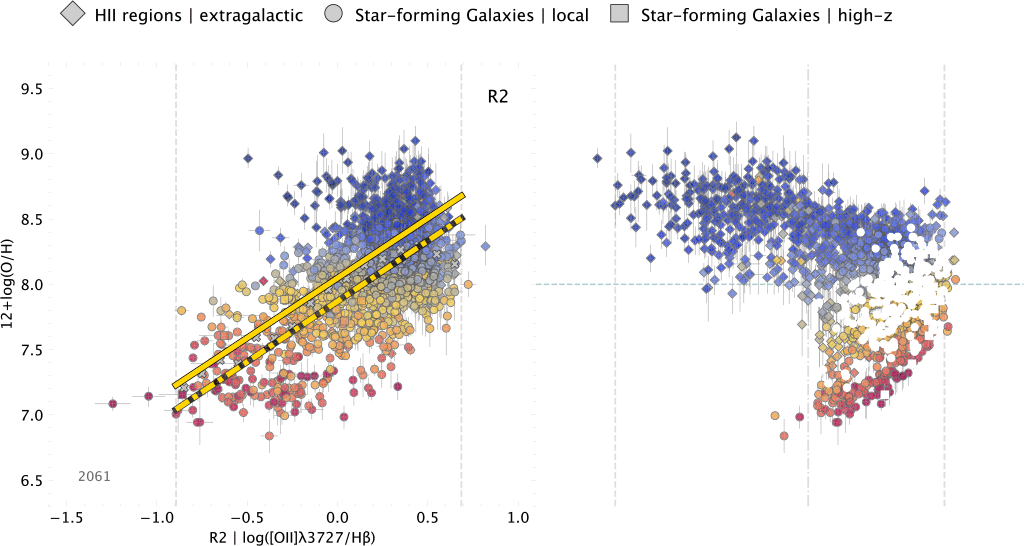
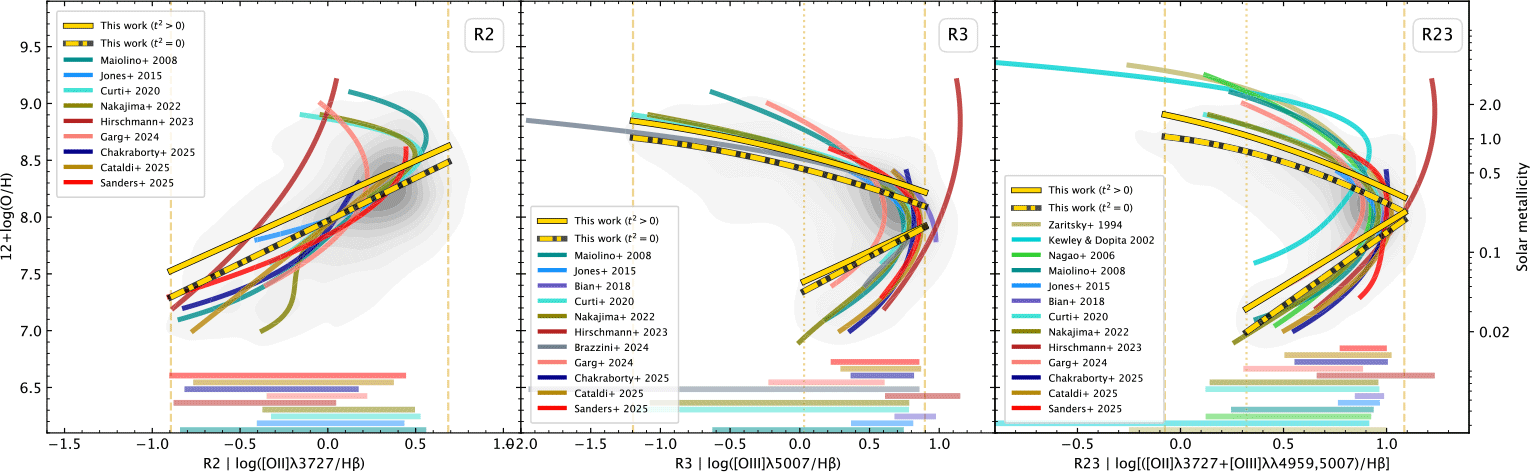
Figure 1 presents examples of three metallicity calibrations derived from the DESIRED high-quality calibration sample. For each index, we report two calibrations: one based on the classical direct method (
 $t^2=0$
, shown as a yellow-black dashed line) and another that incorporates the effect of temperature variations (
 $t^2\gt0$
, yellow solid line). These relations can be directly compared with previous determinations in Fig. 2, where grey contours trace the distribution of calibration regions in the metallicity-index plane. The DESIRED sample spans the full range of line ratios observed in H II regions and star-forming galaxies, covering the broadest metallicity range ever derived from auroral lines (12+log(O/H)
 $\approx 6.8--9.0, t^2=0$
).
Example of 3 metallicity calibrations derived from the DESIRED high-quality calibration sample: R2, R3 and R23 calibrations. The notation and ratio indices are defined in the x-label of each panel. For monotonic relations (e.g., R2), the vertical grey dashed lines mark the validity range of each calibration; for bivalued relations (e.g., R23) they mark the validity range of the upper calibration branch, whereas the dashed-dotted line marks the minimum index validity value for the lower calibration branch. The horizontal blue dashed-line marks the separation between the lower and upper branch for bivalued calibrations. The regions are color-coded by their
 $T_{\rm e}$
in units of
 $10^4$
K and their symbols correspond to the type of region as shown at the top of the figure. Error bars represent
 $1\sigma$
uncertainties. The value in the lower-left corner of each panel indicates the number of regions utilised for each calibration.

Comparison of the DESIRED metallicity calibrations with previous determinations from the literature for the calibrations shown in Fig. 1. Grey contours trace the density distribution of the calibration regions, derived from a kernel density estimation (KDE) and plotted at ten equally spaced probability levels, with darker shades indicating higher concentrations. The yellow-black dashed line and yellow solid line correspond to the
 $t^2=0$
and
 $t^2\gt0$
calibrations, respectively. Vertical yellow dashed lines mark the validity ranges of the DESIRED calibrations, while dotted lines indicate the minimum index value for the lower branch in bi-valued relations. Previous calibrations are shown as solid coloured lines, with references indicated in the legends. The horizontal coloured bars beneath each panel denote the validity ranges of each literature calibration.

In many cases, the validity range of the DESIRED calibrations exceeds that of earlier relations based on smaller datasets. This wider coverage produces unusual shapes in some calibrations, particularly at the low- and high-metallicity ends. Such effects are especially relevant when comparing with calibrations derived from simulations (e.g., Hirschmann et al. Reference Hirschmann, Charlot and Somerville2023; Garg et al. Reference Garg, Narayanan and Sanders2024; Cornejo-Cárdenas et al. Reference Cornejo-Cárdenas, Sillero and Tissera2025) or with recent high-z calibrations based on several JWST sources (Chakraborty et al. Reference Chakraborty, Sarkar and Smith2025; Scholte et al. Reference Scholte, Cullen and Carnall2025; Sanders et al. Reference Sanders, Shapley and Topping2025).
It is important to note that the present calibrations do not include corrections for the ionisation state of the gas (e.g., the ionisation parameter log u; or the P parameter, Pilyugin & Thuan Reference Pilyugin and Thuan2005), nor do they account for variations in the specific star-formation rate (Curti et al. Reference Curti, Cresci and Mannucci2017). These aspects will be explored in a forthcoming publication.
 Te
 104
 1σ
 t2=0
 t2>0


