Introduction
Increasing demand for locally grown food products has motivated rapid development of markets for farmers selling their products directly to consumers, including farmers' markets, roadside stands, U-pick operations, etc. According to the 2012 Census of Agriculture, direct-to-consumer sales by the US farmers increased by 60%, and the number of farms selling directly increased by 127,797 from 2002 to 2012. Recent studies have found that the rapid growth is largely driven by concerns about sustainability, the local economy and environment. First, several economic studies have found that direct food outlets support more job opportunities than traditional supermarket outlets (Otto and Varner, Reference Otto and Varner2005; Henneberry et al., Reference Henneberry, Agustini, Taylor, Mutondo, Whitacre and Roberts2008; Hughes et al., Reference Hughes, Brown, Miller and McConnell2008). Second, due to reduced distance between food producers and consumers, farmers' markets and roadside stands are considered to be more environmentally friendly, leading to a lower carbon footprint (Guptill and Wilkins, Reference Guptill and Wilkins2002). For society, local markets help small-scale producers to ‘add and retain values’ (Curry, Reference Curry2002; Ilbery and Maye, Reference Ilbery and Maye2005). For some consumers, local foods purchased at a farmers' market are frequently perceived to be fresher and less processed than foods from mainstream food retailers (O'Hara, Reference O'Hara2011).
Despite their rapid growth, several practical barriers have kept many consumers away from shopping at direct food outlets. An interview of 463 consumers at North Carolina farmers' markets suggested that inconvenient market locations made farmers' markets less attractive than a supermarket close to a respondent's residence. The top disadvantages reported were ‘long travel distance’, ‘seasonality’ and ‘lack of food availability’ (Andreatta and Wickliffe, Reference Andreatta and Wickliffe2002). Similar results were found in a Tennessee study (Eastwood, Reference Eastwood1996), which revealed that there was additional travel cost associated with visiting a farmers' market. A Logit analysis in New Jersey revealed that participation at different farm marketing facilities may vary by locations and consumer demographic characteristics. For instance, elderly persons over 65 years of age are less likely to visit roadside stands (Govindasamy and Nayga, Reference Govindasamy and Nayga1997). Another study revealed that distance to metropolitan regions influences county direct farm marketing sales in West Virginia (Gandee et al., Reference Gandee, Brown and D'Souza2003). These empirical studies suggest that accessibility for consumers is one major barrier for direct food marketing.
This is especially true for farmers' markets because of their discrete locations and limited hours of operation. In order to attract more consumers, managers must make good decisions on their market locations. Additional work is needed to analyze the spatial distribution of farmers' markets in relation to consumers’ preferences. A national study by the USDA Agricultural Marketing Service mapped the overlapping trade zones of farmers' markets together with consumers and vendors. The report indicated that the location for a farmers' market was very important because its sales are usually restricted by ‘smaller zones for customer traffic’ (Lohr et al., Reference Lohr, Diamond, Dicken and Marquardt2011). Although many studies have provided evidence of the potential relationship between spatial distribution of traditional food retailers and consumer purchasing decisions (Frank et al., Reference Frank, Glanz, McCarron, Sallis, Sealens and Chapman2006; Chen et al., Reference Chen, Florax and Snyder2009; Sharkey et al., Reference Sharkey, Horel, Han and Huber2009; Opfer, Reference Opfer2010; Sparks et al., Reference Sparks, Bania and Leete2011), only a few studies have done this for farmers' markets (Jilcott Pitts et al., Reference Jilcott Pitts, Wu, McGuirt, Crawford, Keyserling and Ammerman2013; Mack and Tong, Reference Mack and Tong2015), due to a lack of spatial household-level consumption data for this marketing channel.
Our study addresses this gap by testing the effect of spatial accessibility to farmers' markets on consumer purchasing decisions. We also control covariates such as availability of other traditional retail food stores, consumer characteristics and perceptions of local foods. Evaluating the relative importance of these factors may help marketers target a segment of interested consumers and advertise their local food products more effectively.
Empirical Study on Consumer Food Vendor Choice
Survey
The consumer food purchase data used in this study came from a public mail survey of 7500 randomly selected households in Florida implemented by the University of Florida in 2012, as originally reported (Hodges and Stevens, Reference Hodges and Stevens2013). This survey collected information on Florida consumers’ shopping frequencies and values of foods purchased through multiple local food distribution channels. For the specific purpose of this paper, we focused only on purchases at farmers' markets, roadside stands, and U-pick operations. A series of questions included consumers’ perceptions of local food attributes (freshness, nutrition, food safety, food security, organic certification, etc.) and limiting factors (unavailability, seasonality, not knowing if truly local, high price, etc.). The survey was addressed to the primary food shopper in the household. Questionnaires were assigned a unique code number corresponding to the mailing address for geocoding and spatial analysis.
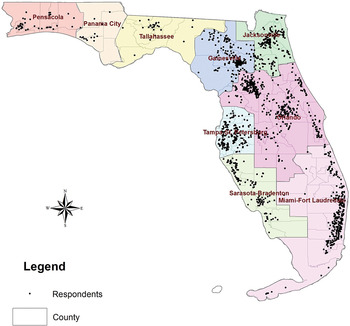
After eliminating duplicates and questionnaires returned as undeliverable, 1599 usable responses were obtained, representing a response rate of 21.4%. The distribution of responses is mapped in Figure 1. The North Central region, Tampa Bay and Miami-Ft. Lauderdale regions were over-sampled or had higher response rates. Nearly three-quarters of respondents were female (72.4%), middle aged between 45 and 64 years (42.5%) and obtained a college degree (32.7%) than the general Florida population (25.4%). Although the survey sample was broadly representative of the Florida population, an overall sample weighting factor was assigned for each respondent in the empirical model to correct for differences in age, income, education and location.
Survey respondents’ locations by Florida economic regions. (Note: functional economic regions were defined by US Commerce Department, Bureau of Economic Analysis; Johnson and Kort, Reference Johnson and Kort2004).

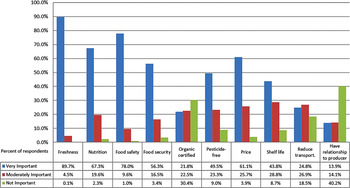
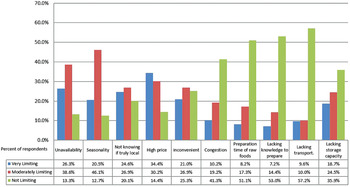
Among 1599 respondents, 61.7% reported that they had purchased locally grown foods at a farmers' market, roadside stand or U-pick operation in 2012. The most commonly reported food types purchased were vegetables and fruits (73.0%). Regarding consumers’ perceptions of local products, attributes rated as ‘very important’ were ‘freshness’ (89.7%), ‘food safety’ (78.0%) and ‘nutrition’ (67.3%) (Fig. 2). On the other hand, ‘having a relationship with producers’ and ‘organic certification’ were reported as ‘not important’ by a large percentage of respondents. The most limiting barriers found were ‘high price’ (rated as ‘very limiting’ by 34.4%), ‘unavailability’ (26.3%) and ‘not knowing if truly local as labeled’ (24.6%) (Fig. 3).
Summary of consumers’ perceived attributes of local foods.

Summary of consumers’ perceived barriers for local food systems.

Theoretical framework and hypotheses
The conceptual framework employed in this study was the random utility model of consumer choice developed by McFadden (Reference McFadden1974). The basic assumption is that an individual maximizes his or her utility given a certain budget constraint, utility is ‘a function of attributes of products or services and characteristics of this person’ (Lancaster, Reference Lancaster1966), as revealed by their purchasing choices. In this study, if we assign the observed choice as the dependent variable Y, then Y = 1 means that this individual chooses a direct food outlet and obtains a higher utility from this food channel. On the other hand, Y = 0 implies this individual prefers other traditional food vendor sources. The predicted value of Y can be interpreted as the expected probability that an individual shops at farmers' markets, roadside stands and U-pick operations.
Now the key question is what explanatory variables should be included in the conceptual framework? Firstly, spatial factors are the central variables of interest in this study. As previous literature suggested, lack of access to markets is a crucial barrier for farmers' market patrons. Moreover, since food products in direct-to-consumer channels share many similar attributes to those in grocery stores or other food outlets, it is possible that having a traditional food outlet nearby makes people less likely to visit farmers' markets, roadside stands and U-pick operations. Therefore, we hypothesize that:
-
H1: Ease of access to farmers' markets increases consumers’ direct food purchases.
-
H2: Availability of a nearby alternative food outlet negatively affects a consumer's likelihood of shopping at farmers' markets, roadside stands and U-pick operations.
Next, we include consumer perceptions of local foods as control variables. These variables have been widely used in consumer demand analysis because they affect an individual's utility of consuming a good (Brown, Reference Brown2003; Bond et al., Reference Bond, Thilmany and Bond2006; Thilmany et al., Reference Thilmany, Bond and Bond2008; Conner et al., Reference Conner, Colasanti, Ross and Smalley2010). As Lancaster stated, ‘the good itself does not contribute to an individual's utility, but the attributes associated with that good do’ (Lancaster, Reference Lancaster1966). Many studies showed that interest in local foods is a primary motive for many direct food market patrons. For example, a national online survey found that respondents who used direct-to-consumer markets as a primary food source tended to rank ‘variety available’ and ‘support for local producers’ higher than other attributes (Bond et al., Reference Bond, Thilmany and Bond2006). Another survey of New Jersey farmers' markets shoppers indicated that 87% of respondents thought ‘availability’ and ‘freshness’ affected their decisions on where to purchase (Govindasamy et al., Reference Govindasamy, Zurbriggen, Italia, Adelaja, Nitzsche and Van Vranken1998). Other studies have suggested that negative perceptions of farmers' markets include seasonal availability, high price, inconvenient operation times, etc. (Eastwood, Reference Eastwood1996; Andreatta and Wickliffe, Reference Andreatta and Wickliffe2002; Schmidt et al., Reference Schmidt, Kolodinsky, Desisto and Conte2011). Although some of these perceptions may not be justified, they may influence consumer's purchasing decisions. So we hypothesize that:
-
H3: Consumers’ perceptions of favorable local food attributes positively affect their participation in direct food markets, and their perceptions of the limiting factors have negative effects.
Some exogenous variables such as demographic characteristics were found to be significant indicators of consumers’ purchasing patterns. For example, consumers who were female, middle aged and with higher income were more willing to purchase directly from local farmers (Adrian and Vitelli, Reference Adrian and Vitelli1982; Smallwood and Blaylock, Reference Smallwood and Blaylock1984; Eastwood, Reference Eastwood1996; Wolf, Reference Wolf1997). In this regard, we test the following hypothesis:
-
H4: Consumers with certain demographic characteristics (such as female, middle aged, higher education attainment, high income, etc.) are more likely to purchase at farmers' markets, roadside stands, and U-pick operations.
Model specification
A probit analysis was selected to examine the hypothesized relationships above based on some statistical concerns. If the respondent purchased food from these direct market outlets in 2012, then the dependent variable was 1 or 0, otherwise. Since binary response variable violates the assumption of homoscedasticity for linear models, several nonlinear functional forms have been developed to address this issue. The probit technique is one of the most widely used nonlinear frameworks (McFadden, Reference McFadden1974; Mabiso et al., Reference Mabiso, Sterns, House and Wysocki2005; Conner et al., Reference Conner, Colasanti, Ross and Smalley2010; Ross et al., Reference Ross, Shanoyan, Conner and Colasanti2010). Another popular alternative is the logit model; however, the probit model has a slightly better fit than that of logit model for our dataset. We also chose it because the interpretation of marginal effects tends to be more straightforward than the odds ratio in a logit model.
The rationale to apply the probit model to choice behavior can be explained by the random utility theory (McFadden, Reference McFadden1974). If a respondent purchased any local foods from farmers' markets, roadside stands and U-pick operations in 2012, this implies that he obtained a higher utility than from traditional food channels. Let Z* be the difference of utilities between these two alternatives. Consumers visited direct food markets if Z* > 0 (i.e., Y = 1) and not if Z* < 0 (i.e., Y = 0). Then the latent variable Z* for individual i can be estimated as:
 $$Z_i^{\ast} = \mathop \sum \limits_{k = 1}^N {\rm \beta} _{ik} x_{ik} - u_i, \quad Z^{\ast} = U_{\_Direct} - U_{\_Traditional} $$
where the set of x ik terms are explanatory variables and u i is the error term. Next, the nonlinear transformation links choice indicator Y with Z* to predict the probability of Y = 1,
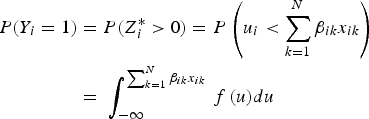 $$\eqalign{P(Y_i = 1) &= P(Z_i^{\ast} \gt 0) = P\left( {u_i \lt \mathop \sum \limits_{k = 1}^N {\rm \beta} _{ik} x_{ik}} \right) \cr & =\; \int_{ - \infty} ^{\sum\nolimits_{k = 1}^N {{\rm \beta} _{ik} x_{ik}}} {\,f\,(u)du}}$$
where f(.) is the probability density function of error term u
i
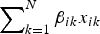
, which is assumed to be normally distributed under the probit framework. As
 $\sum\nolimits_{k = 1}^N {{\rm \beta} _{ik} x_{ik}} $
increases from negative infinity to positive infinity, the predicted probability goes up from 0 to 1.
Data and variables
Spatial factors in the model included ease of access to farmers' markets and existence of other food stores. For the former, we developed two measurements: distance to nearest farmers' market and number of farmers' markets within a 5 km radius for each household. The 5 km distance was considered as a ‘reasonable’ driving distance for food shopping. The addresses of households used in the survey were geocoded, and the geocoded locations of Florida farmers' markets in 2012 were obtained from the National Farmers Market Directory maintained by the USDA Agricultural Marketing Service. We used ArcMap 10.2.2 software (ESRI R, 2011) to put these two data layers into a coherent dataset, and applied the Proximity toolset to find the Euclidean (straight line) distance to the nearest farmers' market. Then a 5 km buffer was created for each household, and the number of farmers' markets within this zone was counted.
Data on locations of other food outlet came from the InfoUSA database and ESRI® Business Analyst. We grouped these food stores into three types: grocery stores, food specialty stores and convenience stores based on the North American Industry Classification System (NAICS). Again, we used ArcMap 10.2.2 software to determine the numbers of these food outlets within 5 km for each household. In sum, the spatial variables included in the analysis were:
-
• Distance to nearest farmers' market,
-
• Number of farmers' markets within 5 km,
-
• Number of convenience stores within 5 km,
-
• Number of grocery stores within 5 km,
-
• Number of food specialty stores within 5 km.
Next, we included consumers’ perceptions of local foods as control variables. The respondents were asked to evaluate the relative importance of local food attributes and limiting factors. The attributes such as freshness, nutrition, food safety, etc. were rated on a three point Likert-type scale of ‘very important’, ‘moderately important’, ‘not important’ and ‘don't know’. Dummy variables were constructed for each category and ‘not important’ was treated as the reference group in the probit model. For the limiting factors (unavailability, seasonality, high price, etc.), dummy variables were constructed for ‘very limiting’, ‘moderately limiting’, ‘not limiting’ and ‘don't know’ with ‘very limiting’ as reference group. Specifically, these variables included the following:
-
• Local food attributes: freshness, nutrition, food safety, food security, organic certification, pesticide free, price, shelf life, reduced transportation, and relationship to producer.
-
• Limiting factors: unavailability, seasonality, not knowing if truly local, high price, inconvenient operation hour, market congestion, time required for preparation of raw foods, lacking knowledge to prepare, lacking transportation and lacking storage capacity.
In addition, the ‘area considered local’, was included as a variable, i.e., what is considered to be the area in which local foods are produced (city, county, 100 mile radius, state of Florida, Southeast U.S. region). Finally, respondents’ demographic characteristics were added to the model, including age, household income, number of persons in household and type of residential area. Again, we constructed dummy variables for each category of these variables. See Appendix 1 for more information.
Results
Probit model results
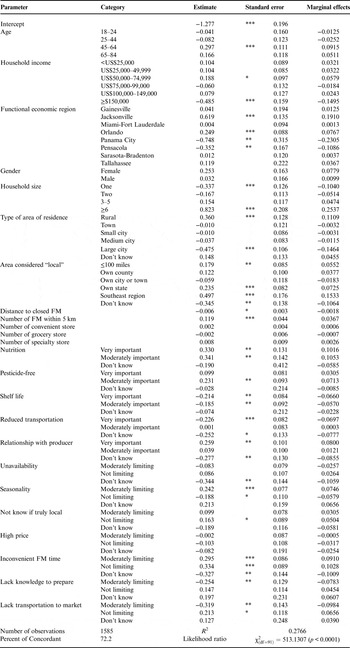
The probit model was estimated using the maximum-likelihood method. The ‘stepwise’ multiple regression procedure in the Statistical Analysis System (SAS) software (SAS Institute I, 2011) was used to automatically select significant independent variables in the model. Therefore, the final model retained all spatial variables and other statistically significant variables at the 10% probability level. Since the coefficients of a probit model cannot be interpreted as marginal effects, as the Ordinary Lease Squares model allows, we derived the marginal effect of each variable by averaging the derivatives for all observations. The marginal effects measure how much the probability of participation changes as an increase of any particular regressor variable, while holding other explanatory variables fixed. The full results are presented in Appendix 1. The best-fitting model had an R-square of 0.2766, which was considered acceptable for econometric analysis of cross-sectional data. A likelihood ratio of 513.1 implied the model was significant at a confidence level of 0.0001.
Spatial accessibility
Estimation results suggested that two measurements of ease of access were statistically significant at the 10% level. As Table 1 shows, the marginal effect of proximity to the closest farmers' market indicated that an additional distance of 1 km would reduce the expected probability of purchasing by 0.18%. The addition of one farmers' market within 5 km distance increased the probability of purchasing by 3.67%.
Model estimation results for spatial variables.

Asterisks “***”, “**” and “*” denote model effects that were statistically significant at 0.01, 0.05 and 0.10 probability levels, respectively. Number of observations: 1585; R 2 = 0.2766; likelihood ratio χ2(df = 91) = 513.1307 (p < 0.0001).
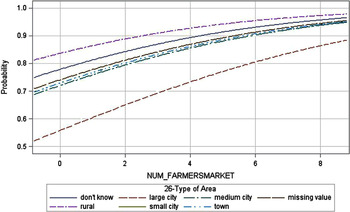
Figure 4 shows how the predicted probability of purchasing rises with the number of farmers' markets within a 5 km radius. The probability curves are given by type of residential area. The results suggest that large city residents were more likely to purchase if there were more farmers' markets nearby. On the other hand, even though rural respondents had a higher overall purchasing probability, they were least affected by an increase in the number of farmers' markets nearby. This finding implies that spatial accessibility affects consumer's participation decisions differently depending upon the type of residential area.
Predicted probability for purchasing at farmers' markets/roadside stands/U-pick operations versus the number of farmers' markets within 5 km given all other categorical predictors at the levels of a typical farmers' market shopper and continuous predictors at their means.

In regards to the effects of other nearby food outlets, all spatial variables were statistically insignificant; however, in terms of sign, number of grocery stores within 5 km had a negative marginal effect, while convenience stores and specialty stores had positive effects (Table 1).
Characteristics of local foods
Since all levels of the variables for local food characteristics were treated as dummy variables, a positive marginal effect indicated a higher estimated probability of direct market purchasing for that level than the reference group, which is ‘not important’. Estimation results revealed that respondents who rated ‘nutrition’ and ‘having a relationship with producers’ as ‘very important’ and ‘pesticide free’ as ‘moderately important’ were more likely to shop at direct food outlets. On the other hand, concerns about ‘shelf life’ and ‘reduced transportation’ reduced the likelihood of purchasing by 6.6 and 7.0%, respectively.
For the limiting factors that may discourage consumers from purchasing directly from farmers, the reference group was ‘very limiting’. Significant negative marginal effects were found for ‘lack of knowledge to prepare’ and ‘lack of transportation’. The positive marginal effects of the ‘moderately limiting’ level for ‘seasonality’ and ‘inconvenient times’ meant that the respondents who thought ‘seasonality’ and ‘inconvenient times’ moderately limiting were more likely to participate in direct food marketing than those who rated these factors ‘very limiting’.
Additionally, it is interesting to note that consumers’ beliefs about what constitutes local foods also affected their direct market participation rates. According to the variable ‘Area considered local’, a respondent who held a wider acceptance of local foods as ‘the southeast U.S. region’ was expected to have a higher probability of attendance than one who thought ‘local’ meant from within the same city or county. Respondents who reported ‘don't know’ to this question were less likely to purchase at direct food markets.
Demographic characteristics
Consistent with previous literature, our study found that individuals who are middle aged (45–64 years), have household incomes between US$50,000 and 74,999, have more than six persons in the household, and live in rural areas are more likely to purchase food from direct outlets (Appendix 1). However, very high incomes (≥US$150,000), single person households, and persons living in large cities had significantly lower direct food purchasing. Although the coefficient for gender was not significant, the marginal effect for females was larger than for males, suggesting that females were more interested in direct-marketed foods.
Discussion
Consistent with our hypothesis, these results provided empirical evidence that ease of access to farmers' markets does increase the probability of purchasing at these direct food outlets. One interesting finding was the different attitudes toward spatial accessibility in rural and urban areas. Although rural residents were more likely to visit farmers' markets, they were less affected by number of farmers' markets within 5 km of their households. One possible reason is that rural people usually travel much further to food outlets than people living in large cities do (Jilcott Pitts et al., Reference Jilcott Pitts, Wu, McGuirt, Crawford, Keyserling and Ammerman2013), so spatial accessibility may not be a big concern for rural residents. On the other hand, due to the stressful urban life and many alternative food sources available, urban residents tend to value convenient locations more when deciding where to purchase foods. If there is an additional farmers' market within their normal driving distance, then they may go and buy some products directly from the farmers.
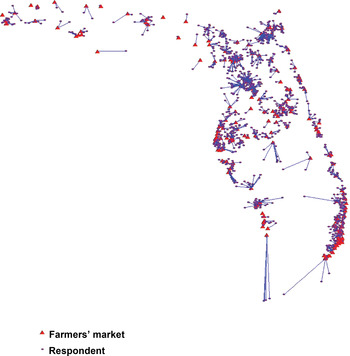
Given the significant effect of spatial accessibility on consumer behavior, it is worthwhile to further evaluate the household-level proximity to farmers' markets in Florida. The proximity is measured as the Euclidean distance between a respondent's address and the closest farmers' market. As shown in Figure 5, in general Northwest Florida respondents had longer travel distances to the closest farmers' market, while people residing along the southeast coast of Florida could easily visit a nearby farmers' market. Additionally, a large number of farmers' markets were located in metropolitan areas such as Miami, Tampa and Orlando. Why these areas are more likely to host a farmers' market? The first reason is the large population base in large cities (Schupp, Reference Schupp2014). As discussed above, it is also true that people in metropolitan areas are more attracted by additional farmers' markets nearby. Further, some government programs have contributed to the unequal dispersion of direct markets, such as USDA's ‘Know Your Farmer, Know Your Food (KYF2)’ Program (Desrochers and Shimizu, Reference Desrochers and Shimizu2012). According to a letter from three United State Senators, the Administration released US$65 million under KYF2 to support urban farmers' markets. ‘Propping up the urban locavore markets,’ they wrote, negates the primary need for rural development in order to favor affluent patrons at urban farmers' markets (http://www.farmpolicy.com/wp-content/uploads/2010/04/JM_SC_PR_Know-Your-Farmers.pdf). However, investing too much in urban farmers' markets may lead to serious problems. Argued by Lohr et al. (Reference Lohr, Diamond, Dicken and Marquardt2011), most farmers' markets in large cities face the most intense competition for consumers from traditional outlets, especial those in urban cores. We suggest the policy makers should seek a more balanced development of the direct food system.
Euclidean distances between respondent homes and nearest farmers' markets.

Findings on consumers’ perceptions provided some insights on how to promote direct food marketing. Three desirable attributes, ‘nutrition’, ‘having a relationship with producers’ and ‘pesticide free’, were found to be significant motivators for people to choose farmers' markets. Advertisements emphasizing these attributes could be an effective strategy to differentiate farmers' markets from alternative food outlets. In spite of the inconvenient hours of operation, consumers who did not shop at farmers' markets often cited ‘lack of transportation’ and ‘lack of knowledge how to prepare raw foods’ as practical barriers. To attract these non-shoppers, farmers' markets should improve the market visibility and accessibility. For example, they could provide detailed location information such as digital maps on a website, and online shopping and delivery services. Another market strategy is to provide printed brochures to introduce how to prepare the foods.
The significant model results for certain demographic variables could be used to develop a typical consumer profile, which might help market managers more effectively target potential consumers. A typical direct food market shopper tends to be female, middle age, and with a larger household size and average income. Moreover, consumers living in rural areas are more interested in direct food marketing channels and willing to travel longer distances to shop. This was at odds with a study in New Jersey that found that urban residents are more likely to visit farmers' markets than their rural counterparts (Govindasamy and Nayga, Reference Govindasamy and Nayga1997). This inconsistency could be because our analysis included shoppers at roadside stands and U-pick operations.
The relationship between direct food markets and traditional food retail stores appears to be more complicated, as the number of other food outlets within a 5 km distance was not significant. A question remaining to be answered is do traditional and direct market channels compete for consumer purchases, and if so, what are the true barriers for farmers' markets to compete with traditional food retailers? We suggest that future studies should explore other key factors relating to this issue. For example, respondents who perceived ‘seasonality’ and ‘farmers' market days or times are inconvenient’ as ‘very limiting’ were less likely to purchase at a farmers' market, and while most grocery stores and convenience stores are open throughout the year, the limited hours of operation of direct market venues may be a crucial obstacle. Price differences may be another factor to consider. A study comparing prices at farmers' markets and grocery stores in Vermont found that price differences have been exaggerated by consumer perception of the ‘high price’ of products in farmers' markets. This stereotype resulted from the fact that farmers' markets often sold more organic foods than grocery stores, and organic foods were usually associated with higher prices (Claro, Reference Claro2011). It is suggested that farmers' market managers strive to help consumers realize that their outlets are an affordable food source and to emphasize the organic attribute to justify the higher prices in some cases.
Conclusion
This study evaluated the spatial accessibility of farmers' markets in Florida in relation to consumers’ shopping behaviors based on a public mail survey. Our findings suggested that ease of access significantly affects consumers’ participation in direct food markets. Other significant factors included consumers’ demographic characteristics and perceptions of local foods. These findings provided some insights to help promote the direct-to-consumer food channel, such as informed market location decision-making, target consumer profile and marketing strategies to differentiate food products.
Among the limitations of this study, there were no spatial data available on other types of direct food outlets, such as roadside stands and U-pick operations, so the spatial analysis was limited to farmers' markets. Also, the spatial measurements were based on the Euclidean distance. To be more accurate, future studies should consider the road network distance and travel time.
Additionally, to better quantify access to food venues, we need to use both spatial and temporal measurements (distance, number of facilities within a distance, business time, etc.). This study was limited to the spatial aspect because information was not available on the precise hours of operation for different food outlets. Given that their spatial relationships were not statistically significant predictors of shopping, further studies should evaluate other aspects such as operation times and pricing strategies.
Acknowledgements
We would like to thank Dr Zhefeng Gao, Dr Lisa House and Dr Thomas Stevens at the University of Florida for their assistance in this study. This project was funded by a Specialty Crop Block Grant from the U.S. Department of Agriculture, through the Florida Department of Agriculture and Consumer Services, and the Florida Specialty Crop Research Foundation, with supplemental funding provided by the University of Florida Office of Sustainability and Alachua County, Florida Sustainability Program (Hodges and Stevens, 2013).
Appendix
Results of participation decision model.