1. INTRODUCTION
The designerly way of thinking is commonly acknowledged as one of the most complex and unique human activities (Cross, Reference Cross2007). A growing body of research has attempted to demystify the design processes of individual designers and collaborators. Protocol analysis has become more important over the last three decades because it facilitates exploration of the thinking processes of designers. This methodology has been utilized in many design disciplines, including architecture, industrial design, engineering, commercial, and electronic design (Cross, Reference Cross, Eastman, Newstetter and McCracken2001). Protocol studies focus on the roles of design media, the nature of the design process, and the knowledge of designers. They are also concerned with how design teams frame problems, with a view to discovering their pedagogical and practical implications.
Design research, psychology, computer science, sociology, and even anthropology now share a similar interest in exploring how designers think and resolve design problems. Design thinking represents a core aspect of human cognition and creativity with applications in design education and computational tools. Design thinking has also begun to play an important role in shaping industry and company strategy (Brown, Reference Brown2008).
2. PURPOSE AND OBJECTIVES
Research in to the cognitive structure of the design process has revealed how design solutions are generated using different heuristics and strategies, with the aid of sketches (Cross, Reference Cross, Eastman, Newstetter and McCracken2001). Akin and Lin (Reference Akin and Lin1995) speculated on the parallel occurrence of novel design decisions and multimodal behaviors, including drawing, examining, and thinking, at the same time. Suwa et al. (Reference Suwa, Gero and Purcell2000) highlighted the ability of designers to perceive unexpected occurrences (via sketches) in perceptual, functional, and conceptual levels of cognition. Kavakli and Gero (Reference Kavakli and Gero2002) demonstrated the existence of a complex network between different levels of design cognition in the designer's thinking processes. Goldschmidt and Tatsa (Reference Goldschmidt and Tatsa2005) postulated that effective design processes are characterized by a high ratio of interlinks among ideas, to bolster their claim that the link index of linkography is significant in the design process. Finally, Valkenburg and Dorst (Reference Valkenburg and Dorst1998) used a reflection in action coding scheme to show the qualitative differences between collaborative design processes. In a similar vein, the major interest of the present study lies in the relationship between the design process and performance.
The globalization of the design industry has made collaborative design integral to the success of companies and product development alike. The complexity of design problems and the limited development time are particularly significant in this context. Protocol studies have gradually emerged as an important methodology for studying design teams (Stempfle & Badke-Schaub, Reference Stempfle and Badke-Schaub2002; Wu & Duffy, Reference Wu and Duffy2004; Kim & Maher, Reference Kim and Maher2008; Le Dantec & Do, Reference Le Dantec and Do2009; Wang et al., Reference Wang, Shih and Chien2009; Cai et al., Reference Cai, Do and Zimring2010). One advantage is that protocols are obtained from the verbal communication between team members, thereby avoiding the compulsory think-aloud characteristic of the individual design process.
Previous studies have explored the design process from a qualitative perspective. However, their findings have not been ratified, given that other authors have seldom reapplied the methods of segmentation and codification. To redress this imbalance, the present study attempts to reapply the coding scheme used by canonical protocol studies, to quantitatively reexamine their qualitative findings with respect to a significant number of subjects.
The major purpose of this research was to explore the relationship between design processes and design performance in collaborative design, using retrospective protocol analysis, to provide a better understanding of the nature of design activities, with pedagogical implications also.
The objectives of this study were threefold: first, collecting 20 sets of protocol data of collaborative designs, sufficient for statistical testing. Second, applying a proven coding scheme to formulate a theoretical comparative base that used the qualitative findings gained from previous research as hypotheses to test. These hypotheses were related to relationships between the quality of the collaborative design process and the design performance. Third, qualitative observation and statistical results revealed the relationship between the design process and extended previous research.
3. PROTOCOL ANALYSIS
Following the initial study (Eastman, Reference Eastman and Moore1970), protocol analysis has been widely applied in the design community (Cross, Reference Cross, Eastman, Newstetter and McCracken2001). The Delft Design Conference established the methodological position (Cross et al., Reference Cross, Christiaans and Dorst1996). It has become one of the standard experimental techniques for exploring the cognitive process of design. Discussions of theory and operational techniques have been extensively published over the last decade or so (Ericsson & Simon, Reference Ericsson and Simon1993; van Someren et al., Reference van Someren, Barnard and Sandberg1994; Foreman & Gillett, Reference Foreman and Gillett1997). The latest developments were scattered in different journal articles, books, and conferences (Cross et al., Reference Cross, Christiaans and Dorst1996; Cross, Reference Cross, Eastman, Newstetter and McCracken2001, Reference Cross2007; Eastman et al., Reference Eastman, McCracken and Newstetter2001; Michel, Reference Michel2007). Methodological improvements have been proposed, such as utilizing videorecording in retrospective protocols (Suwa et al., Reference Suwa, Gero and Purcell2000). Linkography, a new method of analyzing the transformation of concepts and the interconnection between segments (Goldschmidt, Reference Goldschmidt1995; van der Lugt, Reference van der Lugt2000; Cai et al., Reference Cai, Do and Zimring2010), and mathematical measurement of the team design process (Kan & Gero, Reference Kan and Gero2008), are further options.
Two protocol approaches have been developed: concurrent and retrospective (Ericsson & Simon, Reference Ericsson and Simon1993; Dorst & Dijkhuis, Reference Dorst and Dijkhuis1995). In the former, the subjects are required to design and verbalize thoughts simultaneously (Lloyd et al., Reference Lloyd, Lawson and Scott1995). In retrospective protocols, subjects are asked to design first, and then retrospectively report the design processes, with or without visual aids. Studies of collaborative design have collected concurrent protocols in communication between members without compulsory thinking aloud (Stempfle & Badke-Schaub, Reference Stempfle and Badke-Schaub2002; Turner & Turner, Reference Turner and Turner2003; McDonnell & Lloyd, Reference McDonnell and Lloyd2009).
The procedures of concurrent protocol analysis are transcription, segmentation, encoding, and analysis (Ericsson & Simon, Reference Ericsson and Simon1993; van Someren et al., Reference van Someren, Barnard and Sandberg1994; Foreman & Gillett, Reference Foreman and Gillett1997). Segmenting and encoding can be integrated into one step, in which coders simultaneously parse and encode the protocol. In theory, segmenting assumes the protocol is divided according to the designers' intentions, instead of verbalization events or syntactic marks (Ericsson & Simon, Reference Ericsson and Simon1993). This has been applied in recent protocol studies, in which designers' intentions are understood not only through verbal utterances, but also through their drawings and gestures (Goldschmidt, Reference Goldschmidt1991; van Someren et al., Reference van Someren, Barnard and Sandberg1994; McNeill et al., Reference McNeill, Gero and Warren1998). In the same way, one segment consists of pieces of information, which appear to have occurred simultaneously in the designer's mind, and constitute a set of coherent cognitive actions: physical, perceptual, functional, and conceptual (Suwa et al., Reference Suwa, Purcell and Gero1998). Finally, the coherent goal settings in segments were utilized in the group segments as units for encoding, referred to as episodes (Valkenburg & Dorst, Reference Valkenburg and Dorst1998).
After Cross (Reference Cross, Eastman, Newstetter and McCracken2001) effectively summarized the use of earlier design studies in protocol analysis, a number of observations can be made here on subsequent ones. First, the numbers of subjects in protocol experiments have increased, from comparisons between an expert and a single novice (Ho, Reference Ho2001; Kavakli & Gero, Reference Kavakli and Gero2002) to exploration among eight subjects or more (Liikkanen & Perttula, Reference Liikkanen and Perttula2009; Lemons et al., Reference Lemons, Carberry, Swan, Jarvin and Rogers2010). The work of Atman and his colleagues (Atman et al., Reference Atman, Chimka, Bursic and Nachtmann1999, Reference Atman, Cardella, Turns and Adams2005; Adams et al., Reference Adams, Turns and Atman2003), including over 100 participants and the work of Menezes and Lawson (Reference Menezes and Lawson2006) with 30 pairs of participants, were notable exceptions. However, quantitative protocol analysis using statistics is still rare. Second, the differences between freshmen and senior students or experts and novices have been the most popular research issue (Atman et al., Reference Atman, Chimka, Bursic and Nachtmann1999; Seitamaa-Hakkarainen & Hakkarainen, Reference Seitamaa-Hakkarainen and Hakkarainen2001; Kavakli & Gero, Reference Kavakli and Gero2002; Ball et al., Reference Ball, Ormerod and Morley2004; Kim et al., Reference Kim, Kim, Lee and Park2007). There is, however, little real continuity between these studies in terms of their findings. Third, there has been a notable increase in the number of studies of collaborative design (Turner & Turner, Reference Turner and Turner2003; Kan & Gero, Reference Kan and Gero2008; Kim & Maher, Reference Kim and Maher2008; McDonnell & Lloyd, Reference McDonnell and Lloyd2009). Finally, we find the same set of protocol data being analyzed by different researchers, such as DTRS4 and DTRS6 (Cross, Reference Cross2007; McDonnell & Lloyd, Reference McDonnell and Lloyd2009), and the same coding schemes used by different researchers to explore different aspects of design (Suwa et al., Reference Suwa, Gero and Purcell2000; Bilda & Demirkan, Reference Bilda and Demirkan2003; Kim & Maher, Reference Kim and Maher2008). However, we seldom encounter the findings of protocol analysis verified by different researchers using the same coding scheme.
3.1. Collaborative design studies using protocol analysis
Collaborative design studies have merited considerable attention (McDonnell, Reference McDonnell2005; McDonnell & Lloyd, Reference McDonnell and Lloyd2009). Related research methods include ethnographic field research (Tory et al., Reference Tory, Staub-French, Po and Wu2008), case studies (Kleinsmann & Valkenburg, Reference Kleinsmann and Valkenburg2008), interviews (Hellström, Reference Hellström2007), linguistic analysis (Dong, Reference Dong2005), and protocol analysis (McDonnell & Lloyd, Reference McDonnell and Lloyd2009). An important research theme in collaborative design studies using protocol analysis is reflection in action (Valkenburg & Dorst, Reference Valkenburg and Dorst1998; Stempfle & Badke-Schaub, Reference Stempfle and Badke-Schaub2002; Adams et al., Reference Adams, Turns and Atman2003). This model of design was proposed by Schön to describe the reflective nature of the design process in emphasizing problem-setting activities. The model's central activity is framing, which could be defined as setting up a desired goal, selecting boundaries for the design problem and criteria for evaluating solutions (Valkenburg & Dorst, Reference Valkenburg and Dorst1998; Hey et al., Reference Hey, Joyce and Beckman2007; Hey et al., Reference Hey, Yu and Agogino2009).
For our study we selected a canonical example of a protocol study that was recognized as a high-quality investigation by the design studies community, based on design paradigms of design theory, and composed of a limited number of coding schemes. Protocol analysis is notorious for its laborious, tedious, and time-consuming efforts. For a quantitative protocol analysis to be feasible, a concise coding scheme is needed that makes possible the encoding of a significant number of subjects.
3.2. Reflective practice in design teams
An example of a work on reflective practice in a design team (Valkenberg & Dorst, 1998) was selected for a number of reasons. It was chosen as the best design studies paper of the year. The coding scheme, derived from Schön's reflective practice, one of the paradigms in design studies, and consisting of four essential elements of reflective practice, was relatively concise. Finally, the results of the Valkenberg paper discuss the elements of reflective practice in the design process and their possible relationship to the performance of design teams.
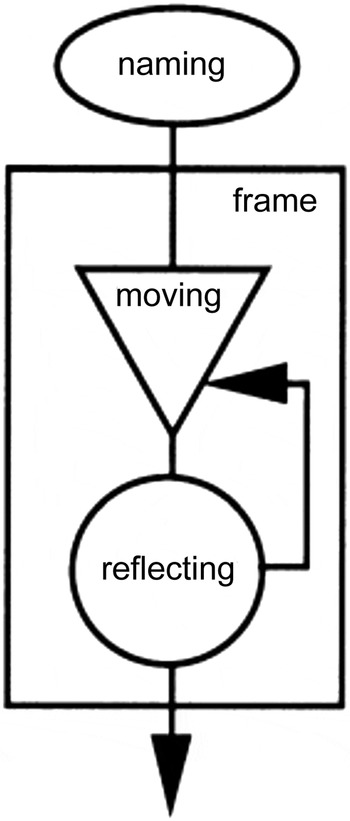
The encoding was based on an episode that included a series of protocols with the same goal. This is an essential departure from current protocol studies. The coding scheme consisted of four elements: naming, framing, moving, and reflection. These could be used not only to encode protocols but also to represent the design process graphically, as shown in Figure 1.
Visualizing the design process using reflection in action. Reprinted from “The Reflective Practice of Design Teams,” by R. Valkenburg and K. Dorst, 1998. Design Studies 19(3), 249–271. Copyright 1998 by Elsevier. Reprinted with permission.

Valkenburg and Dorst (Reference Valkenburg and Dorst1998) used episodes as encoding units to explore the high-level strategies of design teams, using the mechanism of Schön's reflection practice, and thereby explicated the basis of a successful design team. Such teams had a higher percentage of moving and reflection activities. Most of the moving activities happened within frames, along with the team's discussion. Reflection happened at the beginning of the design process, frequently overall, and at brief intervals. This means reflection should be evenly distributed throughout the design process, that is, that the average position should be toward the center of the design process. Finally, there was always a reflection after a series of moving activities. Based on the aforementioned findings, we proposed the following hypotheses about the relationship between the design process and design performance. The design performance was judged by design experts in terms of scores of different categories.
1. The percentage of specific activity in reflection in action is related to design performance.
2. The percentage of specific transition in reflection in action is related to design performance.
3. The average (segment) position of specific activity in reflection in action is related to design performance.
4. The average distance of a specific transition in reflection in action is related to design performance.
5. The percentage of the framing activity containing a certain number of activities is related to design performance.
6. The use of computer mediated collaboration will not affect the number of reflection and distance of specific transition
We next explored our protocol data in depth in relation to the above statements, to uncover any relationship between the design process and design performance in terms of reflection in action, using collaborative protocol data. The method and steps devised to test these hypotheses are described in the following sections.
4. METHODOLOGY
This research was a typical protocol study. Data were collected using think-aloud procedures of protocol analysis in which participants designed collaboratively. The experimental procedure commenced by reading out the instruction and design brief, followed by a warm-up, running the main experiment, a 5-min final design presentation, and concluding with an interview. A 5-min presentation and corresponding drawings were used as materials for expert judgment of the design results.
A design competition devised for this research was held, to recruit third year industrial design students from Taiwan. Groups of two were qualified to join the competition. Partners could be selected from classmates with their own choice for the concern that unfamiliar partners might influence the quality of the collaborative design process, and then impair the design quality. Because this study was interested in design quality and the design process, we decided to remove the variable of unfamiliarity. Ten groups of students, two-thirds of the class, participated in the design competition, where each team was given around 1 h to finish two design tasks using traditional and digital media.
The two tasks were to design USB flash drives: one should have the potential effects of protecting the user physically and the other should have the potential effects of waking up the user. Marketing and supporting information about current USB drives was provided. The degree of difficulty of both tasks was assessed similar to two design experts. The design brief provided a brief description of the design task, requirements for the form and style, requirements for the function, the target, and the ways of presenting the final results on a sheet of paper with images. In addition, marketing and supporting information about current USB drives, and criteria for assessing the final results, were provided. The following interview after the experiment was semistructured, and major questions were the following: How and when did you use sketches in your design projects? What was the influence of sketches on your design? How and when did you use computer-aided design tools in your design projects? What was the influence of these digital tools on your design? What do you think about the differences between sketches and digital tools? Do you have any comments to this experiment?
The data set, 20 sets of protocols of collaborative design, was used in a comparative study of the traditional and digital sketching environments, using a function–behavior–structure (Tang et al., 2010), and thus we only provide a brief verbal description of the experimental settings in the following section.
4.1. Experimental setting
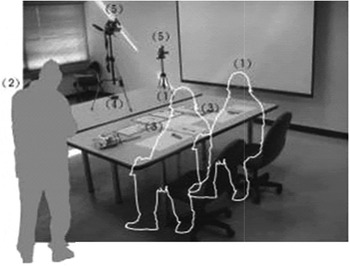
Two kinds of environmental setting were employed. The traditional environment entailed two participants sitting side by side in front of a table, using pen and paper. Figure 2 illustrates the collaborative design using traditional media where two subjects, marked (1), face to face. The experiment instruction and design briefs, marked (3), were provided. Two cameras, marked (5), and a digital camera, marked (4), were utilized to record the design process with the experimenter, marked (2), taking memos for observational findings.
The experimental setting using traditional media.

For the digital environment, two participants worked separately in different rooms. They had a shared sketching workspace using Ultra VNC, WACOM Digitizer, and ALIAS Sketchbook Pro, and could communicate face to face via webcam and MSN. The settings of the digital environment were devised to simulate a traditional sketching environment. Our previous study showed no significant difference between the traditional and digital environments in this setting in terms of encoded protocols using the function–behavior–structure coding scheme (Tang et al., Reference Tang, Lee and Gero2011).
Analysis included transcription of the protocol, segmentation, encoding protocols, and producing qualitative descriptions and quantitative results to verify our hypotheses. The protocol was parsed by the intention of the subjects (Ericsson & Simon, Reference Ericsson and Simon1993; McNeill et al., Reference McNeill, Gero and Warren1998). The coding schemes were reflection in action. Details of segmentation and the coding schemes are described in the following section.
4.2. Segmentation
Verbal utterances between members during the collaborative design process were transcribed into protocols, then parsed in accordance with the intentions of the subjects. Where there was a discontinuity or a change in the protocol idea, researchers separated it off to form a single segment. Segments therefore consisted of several words or sentences, representing a single design team intention. Each design process produced a different number of segments. The total number of segments were not necessarily related to the length of time, but were indicative of the amount of intention shift during the design process. Each segment was categorized into a single type from the coding scheme. A segment might contain only one utterance from a team member, or a conversation of the designers. The segments were encoded and by two encoders separately and compared collectively in terms of reflection in action. The discrepancies of encoded protocols were arbitrated together with the project supervisor, who had more than 10 years experience in protocol analysis.
This study used intention to parse the protocol. In order to compare our results to Valkenburg and Dorst (Reference Valkenburg and Dorst1998), we encoded the achieved goals in a series of segments, where the meaning of a goal is similar to the meaning of an episode. The basic unit of encoding, the segment, is smaller than an episode. In a half-hour period there were approximately six episodes in each protocol, while there were about 150 segments and on average six goals. Although Valkenburg and Dorst (Reference Valkenburg and Dorst1998) explored the “global” design strategy of the design teams, we investigated how the activity was “controlled locally,” informed by Schön's conception of the reflective practice of designers. After making some allowance for the different units of encoding, Valkenburg and Dorst's (Reference Valkenburg and Dorst1998) definitions of coders were adopted.
4.3. Coding scheme
The working definitions of the four elements in the study are as follows. When the team explicitly mentions parts of the design task or their analogy, we encode the activity as “naming.” For example, pillow, ear phone, slingshot. When the team frames a (sub)problem or (partial) solution to explore, we encode the activity as “framing.” For example, using flashlight to force them back, or, using computer drivers. Experimental actions like exploratory sketches, detailing ideas, sorting information, and discussing concepts, are encoded as “moving.” For example, who will you go to when encountering gangsters; or, the line should be smooth. An explicit critical reflection on earlier actions is encoded as “reflecting.” For example, not an external flashlight, too troublesome. Reflection can lead to reframing the problem, making new moves, or naming new issues, and is therefore regarded as an important activity in relation to design performance.
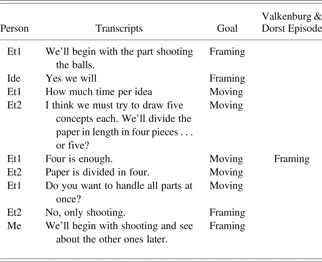
An example of the encoding is given, to show the differences of segmentation and their influence on the encoded results (see Table 1). This table contains a framing episode from Valkenburg and Dorst (Reference Valkenburg and Dorst1998). In this paper it is encoded as a framing goal with nine segments. Therefore, this study has finer units in terms of encoding, but still preserves the conception of episode in goals.
The encoded results of a framing episode

Note: After Valkenburg and Dorst (Reference Valkenburg and Dorst1998).
In this study, we used a refined definition of framing, and therefore the unit of reflection in action in this study is smaller. The reflection exists in terms of segments, instead of a long period of time of the design process as a rare phenomenon (Stempfle & Badke-Schaub, Reference Stempfle and Badke-Schaub2002).
5. ESTABLISHING PROTOCOL DATA
The first step to establish protocol data for the following statistical testing is to demonstrate the similarities between the encoded segments in traditional and digital environments in terms of the numbers of framing–naming–moving–reflection (FNMR), and the numbers of the transitions between FNMR. This indicates the environmental influence on the encoded results. If the influence is weak, we can use the 20 data sets as the base to conduct the following statistical analysis of the relationship between the design performance and the design process encoded by FNMR. If not, we can only analyze them as two groups of data.
5.1. Score of the design performance
Six expert judges, two from industry with more than 20 years of practical experience and four from education with more than 10 years of teaching experience on average, evaluated the participants' design results based on the 5-min presentation given at the end of the design process, as well as the sketches provided by each team. The sketches produced in traditional environments were scanned and then printed in color, as were the digital sketches from the digital environments. The experts were not informed that there were two kinds of media in the design process. Three expert judges as a group first read the scoring sheet with the explanation of the experiments. After the explanation, the experimenters stand behind the judges to avoid possible bias. They then scored each design results based on the sketches and the video presentation recorded in the end of each design process by the participants in the experiment.
Scores were given from 1 to 9 in terms of seven aspects with the following definition:
design concept: understanding of the design problem and the quality of proposed directions
function: usability and practicality of functions
material: the choice of materials and its use on design
scenario: the expression of how the design would be used and the clarity of the interaction between users and products
creativity: the exploration of the problem and the creative expression of the solutions
aesthetics: the aesthetical expression of the form and its relationship with functions
completeness: the completion of the requirements proposed by the design brief
The scores across different judges were evaluated in terms of their reliability. The Cronbach α value (0.833) indicated that the external consistency of the scores provided by six judges was reliable. The total scores of each team in the traditional and digital environments are listed in Table 2.
Total score of design performance of design teams A–J by respective environments

Teams A, B, C, E, and J performed better in digital environments, whereas teams D, F, G, H, and I performed better in traditional environments. The one-way analysis of variance indicated that there are no significant affect of environment type (F = 0.14, df = 1 p = 0.71 > 0.05). For the following analysis, we assume that environment does not affect the total score of each team.
5.2. The number of segments in FNMR
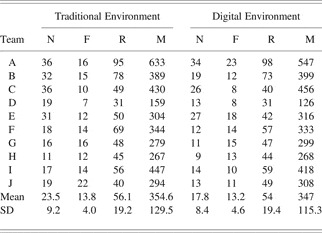
The raw protocol was encoded by two coders using reflection in action. The frequencies of the encoded protocol are shown in Table 3. Twenty design processes, including 10 teams and both media, were presented.
Frequencies of encoded protocol using reflection in action

Note: N, naming; F, framing; R, reflection; M, Moving.
For the chi-square test, the two categorical variables were environment and FMNR. The dependent categorical variable was the total number of segments pertaining to FMNR. The data were arranged in terms of design team. The significance of the chi-square statistic of each team was greater than 0.05, as shown in Table 4, so it can safely be assumed that the differences were due to chance variation. This implies that each environment had the same influence on the design process in each team. The high significance value (p > 0.05) suggests that the number of segments in each FMNR did not statistically differ because of environment.
Chi-square value and the significance of each team when comparing the distribution of the number of segments pertaining to FNMR across environments

Note: FNMR, framing–naming–moving–reflection.
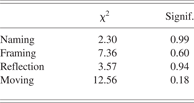
We used the chi-square value to discern differences in the numbers of segments pertaining to one FNMR across environments for 10 teams. Two categorical variables were environments and design team, and the dependent categorical variable was the total number of segments pertaining to FMNR. The data were arranged according to FNMR. The significance of the chi-square statistic of NFRM is greater than 0.05, so it is reasonable to conclude that discrepancies are due to chance variation, which implies that each environment exerts the same influence on the design process. The high significance value (p > 0.05) suggests the number of segments of FNMR does not statistically differ due to the environments, as shown in Table 5.
Pearson chi-square value and significance of each type when comparing the distribution of the number of segments pertaining to naming, framing, reflection, and moving across environments
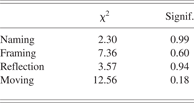
The environments of different media did not produce differences in the distribution of the encoded protocol of the design process. Therefore, we had 20 data sets to explore the relationship between the design process and design performance in terms of the number of segments in FNMR in the following sections.
5.3. The number of transitions between FNMR
Table 6 is a compact list of the number of naming, framing, reflection, or moving transitions among the twenty teams in traditional or digital environments. Transition types occurring less than five times were deleted for failing to meet the minimal requirement for statistical tests. The deleted transitions were N-N, N-F, N-R, F-N, F-F, F-R, M-F, R-N, R-F, and R-R.
Compact list of the number of transitions among naming (N), moving (M), framing (F), or reflection (R) of 10 teams (A–J) in the traditional (T), and digital (D) environments (after deleting transition types occurring <5 times)

For the chi-square test, the two categorical variables were environments and FMNR. The dependent categorical variable was the total number of segments pertaining to FMNR. The data was arranged in accordance with the design team. The chi-square statistic of each team was greater than 0.05, with the differences attributable to chance variation. The high significance value (p > 0.05) suggests that the differing number of segments in each FNMR was not statistically correlated to environment.
For each team, we used a chi-square test to examine the relationship between the type of transition and the environment. Data was extracted from the compact table, and any transitions occurring less than five times was excluded.
Two categorical variables were environments, and there were six kinds of transition. The dependent categorical variable was the total number of transitions. The significance of the chi-square statistic of each team was greater than 0.05. The causal role of chance variation in such instances implies that each environment has an equivalent influence on the transitions of each team's design process. The high significance value (p > 0.05) suggests that the number of transitions across the six kinds did not statistically differ because of environment. The results of teams A–J are listed in Table 7.
Chi-square value and significance of teams A–J, comparing the distribution of the number of transition types, across environment

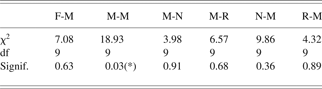
We further used the chi-square value to find the discrepancies between specific kinds of transitions across environments, for 10 teams. Two categorical variables were environment and team, while the dependent categorical variable was the total number of transitions pertaining to one of F-M, M-M, M-N, M-R, N-M, or R-M. The data were arranged according to type of transition. The significance of the chi-square statistics of five kinds of transitions was greater than 0.05, except M-M. For F-M, M-N, M-R, N-M, and R-M, differences were the byproduct of chance variation, which implies parity in environmental influence on the transitions. The high significance value (p > 0.05) suggests that the number of transitions did not statistically differ by environment with respect to the five kinds of transitions, as shown in Table 8.
Chi-square value and significance of each type of transition in comparing the distribution of the number of segments of each team across environments
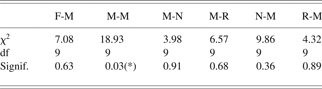
Note: F, framing; M, moving; N, naming; R, reflection.
*p > 0.05.
Consequently, we had 20 data sets to explore the relationships between design process and design performance in terms of the transitions F-M, N-M, M-N, R-M, and M-R. The five types of transition are examined in the following correlation test.
6. EXPLORING DESIGN PROCESSES USING REFLECTION IN ACTION
The purpose of this study was to quantitatively explore the relationship between the design process and design performance by reexamination of the qualitative findings of a previous design protocol study. The design process was represented by sequences of encoded segments of reflection in action, while the design performance was represented by the sum of scores provided by six judges evaluating the design team's final presentation and their description.
A nonparametric correction statistical test was used to examine correlations between the sum of scores and the variables that measure the design process. These variables include the number of segments of a specific type in FNMR, the number of transitions, the average segment position, the average segment distance of transition between FNMR, and mature framing. The statistical results were used to test the hypotheses derived from the previous study.
6.1. The percentage of a specific activity in reflection in action
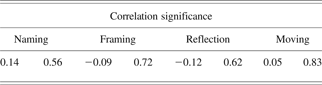
The four kinds of activities in the reflection in action coding scheme included naming, framing, reflection, and moving. The percentage of naming activity, for example, was the total number of instances divided by the total number of segments in the design process. The Spearman rho correction was used to examine the correlation between the sum of the scores and the percentage of four kinds of activities, respectively. The results revealed that all the corrections of the four pairs were not significant (p > 0.05), as shown in Table 9.
Nonparametric Spearman rho correlation tests between the sum of scores and the number of segments in terms of naming, framing, reflection, and moving
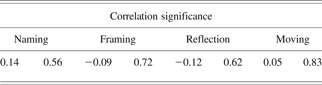
In regard to the reflective practice of design teams (Valkenburg & Dorst, Reference Valkenburg and Dorst1998), a comparison of the relative time spent on the different activities of the winning team and its lesser counterparts showed a difference of distribution. The number of reflection and moving activities in the winning team were almost two times greater, while the numbers of framing activities were 10 times less. However, this trend was not evident in our study with 20 participants.
We examined occurrences of reflection in our data, finding that the activities triggered by reflection did not always contribute to the design process. Some reflections were not followed properly, to form a new direction for the design process. Was a reflection to trigger a series of actions to form a partial solution or a subgoal, it would be beneficial for the design process.
6.2. The percentage of a specific transition in reflection in action
Sixteen kinds of transitions existed in the reflection in action coding scheme, five of which were deemed appropriate to conduct the correlation test, including the transitions between F-M, M-N, N-M, M-R, and R-M. The percentage of F-M transitions, for example, is its total number divided by the total number of all kinds of transitions in the design process.
The Spearman rho correction test between the sum of the scores and the percentages of five kinds of transitions, respectively, showed that all the corrections of the five pairs were not significant (p > 0.05), as shown in Table 10.
Nonparametric Spearman rho correlation test between sum of scores and number of transitions between framing (F), moving (M), naming (N), and reflection (R) in relation to design performance

According to the graphical representation of the theoretical model of reflection in action in Figure 1, the basic structure of reflection in action includes transition from framing to moving, and transition from moving to reflection. After reflection, a moving activity should take place to continue the reflective direction. Therefore, reflective practice in a design team should reveal a higher percentage of transition for F-M, M-R, or R-M. The meaning of bidirectional transitions between naming and moving was not clear. However, the connections of these transitions to design performance were not statistically significant.
6.3. The average (segment) position of a specific activity in reflection in action
The average segment position of a specific activity is the value of the sum of all segment numbers of a specific activity divided by the total number of this specific activity, divided by the total number of segments in the design process, as shown in Equation 1.

This number could indicate, for example, whether the occurrence of reflection activity was located more toward the beginning of the design process, or was evenly distributed instead. Table 11 lists the average segment positions of moving, naming, reflection, and framing activity for the 20 data sets. It shows that the average position of moving and reflection was more consistent, while the average position of naming and framing differed more noticeably across the 20 data sets.
Average segment position of moving (M), naming (N), reflection (R), and framing (F) of 10 teams (A–J) in traditional (T) and digital (D) environments as a fraction of the whole design process (%)

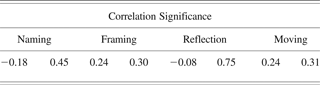
The Spearman rho value was used to examine the correlation between the sum of the scores and the average segment position of four kinds of activities, respectively. The results showed there was no significant correlation (p > 0.05), as shown in Table 12.
Nonparametric Spearman rho correlation tests between the sum of scores and the average segment position of framing, naming, moving, and reflection
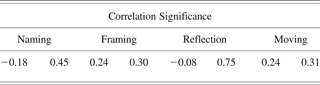
In support of the Schön-based description and patterns (Valkenburg & Dorst, Reference Valkenburg and Dorst1998), occurrences of reflection in the better design team were mostly located at the beginning of the project, and more frequent. The inferior design team reflected too late to intervene in the project. Therefore, the average segment position of reflection could be an indicator of design performance. In terms of framing activity, the better team developed five frames, distributed evenly throughout the process, while its counterpart only had one frame located at the end of the design process. We expected that the average segment position of framing could reveal some clues about the design performance. However, no significant connections were discernible between average segment position and design performance (p > 0.05).
6.4. The average distance of a specific transition in reflection in action
Markov Analysis was used to examine the average distance of a specific transition (Kan & Gero, Reference Kan and Gero2008, Reference Kan, Gero and Chakrabarti2009a, Reference Kan, Gero, Noell, Bergendahl, Grimheden, Leifer, Skogstad and Badke-Schaub2009b). The percentage of transitions between FNMR was converted into a transition matrix in which the numbers represented the probability of an activity in relation to the next activity. The mean first passage time was the average number of steps traversed before reaching a particular state from other states, and was obtainable from the transition matrix (Kemeny & Snell, Reference Kemeny and Snell1960). This mean first passage time is the average segment distance between transitions in this study. We calculated the average segment distances between transitions F-M, M-N, N-M, M-R, and R-M for 20 data sets, as shown in Table 13. For example, the mean of the average segment distance between M-R was 8.21. This means on average, for the 20 data sets, that an occurrence of moving activity traveled 8.21 segments to reach the next reflection activity. Moreover, the data shows that the moving activities closely followed the framing, naming, and reflection activities, given that the mean of the average segment distance between transitions F-M, N-M, and R-M is 1.28, 1.49, and 1.28, respectively.
Averaged segment distance between framing (F), moving (M), naming (N), and reflection (R) of 10 teams (A–J) in traditional (T) and digital (D) environments (measured by Markov first order)

The Spearman rho value was used to examine the correlation between the sum of the scores and the average segment distance of five kinds of transitions, respectively. The results showed no significant correlation (p > 0.05), as shown in Table 14.
Nonparametric Spearman rho correlation tests between the sum of scores and the averaged distance between framing (F), moving (M), naming (N), and reflection (R) (Markov first order)

Valkenburg and Dorst (Reference Valkenburg and Dorst1998) reveal little in the way of information pertinent to average segment distance between transitions. However, in their study the better team demonstrated a shorter distance from moving activity to reflection activity, because they regularly reflected on what they had achieved. Still, no significant connections were found between average segment distance and design performance (p > 0.05).
Having rejected the previous hypotheses, we finally explored one of the essential ideas of the reflection in action model. This describes the design process as problem framing or finding, rather than solution finding, to emphasize the exploratory nature of design. Although the design process exhibits some tentative, exploratory moves via sketches, the designers' moves still need a frame to direct the team's goal. We continued our examination of goal setting and framing to ascertain its relationship to design performance.
6.5. Mature goal setting and framing
Framing can be defined as setting up a temporal direction toward a subproblem or a partial solution in the design process. It could be a new framing to deal with new design issues, or a modification of the current framing, namely, reframing. In our coding system, each framing occurs in a segment, not an episode.
When a series of consecutive design activities work toward the same direction or deal with a similar design issue, we encode a goal to attach to this series of activities. This goal, therefore, contains these activities. These activities could be naming, framing, moving, and reflection, in our coding scheme. The number of activities within a goal varies. Framing activity is the signal of the starting point of a subproblem or a partial solution, whereas a goal indicates the length of a subproblem or a partial solution.
Our encoded protocols showed the following situations. Most of the activities in a design process were included in a goal. Although the length of a goal varied, a design team with better scores tended to have a greater number of longer goals. This tendency was also evident in the findings of Valkenburg and Dorst (Reference Valkenburg and Dorst1998).
To be able to measure the situation, we defined a goal containing more than 10 segments as amature goal. Given that the number of chunks of human memory is 7 ± 2 (Miller, Reference Miller1956), we assume that more than 10 activities within the same goal could not happen by chance. Thus, this goal has been continued for a design purpose. It has been carried out and examined by designers, and therefore it could be regarded as mature.
Moreover, if a mature goal contains a framing activity, this framing activity is regarded as mature framing. Within a mature goal, the included framing activity directs any following activities, and the latter ensures that this framing is thoroughly explored.
Tang and Lee (Reference Tang, Lee and Gero2008) found that the percentage of mature framing can account for the separation between the top five and bottom five teams. A design process consisting of more than 70% mature framing was among the top five ranking teams, that is, the higher the number of mature framing occurrences, the better the final rank. This result is consistent with the visualization of the results in Valkenburg and Dorst (Reference Valkenburg and Dorst1998), where the winner, Team Tecc, had three long framings, and the loser, Delft Pitchbulls, had only one long framing.
We calculated the numbers of mature goals and mature framings. These were then divided by the total number of goals and framing activities to obtain the percentages of mature goal and mature framing for 20 data sets, as shown in Table 15. The one-way analysis of variance indicated there are no significant effect of media type on mature framing (F = 0.04, df = 1, p = 0.84 > 0.05) and mature goals (F = 0.01, df = 1, p = 0.92 > 0.05).
The Proportion of mature framing (MF) and mature goal setting (MG) for each team (A–J)

Note: T, traditional; D, digital.
The Spearman rho value was used to examine the correlation between the sum of the mature goals and mature framing for 20 data sets. The percentage of mature goals was not significantly correlated (p < 0.05) with the sum of the scores. Creativity and scenario proved more noteworthy in this respect, as shown in the top three rows of Table 16.
Nonparametric Spearman rho correlation test between the sum of scores and the percentages of mature framing (MF) and mature goal (MG)

*p < 0.05. **p < 0.01.
An interesting finding is that the percentage of mature framing is significantly correlated (p < 0.01) with the sum of scores, representing design performance. The correlations between the percentages of mature framing and the scores of seven criteria were further examined. All the criteria scores had significant correlations (p < 0.05) with the percentage of mature framing, with the exception of the function score (p = 0.1).
On the basis of these statistical results, it is apparent that a percentage of the framing activity containing more than 10 activities was related to design performance. A higher percentage of mature framing in a team indicates better design performance. Moreover, in terms of the reflection in action coding scheme, the percentage of any kind of activity, the percentage of any kind of transition, the average segment position of any kind of activity, and the average segment distance of any kind of transition, are not significantly correlated with design performance. For verifying the results, stepwise linear regression analyses were used to analyze all variables with 95% confidence intervals level. The statistical results show the proportion of mature framing is the only variable that has significant relationship with the sum of scores (R 2 = 0.362, p = 0.005 < 0.05).
The next section considers the possible meaning of the statistical results. Moreover, the significance of this study for protocol analysis and for the design research community more generally, warrants discussion.
7. DISCUSSION
The results confirm one of the qualitative findings of a previous study on the reflective practice of a design team, while some previous findings could not be verified in our data sets. However, two important issues were raised about the complexity of design activities and how design studies can explore this complexity.
7.1. The complexity of design activities
This study provides a quantitative viewpoint showing the complexity of the design process, as well as the ill-defined connections between design processes and design performance. The failures of statistical support for our first four hypotheses demonstrate a simple mapping between calculations of encoding protocols does not reveal much about the inner relationships of the design process. Mature framing, however, is the essence of the theoretical model of reflection in action, and this study has statistically confirmed its relationship with design performance. Therefore, we can postulate that the concept of reflection in action captures the nature of the design process. Moreover, the six most frequent transitions readily map onto the structure of reflection in action. They are N-M, F-M, R-M, M-N, M-R, and M-M, so that they are theoretically reasonable. In contrast, the infrequent transitions do not accord with the theory and practice, for example, R-R. A designer tends not to reflect on the reflection of his/her previous moves. Therefore, we have shown that the reflection in action coding scheme is capable of capturing some of the complexity of the design process.
7.2. Local reflection and global reflection
Reflection plays an important role in reflection in action. A designer conducts exploratory experiments in his/her actions in the design process, namely, moving in the coding scheme. Reflection aims to examine the appropriateness of temporary assumptions about the design situation in actions, in the interest of directing design moves toward the attainment of satisfactory results.
There are two kinds of definition about reflection, which have to do with the number of intentions and their durations. The present study utilized a local reflection. It contains a single action pertaining to a previous move and thus has a short duration. It is in effect similar to “see-as” and “see-that” (Goldschmidt, Reference Goldschmidt1991). A global reflection contains a series of actions with the same subgoal pertaining to the previous subgoal, and thus has a longer duration. A global reflection is based on an episode, as defined by Valkenburg and Dorst (Reference Valkenburg and Dorst1998), in which a reflection occurs.
Local reflections indicate the number of ideas that have been further considered and might be related to the richness of ideas in the design process. Global reflections indicate the number of subgoals in the design process that may be related to the quality of problem solving, and thus to the final design performance and even to creativity.
Our definition of mature framing is comparable to global reflection. Valkenburg and Dorst (Reference Valkenburg and Dorst1998) regard the number of global reflections as related to design performance, while the statistical examination in our study demonstrates the relationship between the percentage of mature framings and design performance. We obtained a similar result from qualitative observation and quantitative tests.
Mature framing refers to purposeful continuous efforts that are directed toward a subgoal or subsolution. The number captures some essential quality of the design process. In design pedagogy, students generate many ideas but often fail to explore them any further. A lack of related skills, knowledge, and design strategy, prevents them from exploring and testing possibilities. Those who exhibit and pursue ideas/subgoals can often attain better results.
7.3. How to explore the complexity of design activities
Most design researchers regard design studies as a difficult subject to explore. Therefore, it is not hard to understand why the majority of protocol studies utilize a qualitative approach. This study demonstrated the possibility of a quantitative and empirical reexamination of previous studies, in acknowledgement of the need for a scientific method to explore human behaviors, as proposed by Stanovich (Reference Stanovich2010). In protocol analysis, there is a need to reapply a previous coding scheme and analytical structure to facilitate reexamination of the results. The design community needs to strike a balance between quantitative and qualitative research. Qualitative observation and case studies are ideal for eliciting some features of the design process for hypotheses to explore further. Quantitative studies and more controlled experiments could further identify the validity and reliability of these findings.
7.4. The trade-off of the coding scheme
The coding scheme played a vital role in representing the design process, to reveal information related to our research purpose. Because of considerations of affordable time and labor, the complexity of a coding scheme affects the amount of protocol data that can be analyzed in a study. A complex coding scheme that reveals multilayers and interlinks in the design process can only produce a limited number of results (Suwa et al., Reference Suwa, Gero and Purcell2000). Conversely, a concise coding scheme with less elements is feasible of producing a large number of results regarding specific aspects of design, such as current research. A coding scheme is like a lens through which researchers adjust the similarities and variances among participants. A concise coding scheme might reduce the complexity of the design process and the differences between participants at the same time, while a rich coding scheme preserves the complexity and reduces the similarities simultaneously. Therefore, we have two possible paths toward protocol analysis. Because we have had a large number of qualitative studies regarding different aspects of designing, more quantitative protocol studies, with a concise coding scheme, should be encouraged. By these means, we can obtain more data sets to verify the results in terms of intergroups or intragroups.
8. CONCLUSIONS
This study demonstrates a systematic exploration of protocol data in collaborative design processes. Five hypotheses of collaborative design were proposed after reviewing the previous literature. These were quantitatively examined using protocol analysis and the coding schemes of reflection in action for verifying previous findings. The quantitative examination included 20 data sets that related variables were verified no significant affected by the media type for statistical tests. The major results are as follows:
1. The percentages and average segment positions of FNMR activities in reflection in action were not statistically related to design performance.
2. The percentages and the average segment distances of transitions among F-M, N-M, M-N, R-M, and M-R in FNMR were not statistically related to design performance.
3. The percentage of mature framing activity is statistically related to design performance. A good design process would exhibit a framing activity that contains several activities of moving and reflection. The results fulfill our purpose of using design paradigms to evaluate the collaborative design process of traditional and digital media, although further study is still needed.
4. The digital and traditional environments in our experiment's setting were proven to be similar in terms of the reflection in action coding scheme. This is in keeping with our previous study using different coding scheme (Tang et al., Reference Tang, Lee and Gero2011). Therefore, we have more confidence in the similarity of these two environments
This paper has the potential to contribute to design education and design cognition. In terms of the former, this study has shown that it is important for problem framing to incorporate sufficient efforts and moves, so that this framing can really impact the design performance. This insight could be incorporated into pedagogical settings. For design cognition, we verified two findings of previous studies: the similarity across environments, and the importance of mature framing. Although further research is required, the results have contributed to the establishment of solid findings in design cognition.
ACKNOWLEDGMENTS
We thank Prof. John Gero, Dr. Jeff Kan, Prof. David C. Brown, and Dr. Gareth Paterson for the methodological discussion in the DCC'10 workshop; Miss Yuying Lee and Miss Gwen Hsiao for their support in encoding and analyzing protocols; and Taiwan NSC for support under Grant NSC 97-2221-E-011-082.
Hsien-Hui Tang is an Associate Professor in the Department of Industrial and Commercial Design, National Taiwan University of Science and Technology, and Codirector of the Design Information & Thinking Lab. He received his master's degree in industrial design at National Taiwan University of Science and Technology and his PhD at the Key Center of Design Computing and Cognition at the University of Sydney. His research interest is in design thinking of designers and users.
Yuying Y. Lee received her master's degree in industrial design from the Department of Industrial Design at Chang Gung University. Her research interest was in design thinking under the supervision of Dr. Hsien-Hui Tang. She was also a member of the Design Information & Thinking Lab. Yuying is currently a Product Designer.
Wenzhi Chen is an Assistant Professor and Head of the Department of Industrial Design at Chang Gung University. He is also the Codirector of the Design Information & Thinking Lab, which is colocated in the Department of Industrial Design, Chang Gung University, and the Department of Industrial and Commercial Design, National Taiwan University of Science and Technology. He received his master's degree in industrial design and a PhD in design, both at the National Yunlin University of Science and Technology. His research interest is in computer-mediated design education.