I. INTRODUCTION
Compound casting is one of the economic techniques used for producing different metallic couples. Reference Papis, Hallstedt, Loffler and Uggowitzer1–Reference Dezellus, Milani, Bosselet, Sacerdote-Peronnet, Roubyb and Viala8 In this process two metallic materials—one in solid state, the other in liquid state—are brought into contact with each other. In this way, a diffusion reaction zone forms at the interface and joins two materials together. Reference Volder9 In the compound casting process, period for which the insert is in contact with the melt (contact time) is a very important parameter to achieve a good joining between two metals. When the contact time is too short, good bonding cannot be achieved while a long contact time can lead to melting of the insert or form extra harmful intermetallics at the interface. There are many factors that can affect the contact time, such as the volume ratio of the melt and the insert, size of the insert and cast, pouring temperature, preheat temperature, and gating system. Reference Horikawa, Ito, Noguchi and Nakamura2,Reference Emami, Divandari, Arabi and Hajjari10 Considering all these factors together for the prediction of the contact time is too difficult and needs so many try and error experiments. Heat transfer and fluid flow simulations can be helpful for estimating the contact time and hence the state of bonding at the interface in the compound casting process.
Few efforts have been performed to simulate the compound casting process. Noguchi et al. Reference Horikawa, Ito, Noguchi and Nakamura2,Reference Noguchi, Horikawa, Nagate, Nakamura and Sato11 applied solidification simulation to predict the temperature distribution during compound casting of steel/cast iron couples. They examined different gating systems and found that the necessary contact time to achieve a good bonding between steel inserts and cast iron melts is 50–100 s. They also simulated the effect of sample size (with same volume ratio) on contact times for different samples and concluded that the suitable volume ratio needed for good bonding is not the same for samples with different sizes. Recently, some researchers have used compound casting to produce Al/Mg light metal couples. Reference Guangchen, Alan, Yiqing and Anil12–Reference Hajjari, Divandari, Razavi, Homma and Kamado15 During compound casting of Al/Mg couples, brittle intermetallic compounds such as Al12Mg17 and Al3Mg2 that can be deleterious to the bonding strength form at the interface. The formation of these intermetallic compounds is dependent on the contact time between the magnesium melt and aluminum insert and consequently is the key point for achieving a good bonding in Al/Mg couples. Reference Papis, Loeffler and Uggowitzwr13,Reference Hajjari, Divandari, Razavi, Emami, Homma and Kamado14
In this work, transient heat transfer and fluid flow during compound casting of Al/Mg light metals were simulated to determine the contact time in different positions of the samples. For this purpose, conservation equations of mass, momentum, and energy using FLOW-3D software were solved. For validity of the model, the magnesium melt was cast around aluminum insert and the formation of intermetallic compounds at the interface of Al/Mg couples was investigated by using optical microscopy.
II. MATHEMATICAL FORMULATION
To simulate the compound casting of Al/Mg couple, the following assumptions have been considered: (i) The fluid is Newtonian and incompressible, and the flow is laminar. (ii) Melting and solidification of aluminum insert are neglected and only convective and conductive heat transfers in the insert are calculated. (iii) All thermal properties of the molten magnesium, the aluminum insert, and the sand mold are constant and independent of temperature, except for specific heat and thermal conductivity of magnesium.
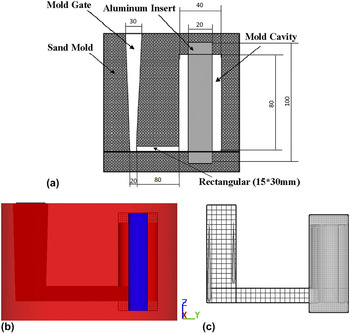
In this study, the geometrical model comprises of a sand mold with 180 mm diameter and 120 mm height, a cylindrical aluminum insert with 20 mm diameter and 100 mm height, which is mounted in the sand, the magnesium melt with 40 mm outer diameter and 80 mm height, and a gate. The mold dimensions and geometry of the model are shown in Figs. 1(a) and 1(b), respectively. A structured and non-uniform grid system is used, as shown in Fig. 1(c). Coarser grids for the gate and finer grids for the cast are used. Because of symmetry, only half of the work piece is considered.
(a) Mold dimensions, (b) geometry of the model, and (c) grid system used in the model.

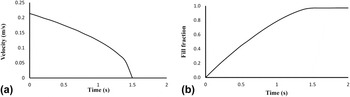
The simulation begins with pouring of the molten magnesium at 700 °C into the mold from the inlet. Based on the measurements, the molten metal fills the mold in about 1.5 s. Because the molten metal enters the mold under a variant velocity in real cases, a parabolic function of time, as illustrated in Fig. 2(a), is defined on the inlet boundary considering the effect of gravity. From the result of simulation and according to Fig. 2(b), the mold cavity fills in about 1.5 s which is in good agreement with the experimental filling times.
(a) Molten magnesium feed speed over time for inlet boundary and (b) mold fill fraction over time for initial 2 s.

A. Governing equations
Considering the model assumptions and the model conditions, governing equations of mass, momentum, and energy are presented in Eqs. (1)–(3), respectively,
 $${{\partial \rho } \over {\partial t}} + \nabla \cdot \left( {\vec V\rho } \right) = {\dot m_{\rm{s}}}\quad ,$$
 $$\rho \left[ {{{\partial \vec V} \over {\partial t}} + \left( {\vec V \cdot \nabla } \right)\vec V} \right] = - \nabla P + \mu {\nabla ^2}\vec V + {F_{\rm{b}}} + {\dot m_{\rm{s}}} \cdot \vec V - K\vec V\quad ,$$
 $$\rho \left[ {{{\partial h} \over {\partial t}} + \left( {\vec V \cdot \nabla } \right)h} \right] = \nabla \cdot \left( {{k \over C}\nabla h} \right) - \nabla \cdot \left( {\rho \vec V{h_{{\rm{sl}}}}} \right)\quad ,$$
where ρ is the cell density, t is the time,
 $\vec V$
is the velocity vector,
 ${\dot m_{\rm{s}}}$
is the mass source term, P is the hydrostatic pressure, μ is the fluid viscosity, F
b is the buoyancy force, K is the drag coefficient for porous media, h is the enthalpy, k is the thermal conductivity coefficient, C is the specific heat, and h
sl is the latent heat of fusion. The cell density, the mass source term, and the buoyancy force are calculated and expressed by Eqs. (4)–(6), respectively,
 $$\rho = {\rho _0}F\quad ,$$
 $${\dot m_{\rm{s}}} = {\rho _0}{\dot F_{\rm{s}}}\quad ,$$
 $${F_{\rm{b}}} = \rho \beta \left( {T - {T_0}} \right)g\quad .$$
In above equations, ρ0 is the fluid density, F is the fraction of fluid,
 ${\dot F_{\rm{s}}}$
is the rate of volume fraction of fluid associated with mass source in the mass equation, β is the thermal expansion coefficient of the melt, T
0 is the ambient temperature, and g is the gravity coefficient.
Reference Cho, Lim and Farson16,Reference Cao, Yang and Chen17
B. Tracking of free surface
To track free surface during filling of the mold, the volume of fluid (VOF) algorithm according to Eq. (7) is used. This equation tracks the free surface of the molten magnesium over time by using fraction of fluid (F) parameter,
 $${{\partial F} \over {\partial t}} + \nabla \cdot \left( {\vec VF} \right) = {\dot F_{\rm{s}}}\quad .$$
Three different cases are possible for F. If F = 0 means that the cell is empty, if F = 1 means that the cell is full of fluid, and if F is between 0 and 1 means that the cell is partially filled with fluid and so this cell is on the free surface. Reference Cho, Lim and Farson16,Reference Cao, Yang and Chen17
C. Tracking the solid–liquid interface
The linear enthalpy–temperature relationship, Eq. (8), is used to tracking the solid–liquid interface and thus the enthalpy of each cell is determined by the fluid temperature,
 $$h = \left\{ {\matrix{ {\rho CT} & {\left( {T \le {T_{\rm{s}}}} \right)} \cr {\rho C{T_{\rm{s}}} + \rho {h_{{\rm{sl}}}}{{T - {T_{\rm{s}}}} \over {{T_{\rm{l}}} - {T_{\rm{s}}}}}} & {\left( {{T_{\rm{s}}} \lt T \le {T_{\rm{l}}}} \right)} \cr {\rho C{T_{\rm{s}}} + \rho {h_{{\rm{sl}}}} + \rho C\left( {T - {T_l}} \right)} & {\left( {{T_{\rm{l}}} \lt T} \right)} \cr} } \right.\quad ,$$
where T s is the solidus temperature and T l is the liquidus temperature. Reference Cho, Lim and Farson16,Reference Cao, Yang and Chen17
D. Modeling of mushy zone
In the mushy zone, the amount of solid phase in the fluid is determined using the temperature ratio. Then, based on critical solid fraction F Cr and coherent solid fraction F s, the mushy zone is divided into three parts. Finally, the drag coefficient and the fluid viscosity are calculated in each part of mushy zone as mentioned below.
The first part of mushy zone is the cells in which the solid fraction is less than the coherent solid fraction. In this part, the fluid viscosity is calculated according to Eq. (9),
 $$\mu = {\mu _0}{\left( {1 - {{{F_{\rm{s}}}} \over {{F_{{\rm{Cr}}}}}}} \right)^{ - 1.55}}\quad ,$$
where μ0 is the dynamic viscosity. The second part of the mushy zone is the cells in which the solid fraction is between the coherent solid fraction and the critical solid fraction. In this part, the mushy zone is assumed to be a porous medium. The drag coefficient is given and the fluid viscosity is expressed using Eq. (9),
 $$K = {C_0}{{\mathop {{F_{\rm{s}}}}\nolimits^2 } \over {{{\left( {1 - {F_{\rm{s}}}} \right)}^3} + \delta }}\quad .$$
In the above equation, C 0 is the constant drag coefficient and δ is the positive zero to avoid dividing zero. Eq. (10) represents the frictional dissipation in the mushy zone based on the Carman–Koseny equation, which is obtained from the Darcy model. In the third part, the local solid fraction is greater than the critical solid fraction. According to Eq. (10) and the infinite drag coefficient, there is an infinite resistance against fluid flow and thus fluid flow is stopped. Reference Cho, Lim and Farson16,Reference Cao, Yang and Chen17
E. Boundary condition
In symmetry boundary, all fluid velocity components (u, v, and w) and temperature changes are equal to zero according to Eqs. (11) and (12). On the other boundary, heat loss by conduction and convection is set according to Eq. (13), Reference Cho, Lim and Farson16,Reference Cao, Yang and Chen17
 $${{\partial u} \over {\partial x}} = v = {{\partial w} \over {\partial z}} = 0\quad ,$$
 $${{\partial h} \over {\partial y}} = 0\quad ,$$
 $$- k{{\partial T} \over {\partial n}} = {h_{\rm{c}}}\left( {T - {T_0}} \right)\quad ,$$
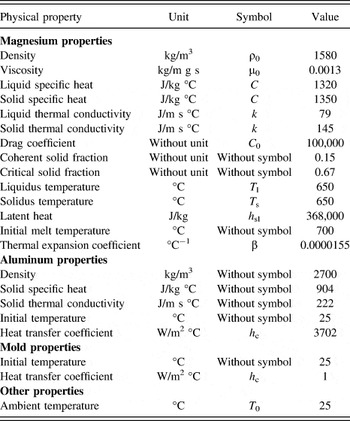
where u, v, and w are the velocity components, h c is the convection coefficient, and T 0 is the ambient temperature. All material properties and parameters for the simulation are listed in Table I. It should be noted that, for simulation of the process, the convection coefficient between magnesium melt and aluminum insert achieved by Hajjari et al. Reference Hajjari, Divandari, Razavi, Emami and Kamado20 has been used.
Physical properties used for model. Reference Hajjari, Divandari, Razavi, Homma and Kamado15,Reference Cho, Lim and Farson16,18,Reference Farzadi, Serajzadeh and Kokabi19

F. Numerical procedure
To simulate the process, the cast is defined as void before pouring. After development of the model, all governing equations are solved by FLOW-3D software through the following steps:
-
(i) Approximation of new speed velocity based on the previous time step.
-
(ii) Determination of pressure formulation by using generalized minimal residual method (GMRES) and then solution of the energy equation.
-
(iii) Update free surface by using VOF method.
The above steps were repeated at each time interval.
III. EXPERIMENTAL PROCEDURE
Al/Mg couples were produced by compound casting process. Commercially pure magnesium was cast around the aluminum inserts at 700 °C. To study the interfacial microstructure of the Al/Mg couples in the compound casting process, specimens were cut from the bottom, middle, and top parts of the samples perpendicular to the cylindrical insert. After etching, specimens were examined using an Olympus BX51M optical microscope (Olympus Corporation, Tokyo, Japan). More details about preparing the samples have been described in Ref. Reference Hajjari, Divandari, Razavi, Emami, Homma and Kamado14.
IV. RESULTS AND DISCUSSION
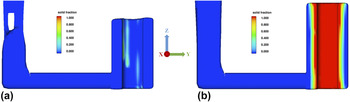
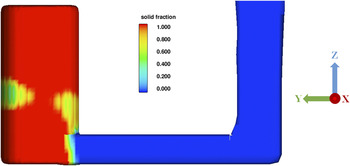
In Figs. 3 and 4, solid fraction fields for inner and outer surfaces of the magnesium cast have been displayed, respectively. As shown in Fig. 3(a), due to the high heat transfer coefficient between the magnesium melt and aluminum insert, simultaneously filling the mold, a mushy zone has been created in some regions of the inner magnesium cast surface. Considering Fig. 3(b), it can be concluded that the time for complete solidification of the molten magnesium surface in contact with the aluminum insert is lower than 4 s.
Solid fraction for the inner cast surface for (a) 1 and (b) 4 s.

Solid fraction for the outer cast surface for 20 s.

As can be seen in Fig. 4, there are some parts at the middle and bottom of the mold that are solidified later than others. After the initial transient conditions in which the solidification rate is high, the mold and the insert temperature increase over the time. Then, heat dissipation from outer surfaces determines the solidification rate. Heat dissipation at the middle and bottom of the mold is lower than its top and as a result, the molten magnesium on the middle and bottom of the outer surface is solidified later than the other parts. After spending about 20 s, solidification boundaries move to the mold gate and the molten magnesium at the gate starts to be solidified.
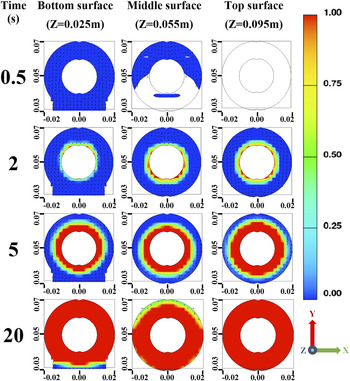
Two-dimensional solid fraction fields in different positions of the magnesium cast are shown in Fig. 5 for different times of the process. After 0.5 s of pouring, the bottom of the mold is completely filled with molten magnesium and the middle part is partially filled. At the same time, no molten metal is detected at the top level of the mold. The solidification process is started in all of the mold levels after 2 s and the solidified fraction of the melt shows a decrease from the top to the bottom level of the mold. All molten magnesium in contact with the insert is solidified in 5 s. The molten magnesium enters around the insert from the bottom level of the mold. Simultaneously filling the mold from bottom to the top, because of the high heat transfer coefficient and the high temperature gradient between the cast and insert, molten magnesium temperature decreases and the melt that is reached to the top level of mold is in a lower temperature. Therefore, higher amounts of solid fraction in this position of the mold are created. After 20 s, as previously mentioned, almost all parts of the magnesium cast (except for small parts of middle and bottom of the mold due to lower heat deception) were in solidified condition and the solidification boundary is at the mold gate.
Two-dimensional solid fraction for top, middle, and bottom of the cast for 0.5, 2, 5 and 20 s.

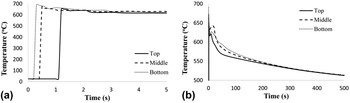
The time that molten magnesium is in contact with the aluminum insert and remains in the liquid state is defined as contact time. This parameter has a significant effect on the formation of intermetallic compounds as well as joint properties. Reference Horikawa, Ito, Noguchi and Nakamura2,Reference Emami, Divandari, Arabi and Hajjari10 According to the results shown in Fig. 5, it is clear that the contact time is different in various levels of the mold. Calculated temperature histories for three points located at top, middle, and bottom of the magnesium cast at the very near position from the interface with the aluminum insert is shown in Figs. 6(a) and 6(b).
Temperature history in top, middle, and bottom points at the interface during compound casting for (a) initial 5 and (b) 500 s.

In Fig. 6(a), the temperature histories at the interface of magnesium melt and aluminum insert for initial 5 s of the process are shown. The graphs in this figure show that the molten magnesium arrives to the bottom, middle, and top levels of the mold, respectively. Furthermore, these results confirm that when the molten magnesium arrives to the middle and top levels of the mold it has lower temperature than its bottom. Molten magnesium enters the casting through the bottom gate and loses its temperature. When conductive and convective heat transfers become equal to the solidification latent heat on the interface, the lines on the diagram will be in the horizontal position (after about 3 s).
According to Fig. 6(b), after the completion of solidification around the insert, the temperature of whole solidified parts decrease and after about 200 s all points near the interface will experience same temperatures.
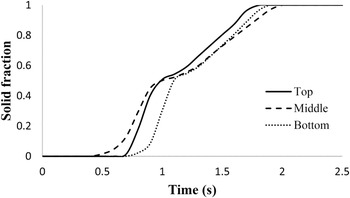
Figure 7 shows the change in the solid fraction near the interface for initial 2.5 s of the process. This figure shows that the solidification process at the interface begins after about 0.5 s and finishes before 2 s for all of the mold positions. Solidification process starts in middle, top, and bottom levels of the interface, respectively. The delay for solidification on the bottom of the interface is due to a higher melt temperature at the bottom of the mold and also entering new molten magnesium from the gate. Solidification process at the interface is then finished at top, bottom, and middle of the interface, respectively.
The solid fraction at the interface for top, middle and bottom of the mold during compound casting for initial 2.5 s.

The contact time between the magnesium melt and aluminum insert at different positions of the interface was calculated considering the time between magnesium melt arrival to the aluminum insert [Figs. 6(a) and 6(b)] and finishing the solidification (Fig. 7).
According to the data in Figs. 6 and 7, the contact time for top, middle, and bottom of the interface were calculated as 0.8, 1.6, and 1.7 s, respectively. As soon as the molten metal is in contact with the cold aluminum insert, the temperature at both sides of the interface starts to change. In one side of the interface, the temperature of the magnesium melt drops and on the other side, the temperature of the aluminum insert increases. As a consequence, the magnesium melt with a lower temperature flows toward the middle and top of the mold.
Molten magnesium with the lowest temperature arrives to the interface at the top of the mold and this leads to a lower contact time at the top of the mold.
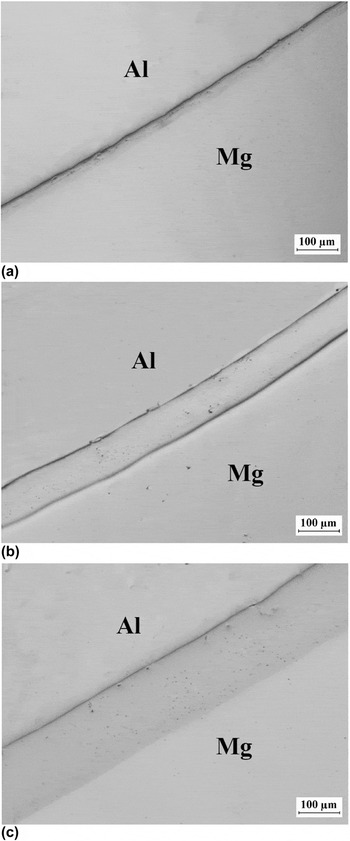
Typical microstructures of the interface at different positions of the sample are shown in Fig. 8. The thickness of the intermetallic compounds at the interface is decreased from about 150 μm at bottom to 90 μm at middle and 30 μm at the top level of the mold. This is in agreement with the lower contact time calculated for top part of the sample. It seems that to achieve a uniform interface throughout all positions of the sample, it is necessary to increase the pouring rate and also using multigate casting system.
Optical microscope images for (a) top, (b) middle, and (c) bottom of the interface.

V. CONCLUSION
In this work, the contact time between molten magnesium and aluminum insert during compound casting, for different positions of the mold, was simulated. For this purpose, a three-dimensional transient model and FLOW-3D software were utilized. In this model, the effects of gravity, buoyancy forces, and heat transfer by conduction and convection were considered. After simulation, contact time at the interface in bottom, middle, and top of the mold was calculated as 1.7, 1.6, and 0.8 s, respectively. Optical microscope images from the interfacial microstructure at these points showed good agreement with simulation results and confirms the validity of the model. Simulation results show that, by moving from bottom to top of the mold, the contact time between the aluminum insert and magnesium melt at the interface decreases. On the other hand, the results of experimental observations at the interface showed a decrease in the formation of intermetallic compounds from bottom to top of the Al/Mg interface. To achieve a uniform interface in whole of the Al/Mg interface, increasing the casting speed and using multigate casting system are necessary.