Introduction
The Conference of the Parties (CoP) to the Convention on Biological Diversity (CBD) emphasised the imperatives of sharing data and making regular, timely assessments to support the science-policy interface and enhance the implementation of the Strategic Plan for Biodiversity 2011–2020 (Conference of the Parties to the Convention on Biological Diversity 2010). It has become obvious that, to plan concrete actions to counteract the loss of biodiversity, statistical tools and model organisms are needed to distil information about landscape-scale patterns from local biological processes (Beale and Lennon Reference Beale and Lennon2012). The CoP CBD also recognised that, at the earliest stage of the planning process, the development of standardised quantitative methods underpins data-sharing, comparisons between independent studies across regions, and the tracking of changes over time (Conference of the Parties to the Convention on Biological Diversity 2010).
Ants (Hymenoptera: Formicidae) (Agosti et al. Reference Agosti, Schultz and Majer2000; Andersen et al. Reference Andersen, Hoffmann, Müller and Griffiths2002) and dung beetles (Coleoptera: Scarabaeidae: Scarabaeinae and Aphodiinae) (Spector Reference Spector2006; Pryke et al. Reference Pryke, Roets and Samways2013; Tocco et al. Reference Tocco, Negro, Rolando and Palestrini2013) are well-established model organisms for the type of monitoring biodiversity that was envisioned by the CoP CBD. Both taxa are commonly surveyed using inexpensive, efficient, and readily standardised pitfall traps (Woodcock Reference Woodcock2005). Dung beetles are generally sampled using traps baited with dung.
The efficiency of pitfall traps may be influenced by factors like ground and vegetation cover, weather conditions, and the physical characteristics (size, colour, material, number, placement, and position) of the traps (Woodcock Reference Woodcock2005; Siewers et al. Reference Siewers, Schirmel and Buchholz2014). Dung beetle traps used in Neotropical and Oriental tropical forests are generally covered: the bait is suspended above the trap and covered with a plate or large leaf to prevent the trap from accumulating rainwater and debris (Larsen and Forsyth Reference Larsen and Forsyth2005; Slade et al. Reference Slade, Mann, Villanueva and Lewis2007; Audino et al. Reference Audino, Louzada and Comita2014). Non-covered traps are commonly used in studies in Palaearctic and Afrotropical pastures and savannas: the bait is either hung about 10 cm above the centre of the trap (Pryke et al. Reference Pryke, Roets and Samways2013; Tocco et al. Reference Tocco, Negro, Rolando and Palestrini2013), or supported over the centre of the trap at ground level on a metal grid (Roslin Reference Roslin2000; Jay-Robert et al. Reference Jay-Robert, Errouissi and Lumaret2008) or two wires (Davis et al. Reference Davis, Scholtz and Deschodt2008; Jacobs et al. Reference Jacobs, Scholtz, Escobar and Davis2010). To prevent trapped beetles from escaping before they are identified and counted, the traps may be fitted with a funnel for live-trapping (Vulinec et al. Reference Vulinec, Lima, Carvalho and Mellow2008) or partially filled with a preservative fluid (Woodcock Reference Woodcock2005; Aristophanous Reference Aristophanous2010). There is knowledge of the effective sampling area of baited dung traps (Larsen and Forsyth Reference Larsen and Forsyth2005) and the efficacy of different kinds of dung (Davis Reference Davis1994; Marsh et al. Reference Marsh, Louzada, Beiroz and Ewers2013) and preservative (Aristophanous Reference Aristophanous2010), but little appears to be known about the merits of different pitfall trap designs in capturing dung beetles, and only one study, in southern Europe, was found that used more than one trap design based on the bait position (Veiga et al. Reference Veiga, Lobo and Martín-Piera1989).
Dung beetle communities are often structured into guilds that handle dung in functionally distinct ways (Halffter and Edmonds Reference Halffter and Edmonds1982). The iconic telocoprids roll balls of dung away from the main resource, while paracoprids relocate dung into tunnels dug below the resource, and endocoprids build nest chambers within the resource. Some species are characteristically nocturnal and others diurnal. The interaction between trap design and dung beetles’ characteristics, such as dung-handling behaviour, diel activity patterns and body size, have not been explored.
Another crucial variable in surveying dung beetles is sampling effort, which is the product of the number of sampling occasions and the number of traps employed. It is common for studies in southern Africa to deploy from two to six traps per site, and to empty them once a day for two or rarely three days (McGeoch et al. Reference McGeoch, van Rensburg and Botes2002; Davis et al. Reference Davis, Scholtz and Deschodt2008, Reference Davis, Swemmer, Scholtz, Deschodt and Tshikae2014; Pryke et al. Reference Pryke, Roets and Samways2013). As yet, the trapping effort required to obtain a representative sample of a dung beetle community has not been studied explicitly and analytically in Africa. Under-sampling obviously fails to meet the objectives of sampling, while both under-sampling and over-sampling waste resources and kill dung beetles and non-target organisms needlessly.
In this study, we compared the effectiveness of two common baited trap designs for surveying dung beetles of different guilds with one un-baited design (such as is used for ants) in three habitats, and provide an analytical method to evaluate the associated sampling effort necessary to obtain representative samples of the dung beetle communities using these baited traps (at least in the Eastern Cape province of South Africa). The capture of non-target species was also evaluated from an ethical perspective, with particular attention to ants because they are often proposed as ecological indicators.
Materials and methods
Study sites
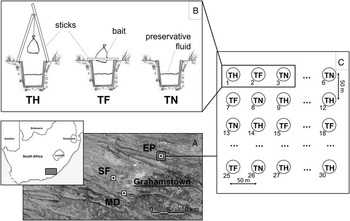
The range of environments and associated communities of dung beetles were maximised by choosing three sites near Grahamstown, South Africa (Fig. 1) with distinct ecological characteristics. Strowan farm (SF: 33°17′30″S 26°29′10″E, 620 m) was on a gentle, southwest-facing slope in Bisho Thornveld (SVs7: Mucina and Rutherford Reference Mucina and Rutherford2006) dominated by low-growing sclerophylous forbes, many of them quite woody. Mountain Drive Commonage (MD: 33°19′45″S 26°30′45″E, 710 m) was on a somewhat steeper, north-facing slope vegetated by mixed, ~ 40 cm-tall grassland growing on transformed Zuurberg Quartzite Fynbos (FFq6: Mucina and Rutherford Reference Mucina and Rutherford2006). Ecca Pass (EP: 33°13′45″S 26°38′00″E, 565 m) was on relatively flat ground supporting Kowie Thicket (AT8: Mucina and Rutherford Reference Mucina and Rutherford2006), a mosaic of mixed grass between clumps of mixed bushes up to 2 m tall. The vegetation types and their associated phytosociological, physiognomic, climatic, and edaphic characteristics are described in detail by Mucina and Rutherford (Reference Mucina and Rutherford2006). The Strowan and Mountain Drive sites were 4.8 km apart, and both were about 15.6 km from Ecca Pass.
Illustration of the study sites (A) located near Grahamstown, Eastern Cape Province, South Africa: Strowan farm (SF), Mountain Drive Commonage (MD), and Ecca Pass (EP). Spatial configuration of the traps (C): 10 traps of each type, un-baited (TN), flat (TF), or hanging (TH), placed at least 50 m apart, were set at each site. (B): Pitfall trap design of TH, TF, and TN.

Data collection occurred in February and March of 2015.
Specimen collection: trap types
Each pitfall trap consisted of a small plastic bucket (mouth diameter 11 cm, 11 cm deep, volume 1.05 L) buried up to its rim, flush with the surrounding ground. Traps were either un-baited (TN), baited at ground level (flat trap, TF), or baited above the trap (hanging trap, TH). The bait was 150 g of a mixture of fresh cow and pig dung, the two type of dung that usually attract more species in southern Africa (Davis Reference Davis1994), wrapped in gauze. The gauze acted as a barrier between the beetles and the bait, and at no point during the experiment did beetles tear the gauze. In TH, the bait was suspended from a tripod of sticks 50 cm long, so that the bait hung ~ 15 cm above the ground (Fig. 1B). In TF, the bait was supported over the trap at ground level by two parallel sticks (Fig. 1B). The baits were not covered, as this is not standard practice in South Africa. All traps were half filled with a mixture of water, salt, and detergent (Woodcock Reference Woodcock2005; Aristophanous Reference Aristophanous2010) that prevented escape and preserved the specimens without compromising their integrity for morphological identification.
At each site, 10 traps of each type (TN, TF, TH) were set for three sunny days for a total sampling effort of 90 pitfall trap checks per site. Traps were placed at least 50 m apart, in transects such that no trap had two neighbours of the same type (Fig. 1B), to limit any effect of microhabitat variation and promote statistical independence (Larsen and Forsyth Reference Larsen and Forsyth2005). Pitfall traps were activated for 24 hours on three sunny days after substantial rainfall, to maximise the numbers of beetles captured, and thus the precision of the assessment. All of the trapped specimens, dung beetles and other animals, were collected and preserved in 75% ethanol and voucher material is deposited in the Albany Museum, Grahamstown, South Africa.
Identification and classification
All dung beetle specimens were identified to species or morphospecies level using various dichotomous keys (d’Orbigny Reference d’Orbigny1913; Janssens Reference Janssens1953; Ferreira Reference Ferreira1978; Frolov and Scholtz Reference Frolov and Scholtz2003) and classified according to their nesting guilds (endocoprid, paracoprid, and telocoprid) (Halffter and Edmonds Reference Halffter and Edmonds1982) to evaluate the effect of trap type and sampling effort on three component of dung beetle diversity: abundance, species richness, and functional diversity (nesting behaviour). All other specimens were identified to at least taxonomic order and grouped into one of two categories: (1) secondary catch and (2) by-catch to evaluate the effect of trap type on their abundance. Secondary catch included the families Staphylinidae (Coleoptera), Hydrophilidae (Coleoptera), Histeridae (Coleoptera), and Muscidae (Diptera), all of which would be attracted specifically to the bait, making them of potential use if identification methods were reliably available, while the remaining specimens were considered as by-catch because they were not specifically targeted by these traps. Moreover, ants (Hymenoptera: Formicidae) were subsequently separated from the by-catch for focussed analysis.
Statistical analysis
A completeness analysis of sampling for dung beetles, considering only baited traps (because the un-baited traps caught only seven dung beetle specimens in total), was conducted by computing abundance-based estimates by site, using two variants of extrapolated richness: the unbiased Chao estimator and Abundance-based Coverage Estimator (ACE) (Colwell and Coddington Reference Colwell and Coddington1994). The completeness inventory for each site was summarised as the percentage of the total number of species predicted by the estimators that were actually observed. Completeness analysis was carried out using functions from the vegan package (version 2.3.0) (Oksanen et al. Reference Oksanen, Kindt, Legendre, O’Hara, Stevens and Oksanen2015) run in R 3.0.1. (R Development Core Team 2005).
Trap design efficiency and non-target species
Generalised linear mixed models (GLMMs: Zuur et al. Reference Zuur, Ieno, Walker, Saveliev and Smith2009) were used to examine differences in dung beetle abundance and species richness between pitfall trap types. In all of the analyses, trap was used as the sampling unit, trap type (TF and TH) was considered a fixed factor, and sampling occasion (day) was considered a random factor. For nesting guild analysis we also considered site (SF, MD, and EP) as a fixed factor and the interaction between sites and trap type.
Generalised linear mixed models were also used to test for differences in non-target species abundance (secondary catch, by-catch, and Formicidae) between pitfall trap types. In this analysis trap type (TF, TH, and TN) was considered a fixed factor and sampling occasion (day) was considered a random factor. A Poisson distribution was specified for count variables (i.e., total abundance and species richness) that were not overdispersed; a negative binomial distribution was specified for count variables with overdispersion, because the assumption of normality (tested with Kolmogorov–Smirnoff tests) was not met (Zuur et al. Reference Zuur, Ieno, Walker, Saveliev and Smith2009). Overdispersion in the data was tested using the R package qcc (version 2.6) (Scrucca Reference Scrucca2004). Significance tests were performed using the Wald statistic and GLMM were carried out using glmmADMB (version 11.2) (Fournier et al. Reference Fournier, Skaug, Ancheta, Ianelli, Magnusson and Maunder2012) in R 3.0.1 (R Development Core Team 2005).
Resampling simulations: sampling effort
An overall objective was to develop a method to determine the number of traps and the number of days that minimised sampling effort while also producing results comparable to those produced using a more intensive sampling regime. This was achieved through the development of an algorithm designed to perform resampling simulations of the existing data set, using abundance and species richness as response variables across differing sampling efforts (number of traps and days) and methods (trap type) across multiple sites. For each combination of site (n=3) and trap type (n=2), the raw data were subset to include Z randomly selected traps (where Z=1, 2, 3, … 10 traps) and D randomly selected days (where D=1, 2, 3 days), and species richness per trap day, abundance per trap day, and total species richness were calculated. This process was bootstrapped 250 times per combination of site (n site=3), trap type (n type=2), number of traps (n traps=10), and number of days (n days=3) using all species. To illustrate how species belonging to different nesting guild may influence the simulation results, the algorithms were repeated using species classified by nesting guild (n nesting=3; paracoprid, endocoprid, and telocoprid). Simulation results (n bootstrap=180 000) were visualised in R 3.0.3 using the package ggplot2 (version 0.9.3.1) (Wickham and Chang Reference Wickham and Chang2013). Simulation results were used to evaluate trap design efficiency by examining the variability of abundance and species richness per trap day at varying levels of sampling effort. Overlapping 95% variation intervals indicates no difference in efficiency, while non-overlapping 95% variation intervals indicates that a difference was observed. It was predicted that at low sampling efforts, variability in these response variables would be highest, and that visualising the decline in this variability could aid in the identification of appropriate minimum sampling requirements to show trap design effects.
Results
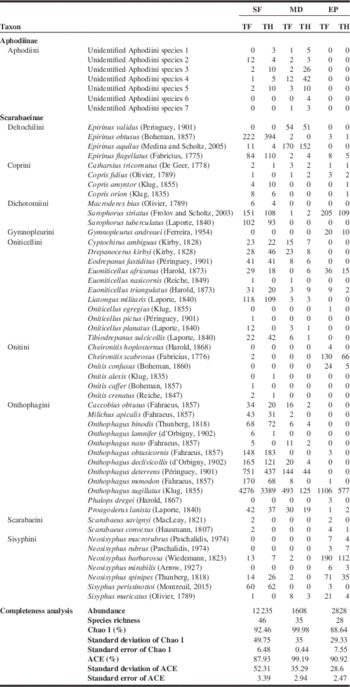
A total of 16 671 dung beetles belonging to 57 species were recorded across all sites and trap types. Both abundance and species richness varied across sites and trap types (Table 1). Un-baited traps caught only seven individual dung beetles, with five at MD (two Drepanocerus kirbyi Kirby and three Aphodius Illiger species), one at SF (Epirinus flagellatus (Fabricius)), and one at EP (Neosisyphus mirabilis (Arrow)). These low abundances were insufficient for meaningful statistical evaluation, and thus un-baited traps were excluded from subsequent analyses of dung beetle catches.
Abundance of dung beetles, by species, at Strowan farm (SF), Mountain Drive (MD), and Ecca Pass (EP), collected using flat trap (TF) and hanging trap (TH), and results of completeness analysis, including total abundance, species richness, and Chao 1 and ACE richness estimates.

Completeness analysis values ranged from 87.9% to 99.8% across sites, irrespective of estimator (Table 1). As most of the expected species were collected, it was assumed that the sampling effort was sufficient and the samples representative.
Trap design efficiency
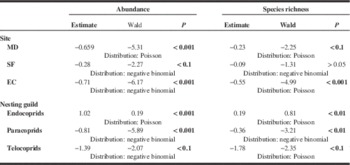
Total abundance and species richness in sites MD and EP, and total abundance in SF were significantly higher for TF than for TH (Table 2). The total abundance and species richness of paracoprids and telocoprids was significantly higher for TF than for TH, while the total abundance and species richness of endocoprids showed a significant but opposite trend (higher for TH than for TF) (Table 2).
Site factor estimates and statistical significance (generalised linear mixed model (GLMM)) for abundance and species richness parameters between flat (TF) and hanging traps (TH) at the three sites (Strowan farm (SF), Mountain Drive (MD), and Ecca Pass (EP)) and nesting guilds (endocoprids, paracoprids, and telocoprids).

Note: Significant comparisons are in bold type. In this parameter estimation analysis, the flat trap was used as the reference category.
Resampling simulations: sampling effort
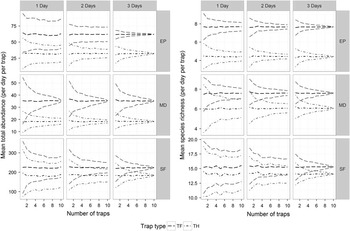
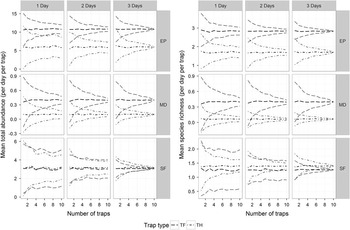
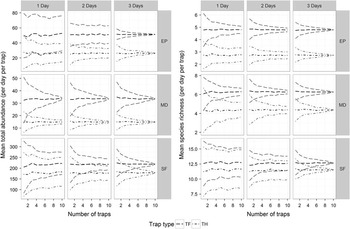
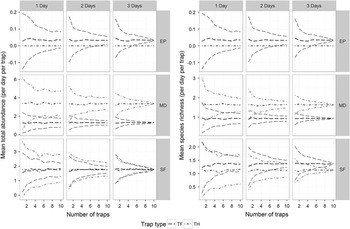
As expected, the variability (measured as standard error) associated with simulated calculations of abundance and species richness (Fig. 2) per trap day decreased with increased effort, both in terms of the number of traps used and the number of days over which sampling occurred. As with the model results, resampling of TF traps tended to produce higher simulated values of abundance and species richness than TH traps, for the total, paracoprid and telocoprid samples, but the opposite was found for the endocoprid sample (Figs. 2–5).
Simulated (n=45 000) mean abundance (±standard deviation) and mean species richness (±standard deviation) of dung beetles per trap per day across three sites; Ecca Pass (EP), Mountain Drive (MD), and Strowan farm (SF) using flat (TF) and hanging traps (TH), checked for one (left), two (middle), or three (right) days.

Simulated (n=45 000) mean abundance (±standard deviation) and mean species richness (±standard deviation) of telocoprids per trap per day across three sites; Ecca Pass (EP), Mountain Drive (MD), and Strowan farm (SF) using flat (TF) and hanging traps (TH), checked for one (left), two (middle), or three (right) days.

Simulated (n=45 000) mean abundance (±standard deviation) and mean species richness (±standard deviation) of paracoprids per trap per day across three sites; Ecca Pass (EP), Mountain Drive (MD), and Strowan farm (SF) using flat (TF) and hanging traps (TH), checked for one (left), two (middle), or three (right) days.

Simulated (n=45 000) mean abundance (±standard deviation) and mean species richness (±standard deviation) of endocoprids per trap per day across three sites; Ecca Pass (EP), Mountain Drive (MD), and Strowan farm (SF) using flat (TF) and hanging traps (TH), checked for one (left), two (middle), or three (right) days.

The minimum effort required to achieve a significant difference in the trap efficiency was two days and two traps, one day and two traps, and three days and six traps at EP, MD, and SF, respectively. Significant difference in species richness was achieved by an effort of one day and four traps, two days and six traps, and three days and six traps at EP, MD, and SF, respectively.
Non-target species
A total of 2255 non-target specimens were caught during the study: 628 secondary catch, and 1627 by-catch, including 721 Formicidae.
By-catch was negligible, but included Coleoptera, Orthoptera, Blattodea, Araneae, and Myriapoda. A total of 11 vertebrate specimens were also caught (seven Kassina senegalensis (Duméril and Bibron) (Amphibia: Hyperoliidae); and four Sclerophrys capensis Tschudi (Amphibia: Bufonidae)), with three captured in baited traps and eight in un-baited traps. Generalised linear mixed models show that by-catch abundance was not significantly different between the three trap types.
Secondary catch abundance was not significantly different between TF and TH (Est=0.538; Wald=0.79; P=0.43), but significantly lower for TN (Est=−3.439; Wald=−4.54; P<0.001). Abundance of Formicidae was not significantly different between TF and TH (Est=0.319; Wald=0.42; P=0.67) and between baited trap and TN (Est=0.551; Wald=0.74; P=0.46).
Discussion
Trap design efficiency
Our study showed that the type of trap significantly affected the observed abundance and nesting guild composition of dung beetles sampled. In general, the TF was more efficient than the TH, perhaps due to the characteristics of the particular dung beetle communities. Indeed, when we considered nesting behaviour, which is perhaps the most conspicuous aspect of dung beetles natural history, the different guilds showed opposing trends in both abundance and species richness, which were higher in TF for paracoprids and telocoprids, and in TH for endocoprids. The assemblages in all three sites were dominated by species of Onthophagini, a tribe represented by paracoprid species and for this reason the TF was the most efficient trapping method.
Our results therefore suggest that the selection of a trap design has to compliment the guild structure of the dung beetle community. Considering that the composition of the dung beetle community can be diverse within the global ecosystem, it is premature to recommend TF as the best trap design universally, despite our assessment of diverse habitats. For example in Europe, and in particular in the Italian Alps where about the 90% of the dung beetle communities are represented by endocoprid Aphodiini (Tocco et al. Reference Tocco, Negro, Rolando and Palestrini2013), TH is a more appropriate design.
Further investigation is required to understand the reason of the different efficiency of these two trap types because other factors, such as odour dissemination, might play an important role in trap selectivity. Body size or visual ability of the beetles will play a role if the supporting sticks and the position of the bait in the TH are obstacles to entering the trap.
Resampling simulations: sampling effort
Statistically significant differences in trap efficiency are detected at the effort level at which the variation around the mean response of trap types no longer overlaps (Figs. 2–4). Ideally the lowest sample effort possible should be used, to limit by-catch. Due to differences in this threshold effort that we found between habitats though, a more pragmatic approach is needed, where the lowest sample effort that illustrates the increased trap efficiency in all habitats should be used. This number can be calculated from pilot studies using the R-based resampling simulations we have described.
As sensitivity analysis continues to be used to design global sampling protocols, there are several important concepts for researchers to keep in mind when interpreting results. The evaluation of sampling protocol differences is based on observations of variability of standardised abundance and richness around a mean simulated value. The resampling technique depends on the even distribution of trap+day combinations, resulting in uneven variability, artificially depressed at high effort as the majority of potential combinations have been removed from the sample pool. Differences were observed between trap types at intermediate effort, making it unlikely to be due to depressed variability. The means generated from these data are also artificially depressed due to the skew distribution of the samples. For this reason, resampling simulations should not be viewed as predictive of catch rates, but rather are of comparative value.
Non-target species
Although the total abundance and diversity increase with sampling effort, when time and funds are limited, finding a compromise between sampling effort and realistic estimates of community structure is essential. From the point of view of monitoring biodiversity for conservation plans, the method employed has to be effective for the target species but at the same time avoid accidentally destroying non-target species. Although the total effort in this study was 270 trap checks, less than 1620 by-catch specimens were killed. The baited traps have a similar, positive effect on the secondary catch and do not increase the number of by-catch specimens with respect to the un-baited trap. Regrettably, 11 vertebrates were also killed in our survey, mainly in un-baited traps. The bait and its supports may be a deterrent for vertebrates.
An advantage of using dung beetles as ecological indicators is that active traps require a short time of trap activity, minimising their by-catch. Ground beetles and spiders are epigeal arthropods commonly used in monitoring programmes, but the passive traps often employed in their survey required a long period of activity (Woodcock Reference Woodcock2005; Midega et al. Reference Midega, Khan, Van den Berg, Ogol, Dippenaar‐Schoeman and Pickett2008; Lange et al. Reference Lange, Gossner and Weisser2011; Buchholz et al. Reference Buchholz, Schirmel and Siewers2014) during which non-target organisms may be killed unnecessarily. Woodcock (Reference Woodcock2005) notes that standard baits for ground beetle collection do not increase the efficiency of traps.
Ants are an ecological important group often recommended as ecological indicators (Agosti et al. Reference Agosti, Schultz and Majer2000). We caught comparable numbers of ants in baited and un-baited traps, which means that the ants in the by-catch of dung beetle samples can be used as an additional monitoring index. However, since the baited traps are open for a relatively brief period, the sample of ants may not be statistically informative. Standard protocols recommend that pitfall traps for ants should be set for a minimum of seven days, along with additional complimentary sampling (Agosti et al. Reference Agosti, Schultz and Majer2000). As ants are ecologically diverse, baiting traps introduces unpredictable sampling bias, making un-baited but inefficient traps a requirement.
Conclusion
To assess dung beetle communities realistically, many factors should be considered (Davis Reference Davis2002). These can be broadly grouped into methodological factors and environmental factors. Methodological factors include the efficacy of the dung type used for baiting (Davis Reference Davis1994; Marsh et al. Reference Marsh, Louzada, Beiroz and Ewers2013), the spatial arrangement (Larsen and Forsyth Reference Larsen and Forsyth2005), and, as shown in this work, the trap design and the sampling effort. Environmental factors include aspect, habitat type, soil type, time since rainfall, and similar influences (Davis Reference Davis2002). Environmental factors are fixed to the site being sampled and cannot be changed practically in many cases, but methodological factors are controllable and every effort should be made to maximise sampling efficacy in this way. Our sites were intentionally chosen to represent diverse habitats, and as such, comparisons between sites and habitats can be made interchangeably.
If dung beetle communities are assessed realistically, they become good indicator taxa for ecological research (McGeoch et al. Reference McGeoch, van Rensburg and Botes2002; Spector Reference Spector2006) and have been used to carry out meta-analyses (Nichols et al. Reference Nichols, Larsen, Spector, Davis, Escobar and Favila2007). In the context of preparing practical plans to counteract the loss of biodiversity, identifying a standardised quantitative sampling and analytical method (regarding trap design and sampling effort) is an essential consideration. Another consideration is minimising the capture of non-target species. While this is secondary in terms of importance, any efforts related to biodiversity conservation would be hypocritical if this point is ignored. By employing effective and standardised methodologies as indicated by this study statistical comparisons can be made between independent studies, thus resulting in accurate monitoring of biodiversity changes over time. This in turn allows policy makers to make science-based decisions using accurate, accessible information.
Acknowledgements
Michael Palmer very generously granted access to Strowan farm. The authors thank the Eastern Cape Department of Economic Development, Environmental Affairs, and Tourism for granting collecting permit CRO 166/14; the management of the Albany Museum, supported by the directorate of Museums and Heritage resources in the Eastern Cape Government’s Department of Sport, Recreation, Arts, and Culture, for supporting J.M.; and Rhodes University for kindly funding C.T.