Introduction
Heritage speakers are descendants of immigrants that speak an ethnic minority language in a society where a different language is spoken as the majority language. As it encompasses a broad spectrum of individuals of different backgrounds, the term “heritage speakers” has been used with varying definitions depending on the discipline one adopts (Polinsky & Kagan, Reference Polinsky and Kagan2007). This study takes a narrow definition of heritage speakers and limits its scope to first generation US-born heritage speakers with foreign-born parents. Since English is the majority language of the society and the heritage language is a minority language, heritage speakers' use of English increases as they grow up, whereas their use of the heritage language decreases. Thus, while heritage speakers develop a strong command of English, their linguistic skills of the heritage language are often short of those of their parents or monolingual peers raised in their home countries (Montrul, Reference Montrul2008; Valdés, Reference Valdés, Preyton, Ranard and McGinnis2001), and sometimes show signs of transfer from English that resemble linguistic patterns attested in late second language (L2) learners (Kondo-Brown, Reference Kondo-Brown2004; Montrul, Reference Montrul2012; O'Grady, Kwak, Lee & Lee, Reference O'Grady, Kwak, Lee and Lee2011). For this reason, studies in heritage language acquisition often compare heritage speakers with non-heritage native speakers and late second language (L2) learners.
Since heritage speakers acquire the heritage language naturalistically at home from their parents, the heritage language is one of heritage speakers' native languages. Nonetheless, heritage speakers tend to comprehend it much better than they speak it (Campbell & Rosenthal, Reference Campbell, Rosenthal and Rosenthal2000; Hurtado & Vega, Reference Hurtado and Vega2004). The discrepancy between heritage speakers' receptive and productive skills has also been demonstrated in heritage language phonology. Studies have shown that heritage speakers are comparable to non-heritage native speakers when perceiving heritage language speech sounds (Chang, Reference Chang2016; Oh, Jun, Knightly & Au, Reference Oh, Jun, Knightly and Au2003), while they demonstrate variability in their production (Au, Oh, Knightly, Jun & Romo, Reference Au, Oh, Knightly, Jun and Romo2008; Chang & Yao, Reference Chang and Yao2016; Chang, Haynes, Yao & Rhodes, Reference Chang, Haynes, Yao and Rhodes2008; Knightly, Jun, Oh & Au, Reference Knightly, Jun, Oh and Au2003; Oh et al., Reference Oh, Jun, Knightly and Au2003). For instance, Oh et al. (Reference Oh, Jun, Knightly and Au2003) found that Korean heritage speakers, regardless of whether they regularly spoke Korean during childhood (childhood speakers) or only overheard it (childhood overhearers), performed similarly to non-heritage native Korean speakers when perceiving Korean denti-alveolar stops. When producing these sounds, while childhood speakers showed an advantage over childhood overhearers, both groups' stop productions were judged to be more accented than those of the non-heritage native Korean speakers. Thus, while early exposure to the heritage language is beneficial for later perception of the language, it may not necessarily lead to target-like production.
Discrepancy between heritage language perception and production may also derive from an asymmetry between heritage language use and input, which is often found across many heritage speaker populations in the US. While heritage speakers' interactions in the heritage language are generally limited to home with parents and other household adults, the heritage language is used more frequently from these speakers to the heritage speakers than the opposite direction (Beaudrie & Ducar, Reference Beaudrie and Ducar2005; Hakuta & D'Andrea, Reference González and Romero1992; Hurtado & Vega, Reference Hurtado and Vega2004; Potowski, Reference Potowski2004). This becomes possible when foreign-born parents who predominantly speak the heritage language understand English, and when their English-speaking children understand the heritage language (Hurtado & Vega, Reference Hurtado and Vega2004). Thus, heritage speakers speak the heritage language less frequently than they hear it. This study aims to investigate the relationship between the perception and the production of heritage language speech sounds. We examined Spanish heritage speakers' perception and production of lexical stress in Spanish and investigated whether and how heritage speakers differ from Spanish monolinguals and English L2 learners of Spanish.
Lexical stress in Spanish and English
Spanish and English are typologically similar in that both languages have lexical stress. That is, it is possible to obtain words with different meanings solely by altering the position of stress (Hualde, Reference Hualde2005). Stress is characterized as prominence in a syllable of a word resulting from extra muscular energy that acoustically manifests in longer duration, higher pitch, and higher intensity (Ladefoged, Reference Ladefoged2001). While any acoustic information that is available in the speech signal, whether it is segmental or suprasegmental, has a role in lexical activation (Cutler, Reference Cutler2012), listeners tend to apply strategies that are efficient for processing native language speech sounds.
In Spanish, lexical stress is signaled primarily by suprasegmental cuesFootnote 1. While duration is the most robust stress correlate in Spanish (Ortega-Llebaria, Reference Ortega-Llebaria and Díaz-Campos2006; Ortega-Llebaria & Prieto, Reference Ortega-Llebaria, Prieto, Prieto, Mascaró and Solé2007, Reference Ortega-Llebaria, Prieto, Vigário, Frota and Freitas2009), it covaries with other suprasegmental cues based on the pitch accent that the word carries. In nuclear positions, stressed vowels are produced with longer duration, higher pitch, and higher intensity, while in prenuclear positions, apart from duration, stress is signaled by tonal alignment in which the pitch (f0) peak is displaced to a following syllable (L+>H*) (Estebas-Vilaplana, Reference Estebas-Vilaplana2007; Hualde, Reference Hualde2005; Lleó, Rakow & Kehoe, Reference Lleó, Rakow, Kehoe and Face2004; Prieto & Torreira, Reference Prieto and Torreira2007). When no pitch accent is present (unaccented contexts), duration functions as the main stress correlate (Torreira, Simonet & Hualde, Reference Torreira, Simonet, Hualde, Campbell, Gibbon and Hirst2014). In English, on the other hand, lexical stress is systematically accompanied by segmental variation (vowel quality). Unlike Spanish in which alternation of vowel quality does not occur, English vowels are consistently reduced in unstressed position. Although lexical stress in English can also be marked by suprasegmental information, this is simply a by-product of vowel reduction (Beckman & Edwards, Reference Beckman, Edwards and Keating1994; Campbell & Beckman, Reference Campbell, Beckman, Botinis, Kouroupetroglou and Carayiannis1997; Delattre, Reference Delattre1966; Ortega-Llebaria, Gu & Fan, Reference Ortega-Llebaria, Gu and Fan2013).
Spanish and English lexical stress also differ in their functional load, that is, “the extent and degree of contrast between linguistic units” (King, Reference King1967). In Spanish, stress minimal pairs frequently occur within the same lexical category (e.g., canto ‘I sing’ vs. cantó ‘he/she/you (formal) sang.’), while English stress minimal pairs occur between nouns and verbs and on a limited basis (e.g., conduct vs. conduct) (Jensen, 1993; Saalfeld, Reference Saalfeld2009). For instance, English listeners are able to correctly retrieve the intended word using syntactic cues even if lexical stress is placed in a wrong position (e.g., The CEO must *consult/consult with the board of directors prior to taking action) (Cutler, Reference Cutler1986), while Spanish listeners would have to pay attention to the stress position to resolve confusion (e.g., Hable/Hablé con el director. ‘(You) Speak/I spoke with the director’). Thus, compared to English, lexical stress in Spanish has higher functional load.
Due to the cross-linguistic differences between Spanish and English lexical stress, Spanish listeners are sensitive to suprasegmental information when processing speech (Ortega-Llebaria et al., Reference Ortega-Llebaria, Gu and Fan2013; Quilis & Esgueva, Reference Quilis, Esgueva, Esgueva and Cantarero1983; Soto-Faraco, Sebastián-Gallés & Cutler, Reference Soto-Faraco, Sebastián-Gallés and Cutler2001), whereas English listeners do not attend to this information to a large degree (Cooper, Cutler & Wales, Reference Cooper, Cutler and Wales2002; Cutler, Reference Cutler1986, Reference Cutler2012; Fear, Cutler & Butterfield, Reference Fear, Cutler and Butterfield1995; Tyler & Cutler, Reference Tyler and Cutler2009). Therefore, English L2 learners of Spanish experience great difficulties when distinguishing Spanish stress minimal pairs which differ primarily in suprasegmental information (Ortega-Llebaria et al., Reference Ortega-Llebaria, Gu and Fan2013; Romanelli & Menegotto, Reference Romanelli and Menegotto2015; Saalfeld, Reference Saalfeld2009). Moreover, in their production, L2 learners reduce unstressed vowels as they would do in English (Menke & Face, Reference Menke and Face2010) or misplace the stress (Adams, Reference Adams1979; González & Romero, Reference González and Romero2007; Knightly et al., Reference Knightly, Jun, Oh and Au2003; Lord, Reference Lord2007).
Acquisition of lexical stress: The relationship between speech perception and production
Linguistic experience has a large influence on how we process speech sounds and this effect begins early in life. Early on, infants are able to distinguish all speech sounds that exist in human languages, but within the second half of the first year of life they become more sensitive to native sound contrasts, while their sensitivity to non-native sound contrasts subsides. This language-general to language-specific ability of speech perception has been observed at both segmental (Kuhl, Conboy, Coffey-Corina, Padden, Rivera-Gaxiola & Nelson, Reference Kuhl, Conboy, Padden, Nelson and Pruitt2005; Werker & Polka, Reference Werker and Polka1993; Werker & Tees, Reference Werker and Tees1984) and suprasegmental levels (Höhle, Bijeljac-Babic, Herold, Weissenborn & Nazzi, Reference Höhle, Bijeljac-Babic, Herold, Weissenborn and Nazzi2009; Jusczyk, Cutler & Redanz, Reference Jusczyk, Cutler and Redanz1993; Mattock & Burnham, Reference Mattock and Burnham2006; Pons & Bosch, Reference Pons and Bosch2010; Sato, Sogabe & Mazuka, Reference Sato, Sogabe and Mazuka2010; Skoruppa, Pons, Bosch, Christophe, Cabrol & Peperkamp, Reference Skoruppa, Pons, Bosch, Christophe, Cabrol and Peperkamp2013). Regarding speech production, numerous studies argued that language-specific speech production does not occur until later, as it requires a learned mapping between perception and production based on the perceptual patterns stored in memory (de Boysson-Bardies, Reference de Boysson-Bardies, de Boysson-Bardies, de Schonen, Jusczyk, MacNeilage and Morton1993; Imada, Zhang, Cheour, Taulu, Ahonen & Kuhl, Reference Imada, Zhang, Cheour, Taulu, Ahonen and Kuhl2006; Kehoe, Stoel-Gammon & Buder, Reference Kehoe, Stoel-Gammon and Buder1995; Kuhl, Conboy, Coffey-Corina, Padden, Rivera-Gaxiola & Nelson, Reference Kuhl, Conboy, Coffey-Corina, Padden, Rivera-Gaxiola and Nelson2008; Kuhl & Meltzoff, Reference Kuhl and Meltzoff1996), although there is also evidence of early emergence of language-specific speech patterns in neonates' cries (Mampe, Friederici, Christophe & Wermke, Reference Mampe, Friederici, Christophe and Wermke2009).
With respect to lexical stress, studies have shown that, when listening to strong-weak (trochaic) and weak-strong (iambic) disyllabic word lists, 9-month-old English-learning infants demonstrate preference for trochaic stress (Echols, Crowhurst & Childers, Reference Echols, Crowhurst and Childers1997; Juscyzk et al., Reference Jusczyk, Cutler and Redanz1993; Turk, Jusczyk & Gerken, Reference Turk, Jusczyk and Gerken1995), which is the predominant stress pattern in English (Clopper, Reference Clopper2002; Murphy & Kandil, Reference Murphy and Kandil2004). Although trochaic stress is the most common stress pattern in Spanish as well (Navarro Tomás, Reference Navarro Tomás1966; Quilis, Reference Quilis1993; Roark & Demuth, Reference Roark, Demuth, Howell, Fish and Keith-Louis2000), 9-month-old Spanish-learning infants are able to discriminate words with trochaic and iambic stress and do not show trochaic bias unless syllable weight is taken into consideration (Pons & Bosch, Reference Pons and Bosch2010; Skoruppa et al., Reference Skoruppa, Pons, Bosch, Christophe, Cabrol and Peperkamp2013; Skoruppa, Pons, Christophe, Bosch, Dupoux, Sebastián-Gallés & Peperkamp , Reference Skoruppa, Pons, Christophe, Bosch, Dupoux, Sebastián-Gallés and Peperkamp2009)Footnote 2. The different patterns found between Spanish- and English-learning infants may be due to Spanish and English belonging to different rhythmic class, as Spanish is a syllable-based language, while English is a stress-based one (Abercrombie, Reference Abercrombie1967; Cutler, Mehler, Norris & Segui, Reference Cutler, Mehler, Norris and Segui1986, Nazzi, Jusczyk & Johnson, Reference Nazzi, Jusczyk and Johnson2000; Ramus, Nespor & Mehler, Reference Ramus, Nespor and Mehler1999). However, according to Pons and Bosch (Reference Pons and Bosch2010), it is also possible that Spanish-learning infants are exposed to iambic words more often than English-learning infants, since there are many words with iambic stress that are highly frequent in the input of Spanish-learning infants (e.g., mamá ‘mommy, papá ‘daddy’, bebé ‘baby’)Footnote 3.
Regarding the production of stress, studies have shown that 2-year-old English-learning children are more likely to delete a weak syllable if it precedes a strong syllable (e.g., nana for banana) than if it follows a strong syllable (e.g., *bana for banana) (Allen & Hawkins, Reference Allen, Hawkins, Bell and Bybee Hooper1978, Reference Allen and Hawkins1980; Echols & Newport, 1992; Gerken, Reference Gerken1994), demonstrating a preference for trochaic stress. By age 3, children produce trochaic words using the stress correlates that adults use (Ballard, Djaja, Arciuli, James & van Doorn, Reference Ballard, Djaja, Arciuli, James and van Doorn2012). However, although children's production of lexical stress becomes more adult-like with age, variability persists until later in life (Ariciuli & Ballard, Reference Ariciuli and Ballard2017; Ballard et al., Reference Ballard, Djaja, Arciuli, James and van Doorn2012; Hochberg, Reference Hochberg1988; Kehoe et al., Reference Kehoe, Stoel-Gammon and Buder1995; Pollock, Brammer & Hageman, Reference Pollock, Brammer and Hageman1993; Schwartz, Petinou, Goffman, Lazowski & Cartusciello, Reference Schwartz, Petinou, Goffman, Lazowski and Cartusciello1996; Vihman, DePaolis & Davis, Reference Vihman, DePaolis and Davis1998). Ballard and colleagues examined the stress correlates of words produced by children of younger (3- to 7-year-olds) (Ballard et al., Reference Ballard, Djaja, Arciuli, James and van Doorn2012) and older age groups (8- to 11-year-olds) (Arciuli & Ballard, Reference Ariciuli and Ballard2017), in which the first two syllables exhibit strong-weak (e.g., caterpillar) and weak-strong patterns (e.g., tomato). They found that, while the older group overall used the stress correlates in a more adult-like manner than the younger group, they were still not completely adult-like in their use of intensity when producing weak-strong words, which is the less frequent stress pattern in English.
In the case of Spanish-learning children, Hochberg (Reference Hochberg1988) found that the distribution of Spanish stress patterns affects Spanish-learning children's production of lexical stress. Hochberg (Reference Hochberg1988) examined the production of nonce word stress minimal pairs (e.g., bóchaca, bochaca, bochacá) by 50 Mexican-American preschoolers from age 3 to 5. She found that overall the children made more errors when producing words that did not follow the general Spanish stress rules (Navarro Tomás, Reference Navarro Tomás1966)Footnote 4, compared to the words that did, regularizing the stress pattern (e.g., producing bóchaca as bochaca). Moreover, the 5-year-olds made fewer errors resulting in change of regularity than the younger groups, which suggests that with age children become better at producing irregular stress due to continued exposure to various stress patterns in Spanish (Hochberg, Reference Hochberg1988). However, the error rates of irregular stress were still relatively high in the 5-year-olds (over 40%). While acoustic analyses should be conducted with children of a wider age range to examine whether Spanish-learning children produce stress correlates in an adult-like manner, this finding suggests that, even at age 5, Spanish-learning children show variability in their production of lexical stress.
Speech production requires complex coordination of articulatory movements and a substantial amount of time and practice are needed to develop stable target-like speech production (Godson, Reference Godson2004; Knightly et al., Reference Knightly, Jun, Oh and Au2003). This is not only the case of the production of L1 speech sounds, but also that of L2 speech sounds (Trofimovich & Baker, Reference Baker and Montreuil2006, Reference Trofimovich and Baker2007). In the case of heritage speakers, it is likely that a gradual shift to English occurs when heritage speakers still have limited motor control of their articulators (Godson, Reference Godson2004; Menn & Stoel-Gammon, Reference Menn, Stoel-Gammon, Fletcher and MacWhinney1995).
Previous studies on heritage speakers' perception and production of Spanish lexical stress
With respect to Spanish heritage speakers, there are only a few studies that investigated heritage speakers' production of Spanish lexical stress (Elias, McKinnon & Milla-Muñoz, Reference Elias, McKinnon and Milla-Muñoz2017; Ronquest, Reference Ronquest2016). These studies found that heritage speakers not only used suprasegmental information (duration), but also segmental information (vowel quality) to mark lexical stress; stressed vowels were produced with longer duration and in a larger vowel space, compared to unstressed vowels.
Heritage speakers' perception of Spanish lexical stress has not been well investigated and, to our knowledge, Kim (Reference Kim, Willis, Martín Butragueño and Herrera Zendejas2015) is the first study that considered both heritage speakers' perception and production of Spanish lexical stress. Using stress minimal pairs (e.g., paso ‘I pass' vs. pasó ‘he/she/you (formal) passed’), this study found that the heritage speakers were able to successfully distinguish paroxytones and oxytones and their results were comparable to those of Spanish monolinguals. In their production, the heritage speakers diverged from the monolinguals, in that they showed a large overlap between the two stress patterns; in many cases the final vowels of the paroxytones were produced with longer duration than the penultimate vowels as if these words were oxytones. However, the target items were embedded in a carrier phrase in which subject-verb inversion occurred (e.g., Por la plaza paso yo. ‘Through the square I pass'), which is a possible structure in Spanish, but not in English. According to Lynch (Reference Lynch2003), heritage speakers do not produce verb-subject order as frequently as Spanish monolinguals do. While no clearly defined boundary, such as a pause, was observed between the verb and the subject, it is possible that the heritage speakers put a phonological phrase boundary after the verb, which is cued by lengthening of syllables, vowels, and words (D'Imperio, Elordieta, Frota, Prieto & Vigário, Reference D'Imperio, Elordieta, Frota, Prieto, Vigário, Frota, Vigário and João Freitas2005; Rao, Reference Rao and Ortega-Llebaria2010). Given the limitation of the task design, the durational overlap between paroxytones and oxytones may have occurred as a result of final vowel lengthening, because subject-verb inversion is not a structure that heritage speakers frequently produce, and not because they did not successfully acquire the two stress patterns.
The goal of the present study is to have a better understanding of the relationship between heritage speakers' perception and production of Spanish lexical stress. This study provides a more fine-grained analysis than that of Kim (Reference Kim, Willis, Martín Butragueño and Herrera Zendejas2015) by taking into account three prosodic contexts in which the acoustic correlates of lexical stress vary: (1) nuclear position, (2) prenuclear position, and (3) unaccented context in which stressed syllables do not bear any pitch accent. Based on the asymmetry between heritage language use and input (i.e., heritage speakers speak the heritage language less frequently than they hear it) and the amount of time and practice needed to develop stable target-like speech production, we hypothesized that Spanish heritage speakers will show a more non-target-like behavior in their production than their perception regardless of the prosodic context.
Experiment 1: Perception of lexical stress
Participants
In total, 68 subjects participated in the study: 24 Spanish heritage speakers (18F, 6M) (M = 21.04 years, SD = 4.24), 24 Spanish monolinguals (13F, 11M) (M = 22.92 years, SD = 2.84), and 20 English L2 learners of Spanish (14F, 6M) (M = 20.95 years, SD = 2.42). The heritage speakers and the L2 learners were recruited at the University of Illinois at Urbana-Champaign in the US, and the recruitment of the monolinguals took place at the Autonomous University of Querétaro in Mexico. All the participants read and signed a written informed consent form before the study started. The protocol was approved by the University of Illinois at Urbana-Champaign Institutional Review Board for both international and US-based research.
The heritage speakers are first generation US-born Mexican-Americans whose parents emigrated to the US from Mexico as adults, primarily from the central-west region of the country. All the heritage speakers were born and raised in Illinois, US, and were exposed to both Mexican Spanish and American English from an early age. Twenty-one heritage speakers reported that they acquired Spanish at birth and English when they entered preschool or elementary school (M = 4.28 years, SD = 1.34) (early sequential bilinguals), while three HSs reported that they acquired both Spanish and English simultaneously (simultaneous bilinguals). When asked about their use of Spanish and English throughout life, the heritage speakers responded that they mainly used Spanish during childhood, but their use of Spanish gradually decreased as they grew up, while their use of English increased (see Figure S1). With regard to current use of Spanish and English, the heritage speakers reported that they use Spanish (M = 22.42%, SD = 9.14) far less frequently than English (M = 76.25%, SD = 10.42).
The monolinguals were born in Central Mexico, either in Querétaro or in a neighboring state, and were monolingually raised in Mexican Spanish. While the monolinguals have learned languages other than Spanish (mostly English), they did not learn them until they took a foreign language course in middle school or high school (M = 13.29 years, SD = 2.66). Moreover, they reported that they use Spanish most of the time (M = 82.58%, SD = 13.05) and do not use the other languages functionally.
Similar to the heritage speakers, the L2 learners were born and raised in Illinois, but, unlike the heritage speakers, they were only exposed to American English during childhood and did not learn Spanish until they took a Spanish language course in middle school or high school (M = 13.25 years, SD = 2.12). With regard to their current use of Spanish and English, the L2 learners reported that they use Spanish (M = 10%, SD = 7.35) far less frequently than English (M = 89.5%, SD = 8.04).
Participants' Spanish competence was evaluated using an oral picture-naming task which measures lexical knowledgeFootnote 5. The effect of group (heritage speaker/monolingual/L2 learner) on accuracy was examined with subject and item as random effects. Logit mixed effects modeling was conducted using the glmer function in the lme4 package (Bates, Maechler, Bolker & Walker, Reference Bates, Maechler, Bolker and Walker2015) in R (R Core Team, 2017). The group levels were compared using simple contrast coding in which each level is compared to the reference level (heritage speakers) and the intercept is the grand mean. The best fitting model selected through backward elimination included random intercepts for subject and item with by-item random slope for group. ResultsFootnote 6 showed that the heritage speakers (reference level) (M = 80%, SD = 10.09) had significantly lower accuracy rates than the monolinguals (M = 98.33%, SE = 1.9) (β = 2.885, SE = 0.703, z = 4.101, p < 0.001), while their accuracy rates were significantly higher than those of the L2 learners (M = 55.83%, SD = 13.51) (β = −2.284, SE = 0.46, z = −4.968, p < 0.001)Footnote 7.
Materials
Sixty minimal pairs that only differed in the position of lexical stress were used as auditory stimuli (Appendix S1, Supplementary Materials). The minimal pairs consisted of Spanish regular -ar verbs in the first person singular of present indicative form (e.g., Canto. ‘I sing’.) and the same verb in the third person singular of preterit tense (e.g., Cantó. ‘he/she/you (formal) sang’.). The former case always had stress on the penultimate syllable (paroxytone) and the latter case always had it on the final syllable (oxytone). Apart from the target items, 40 fillers of inflected Spanish verbs that do not form stress minimal pairs were included. The items were embedded in meaningful sentences in three prosodic contexts: nuclear position (e.g., Canto. ‘I sing’.), prenuclear position (e.g., Canto la balada. ‘I sing the ballad’.), and unaccented context (e.g., ¿Dónde canto con micrófono? ‘Where do I sing with microphone?’).
The stimuli were produced by a male native speaker of Mexican Spanish and the recording took place in a sound-attenuated booth using an AKG C520 head-mounted microphone and a Marantz PMD570 solid state recorder with a sampling rate of 48 kHz and a sample size of 16 bits. The stimuli were divided into six lists. This was a measure to avoid priming effect, so that the minimal pairs of the same verb in the same prosodic context did not appear in the same list.
Procedures
A forced-choice identification task was conducted using PsychoPy2 (Peirce, Reference Peirce2007). Each participant was assigned to one of the six lists. The participants were informed that they would listen to Spanish sentences in which the subjects were absent. Their task was to choose which of the two options on the computer screen was the subject of the sentence by pressing as quickly as possible either the key on the far left or the key on the far right on the keyboard, which were marked with stickers. The stimuli were auditorily presented in a randomized order through a Lenovo T430s laptop computer with Sennheiser HD 558 headphones and the order of the options was counter-balanced. Special care was taken to make sure that the same verb did not appear in a consecutive order. A practice trial with five items, which were not the target items, was conducted for familiarization with the task format. Data collection of the heritage speakers and the L2 learners took place at the University of Illinois at Urbana-Champaign and the monolingual data were collected at the Autonomous University of Querétaro. In both testing sites, the experiment was conducted in a phonetics laboratory equipped with a sound-attenuated booth.
Coding and analysis
Correct responses were automatically coded as “1” and incorrect responses were coded as “0”. The effects of group (heritage speakers/monolinguals/L2 learners), stress pattern (paroxytone/oxytone), and prosodic context (nuclear position/prenuclear position/unaccented context), and the interactions among the fixed factors on participants' accuracy were analyzed with subject and item as random effects using logit mixed effects modeling. The glmer function in the lme4 package was used for the analysis (Bates et al., Reference Bates, Maechler, Bolker and Walker2015). For each factor, the levels were compared using simple contrast coding in which each level is compared to the reference level and the intercept is the grand mean. The reference group was the heritage speakers (heritage speakers vs. monolinguals; heritage speakers vs. L2 learners), the reference stress pattern was the paroxytones (paroxytones vs. oxytones), and the reference prosodic context was the nuclear position (nuclear position vs. prenuclear position; nuclear position vs. unaccented context). The best fitting model was selected through backward elimination. Further pairwise comparisons were conducted using the lsmeans function in the lsmeans package (Lenth, Reference Lenth2016).
ResultsFootnote 8
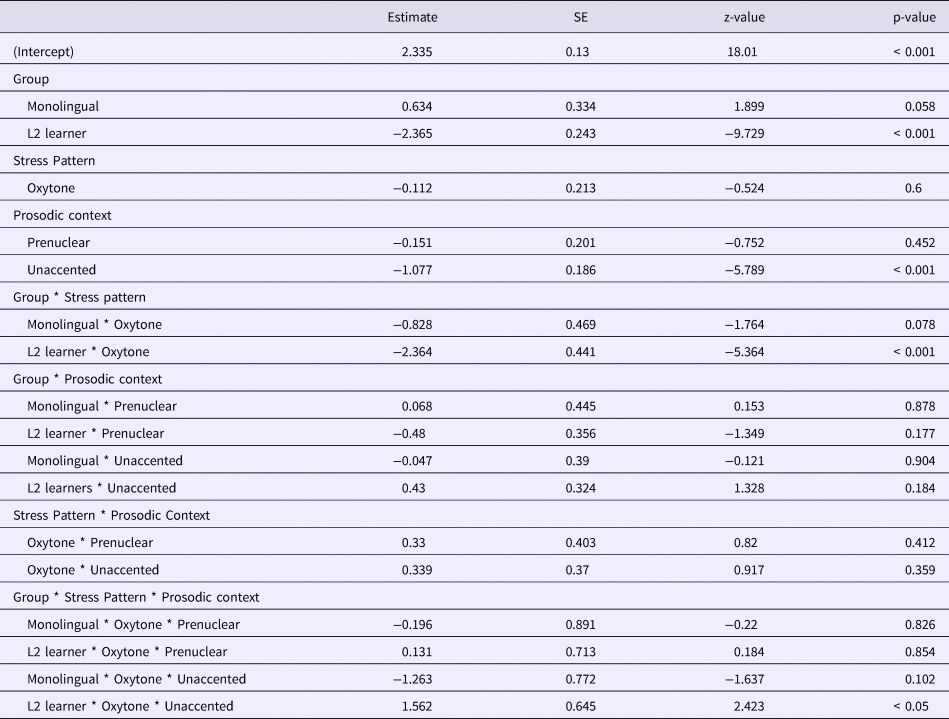
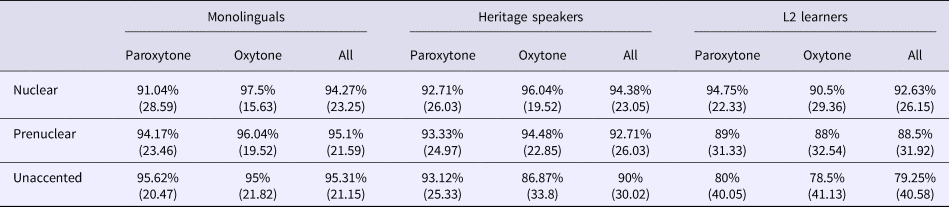
A total number of 4,080 target tokens were analyzed. Table 1 demonstrates participants' accuracy rates (i.e., proportion of correct responses) of the target stimuli by group and stress pattern across the prosodic contexts and these values are graphically presented in Figure 1. The statistical results are presented in Table 2.
Accuracy rates in Experiment 1 (M: Spanish monolinguals, HS: Spanish heritage speakers, L2: English L2 learners of Spanish).

Mean accuracy rates of target stimuli in Experiment 1 (standard deviations in parentheses)

Logit mixed effects modeling results of accuracy rates in Experiment 1

Model: Accuracy ~ Group * Stress Pattern + (1 + Stress Pattern|Subject) + (1 + Group|Item).
Overall, heritage speakers' (reference level) accuracy rates (M = 89.44%, SD = 30.74) were slightly lower than those of the monolinguals (M = 91.94%, SD = 27.22), although the difference between the two groups did not reach significance level. When compared with the L2 learners (M = 59.02%, SD = 49.02), the heritage speakers demonstrated significantly higher accuracy rates. While no main effect of stress pattern was found, there was a main effect of prosodic context (unaccented context), suggesting that the accuracy rates were overall higher in nuclear positions (M = 85.96%, SD = 34.76) than in unaccented contexts (M = 75.37%, SD = 43.1). The results also showed a significant two-way interaction between group (L2 learner) and stress pattern and a three-way interaction among group (L2 learner), stress pattern, and prosodic context (unaccented context). That is, the difference in accuracy rates between the paroxytones and the oxytones was significantly smaller for the heritage speakers than for the L2 learners. Moreover, the interaction between group (L2 learner) and stress pattern in nuclear positions showed a different pattern, compared to the interaction in unaccented contexts. No significant interaction was found between group and prosodic context.
Pairwise comparisons of group and stress pattern revealed that heritage speakers' accuracy rates were significantly higher than those of the L2 learners for both the paroxytones (β = 1.183, SE = 0.295, z = 4.012, p < 0.001) and the oxytones (β = 3.547, SE = 0.358, z = 9.899, p < 0.001). However, while heritage speakers' accuracy rates were similar between the two stress patterns, the L2 learners showed significantly higher accuracy rates for the paroxytones, compared to the oxytones (β = 1.412, SE = 0.286, z = 4.936, p < 0.001). With regard to the three-way interaction, pairwise comparisons of group, stress pattern, and prosodic context revealed that in nuclear positions heritage speakers' accuracy rates for the oxytones were significantly higher than those of the L2 learners (β = 3.812, SE = 0.476, z = 8.009, p < 0.001), while no group difference was found for the paroxytones. Moreover, while heritage speakers' accuracy rates were similar between the two stress patterns, the L2 learners showed significantly higher accuracy rates for the paroxytones, compared to the oxytones (β = 2.174, SE = 0.37, z = 5.868, p < 0.001). However, in unaccented contexts heritage speakers' accuracy rates were significantly higher than those of the L2 learners for both stress patterns (paroxytones: β = 1.235, SE = 0.341, z = 3.62, p < 0.05; oxytones: β = 2.601, SE = 0.406, z = 6.406, p < 0.001), while none of the groups showed significant difference between the two stress patterns.
Discussion
The findings in Experiment 1 suggest that overall the heritage speakers were as successful as their monolingual peers in identifying the location of Spanish lexical stress and showed significantly higher accuracy rates than the L2 learners. The findings also showed that the participants performed better when the lexical stress was located in nuclear positions than when it was in unaccented contexts. It is important to note that there is less suprasegmental information that distinguishes stress minimal pairs in unaccented contexts (duration), compared to nuclear (duration, pitch, and intensity) and prenuclear positions (duration and tonal alignment). Torreira et al. (Reference Torreira, Simonet, Hualde, Campbell, Gibbon and Hirst2014) argued that in unaccented contexts stress minimal pairs are produced with overlapping acoustic information, which leads to confusion to Spanish listeners. Thus, the lower accuracy rates in unaccented contexts support that when there is less suprasegmental information available in the speech signal, it is more difficult to identify the location of lexical stress. However, as shown in Table 1, the average accuracy rates in unaccented contexts of the heritage speakers (82.5%) and the monolinguals (86.04%) were much higher than that of the L2 learners (54%), which was close to chance level (50%). Tests against chance using logit mixed effects modeling confirmed that the accuracy rates were significantly higher than chance level only for the heritage speakers (β = 1.795, SE = 0.167, z = 10.77, p < 0.001) and the monolinguals (β – 2.084, SE = 0.177, z = 11.77, p < 0.001). That is, despite limited suprasegmental information in unaccented contexts that signal lexical stress, the heritage speakers and the monolinguals successfully attended to this cue, while the L2 learners did not.
L2 learners' lower accuracy rates, compared to those of the heritage speakers, were mainly due to their low accuracy rates for the oxytones, as shown in the significant interaction between group (L2 learner) and stress pattern. This is consistent with the findings in Kim (Reference Kim, Willis, Martín Butragueño and Herrera Zendejas2015) in which the L2 learners demonstrated a bias for paroxytones. Since L2 learners' bias for paroxytones is not of central interest in this study, it will not be discussed furtherFootnote 9. For more information regarding participants' sensitivity and response bias, see Appendix S2 (Supplementary Materials).
This study did not find any significant interaction between group and prosodic context. That is, L2 learners' greater difficulties in perceiving Spanish lexical stress, compared to the heritage speakers, are not limited to unaccented contexts. Thus, even when there were more suprasegmental cues available in the speech signal (i.e., nuclear and prenuclear positions), the L2 learners were still not able to successfully attend to these cues.
It is important to note that, when listening to the fillers in unaccented contexts, which contained inflected Spanish verbs that do not form stress minimal pairs (e.g., aprendes “you learn”), the L2 learners correctly identified them above chance level (79.25%) (β = 1.56, SE = 0.186, z = 8.383, p < 0.001), similar to the heritage speakers (β = 2.521, SE = 0.196, z = 12.854, p < 0.001) and the monolinguals (β = 3.39, SE = 0.226, z = 15.012, p < 0.001) (compare Table 1 and Table 3). Unlike the stress minimal pairs which can be distinguished solely based on suprasegmental information, the verbal suffix in the fillers (e.g., -es in aprendes ‘you learn’) disambiguates the words from possible competitors. Thus, it seems that L2 learners rely more on morphological cues (verbal suffix) than lexical stress in spoken word recognition.
Mean accuracy rates of filler stimuli in Experiment 1 (standard deviations in parentheses)

English listeners do not pay attention to suprasegmental information to a large degree for lexical activation in English (Cooper et al., Reference Cooper, Cutler and Wales2002; Cutler, Reference Cutler1986, Reference Cutler2012; Fear et al., Reference Fear, Cutler and Butterfield1995; Tyler & Cutler, Reference Tyler and Cutler2009). Thus, L2 learners' difficulty in distinguishing Spanish stress minimal pairs can be explained as native language influence. However, even though the heritage speakers are also native speakers of English and use English (76.25%) far more frequently than Spanish (22.42%), they showed a clear advantage over the L2 learners and their performance was comparable to that of the Spanish monolinguals. These findings suggest that more frequent use of English, compared to the heritage language, does not have a negative effect on heritage speakers' perception of heritage language speech sounds.
Experiment 2: Production of lexical stress
Participants
The same subjects in Experiment 1 participated in Experiment 2.
Materials
Among the 60 stress minimal pairs used in Experiment 1, 20 pairs that contain consonants that are characterized to mark a clear acoustic boundary in Spanish (e.g., voiceless obstruents, non-palatal nasals) were chosen for the facilitation of segmentation (Appendix S3, Supplementary Materials). As in Experiment 1, the items were presented in three prosodic contexts: nuclear position, prenuclear position, and unaccented context. Apart from the target items, 20 pairs of Spanish verbs that do not form stress minimal pairs were included as fillers.
Procedures
After Experiment 1, the participants took a short break (approximately 15 minutes) and continued with Experiment 2. In Experiment 2, the participants read out loud the stimuli which were presented on a Lenovo T430s laptop computer. All the items were presented in a randomized order and special care was taken to make sure that the minimal pairs of the same verb did not appear in a consecutive order. The participants were informed that the sentences were either declarative sentences or questions and that they had to use different intonation contours when reading these two sentences types: a falling contour for declarative sentences and a rising contour for questions. This was to avoid any confounding effect resulting from changes in intonation contours. A practice trial with five items, which were not the target items, was conducted for familiarization with the task format. In both testing sites, the productions were recorded in a sound-attenuated booth. In the US, the recordings were collected using an AKG C520 head-mounted microphone and a Marantz PMD570 solid state recorder with a sampling rate of 48 kHz and a sample size of 16 bits. In Mexico, the recordings were collected using an AKG C520 head-mounted microphone and a Zoom H4n handy portable digital recorder with a sampling rate of 44.1 kHz and a sample size of 16 bits. The microphone was positioned approximately 2 inches away from each participant's mouth. The sound files collected in the US were resampled to 44.1 kHz to match the ones collected in Mexico.
Coding and analysis
Acoustic analyses were conducted on the stress correlates of each prosodic context. In nuclear positions, the duration, pitch, and intensity differences between the penultimate (V1) and final vowels (V2) of the stress minimal pairs (e.g., /a/ and /o/ in Canto ‘I sing’ and Cantó ‘He/She/You (formal) sang’) were analyzed, since stress minimal pairs in this prosodic context are distinguished by the relative prominence between these two vowels. The duration (s), average pitch (Hz), and average intensity (dB) of V1 and V2 were extracted using scripts in Praat (Boersma & Weenink, Reference Boersma and Weenink2015) and the raw values were normalized using z-score normalization in order to control for individual differences. Segmentation of the vowels was first performed using EasyAlign (Goldman, Reference Goldman2011) which is an automatic phonetic alignment tool developed as a plug-in of Praat (Boersma & Weenink, Reference Boersma and Weenink2015). Later, the results were individually checked and manually corrected when needed by the author using the formant structure in the spectrogram and the periodicity of the waveform. That is, the beginning and end of a vowel were identified as the zero-crossing points of the regular periodic signal (in the waveform) closest to the onset and the offset of a continuous F2 (in the spectrogram) (Baker, Reference Baker and Montreuil2006; Recasens, Reference Recasens, Hardcastle and Hewlett1999).
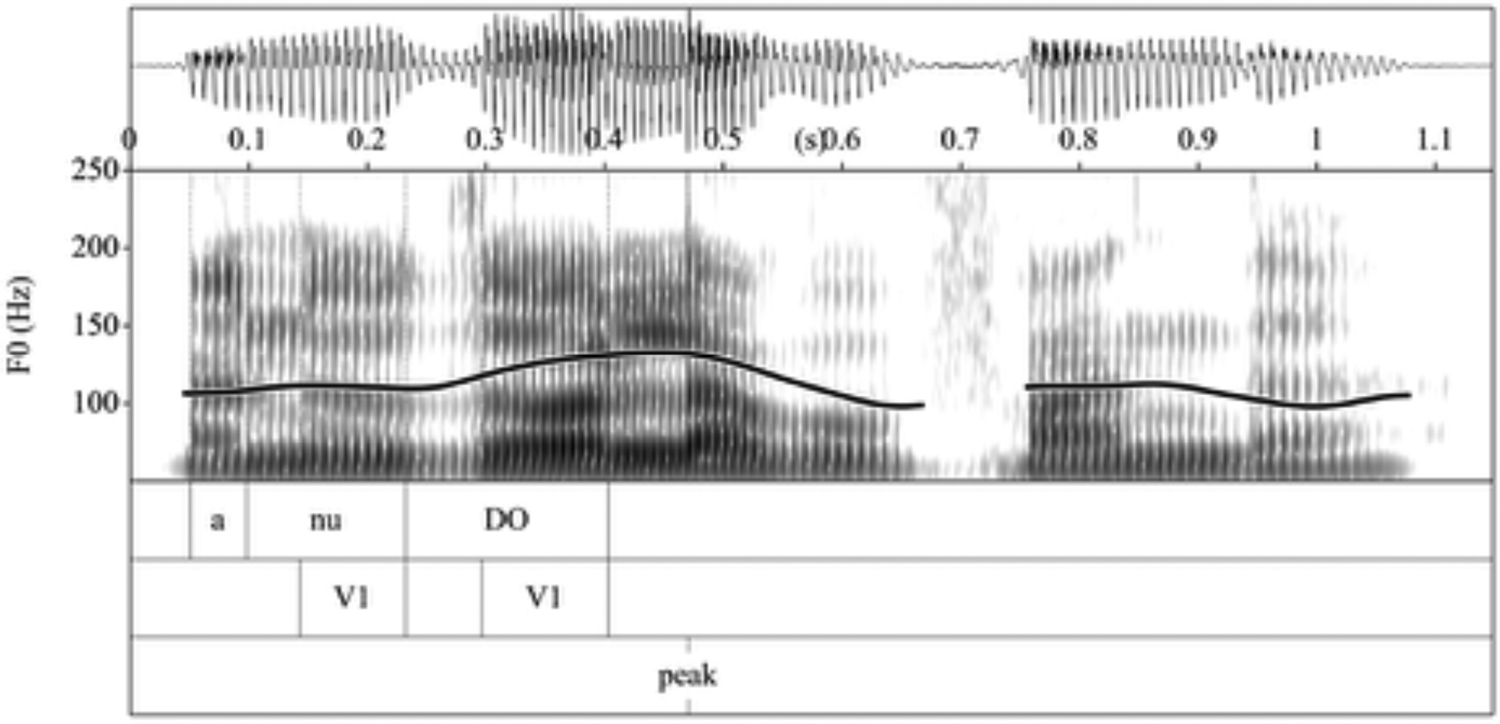
In prenuclear positions, V1-V2 duration difference and the degree of f0 peak displacement were analyzed. The degree of f0 peak displacement was defined as the distance (s) from the onset of the stressed syllable to the point in which the f0 peak occurred. Figure 2 demonstrates an example of f0 peak displacement in prenuclear position.
Location of f0 peak in Anudó la bufanda. ‘He/She/You (formal) tied the scarf.’ produced by a Spanish monolingual speaker.

The exact location of the f0 peak was determined semi-automatically by selecting a region in which an f0 peak was detected and extracting the point of the maximum pitch in that region. As the comparisons were done across different items, the raw f0 peak displacement values were normalized by dividing them into the duration of the stressed syllable. Lastly, in unaccented contexts, only V1-V2 duration difference was analyzed. Tokens that were produced before/after a pause, with creaky voice, or unexpected intonation patterns (e.g., falling contour for questions, rising contour for declarative sentences) were excluded. Moreover, only complete minimal pairs were included in the analyses. That is, if a token was excluded due to any of the reasons above, the other token from the same minimal pair was also excluded from the analyses.
The effects of group (heritage speaker/monolingual/L2 learner) and stress pattern (paroxytone/oxytone), and the interaction between the fixed factors on the stress correlates of each prosodic context were analyzed using linear mixed effects modeling with subject and item as random effects using the lmer function in the lme4 package (Bates et al., Reference Bates, Maechler, Bolker and Walker2015). For each fixed factor, the levels were compared using simple contrast coding in which each level is compared to the reference level and the intercept is the grand mean. The reference group was the heritage speakers and the reference stress pattern was the paroxytones. The best fitting models were selected through backward elimination and the p-values were obtained via Satterthwaite approximation using the lmerTest package (Kuznetsova, Brockhoff & Christensen, Reference Kuznetsova, Brockhoff and Christensen2017). Further pairwise comparisons were conducted using the lsmeans function in the lsmeans package (Lenth, Reference Lenth2016).
ResultsFootnote 10
Among the 4,080 target stress minimal pairs, 1,809 tokens were excluded due to the reasons mentioned above and 745 tokens were excluded due to incomplete stress minimal pairs, leaving a total number of 2,803 stress minimal pairs to analyze.
Nuclear position
Figure 3 demonstrates V1-V2 difference in duration, pitch, and intensity in nuclear positions by group and stress pattern. V1-V2 difference higher than 0 (marked with horizontal dashed lines) indicates that V1 was produced with longer duration, higher pitch, and higher intensity than V2.
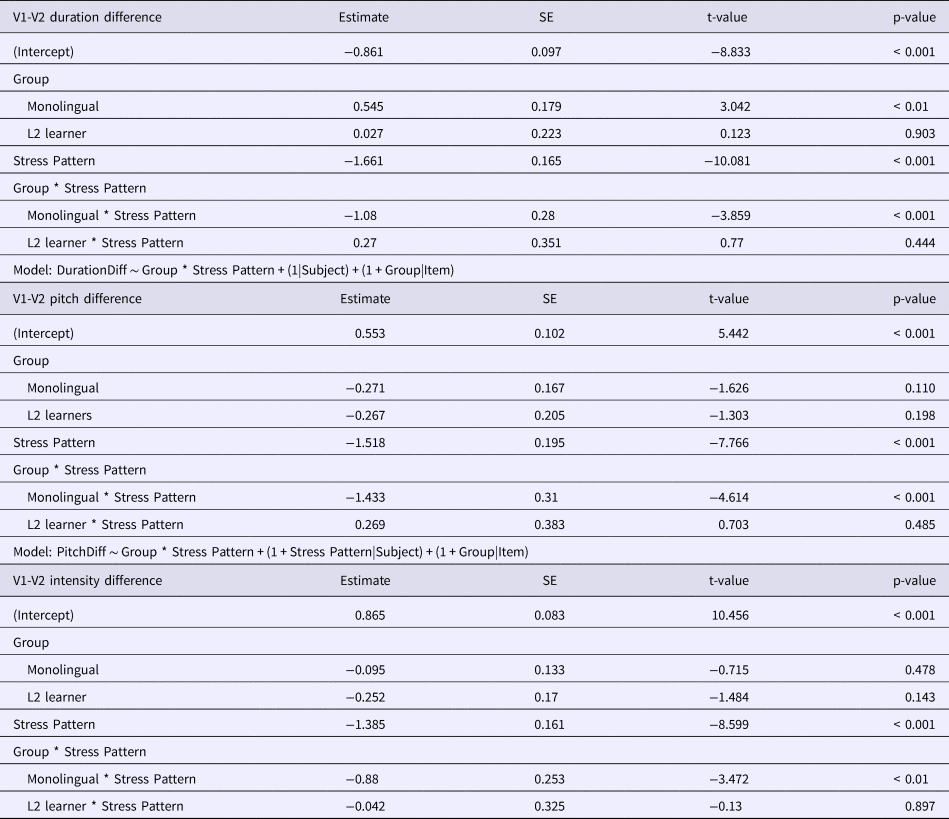
Table 4 shows the statistical results of V1-V2 difference in duration, pitch, and intensity. Overall the heritage speakers (reference level) produced significantly smaller V1-V2 duration difference than the monolinguals, while their overall V1-V2 difference in pitch and intensity did not differ from that of the monolinguals. In the three stress correlates, there was a main effect of stress pattern and a significant interaction between group (monolingual) and stress pattern. That is, the difference between the paroxytones (reference level) and the oxytones was larger for the monolinguals than the heritage speakers, and this pattern was consistently found across the stress correlates. No main effect of group (L2 learner) or interaction between group (L2 learner) and stress pattern was found.
Linear mixed effects modeling results of normalized duration, pitch, and intensity difference between penultimate (V1) and final vowels (V2) in nuclear position in Experiment 2

Model: IntensityDiff ~ Group * Stress Pattern + (1 + Stress Pattern|Subject) + (1|Item).
Pairwise comparisons with group and stress pattern revealed that heritage speakers' V1-V2 duration difference of the paroxytones was significantly smaller than that of the monolinguals (β = −1.857, SE = 0.275, t = −3.941, p < 0.01), while no significant difference was found between their oxytones. V1-V2 pitch difference demonstrated an opposite pattern; heritage speakers' V1-V2 pitch difference of the oxytones was larger than that of the monolinguals (β = 0.987, SE = 0.234, t = 4.21, p < 0.01), while no significant difference was found between their paroxytones. Regarding V1-V2 intensity difference, while heritage speakers' V1-V2 intensity difference of the oxytones was slightly larger than that of the monolinguals (see Figure 3), this difference did not reach significance level.
Normalized duration, pitch, and intensity difference between penultimate (V1) and final vowels (V2) in nuclear position in Experiment 2 (M: Spanish monolinguals, HS: Spanish heritage speakers, L2: English L2 learners of Spanish).

The scatterplots in Figure 4 demonstrate the distribution of the paroxytones and the oxytones in nuclear positions with regard to the relationships among the three stress correlates. The heritage speakers showed similar patterns with the L2 learners in that their distribution of the paroxytones and the oxytones largely overlapped. Regardless of the stress patterns, the majority of heritage speakers' and L2 learners' V1-V2 duration difference values were negative (longer V2), while their V1-V2 pitch and intensity difference values were mainly positive (V2 with lower pitch and intensity). The monolinguals, on the other hand, clearly distinguished the two stress patterns forming two separate clouds, one for the paroxytones and the other for the oxytones; monolinguals' paroxytones were distributed mainly in the area with positive V1-V2 difference values and their oxytones were distributed mainly in the area with negative V1-V2 difference values. Moreover, the distinction between the two stress patterns became more evident when using a combination of duration and pitch, compared to combinations of intensity and other cues.
Distribution of paroxytone and oxytone tokens in nuclear position in Experiment 2.

Prenuclear position
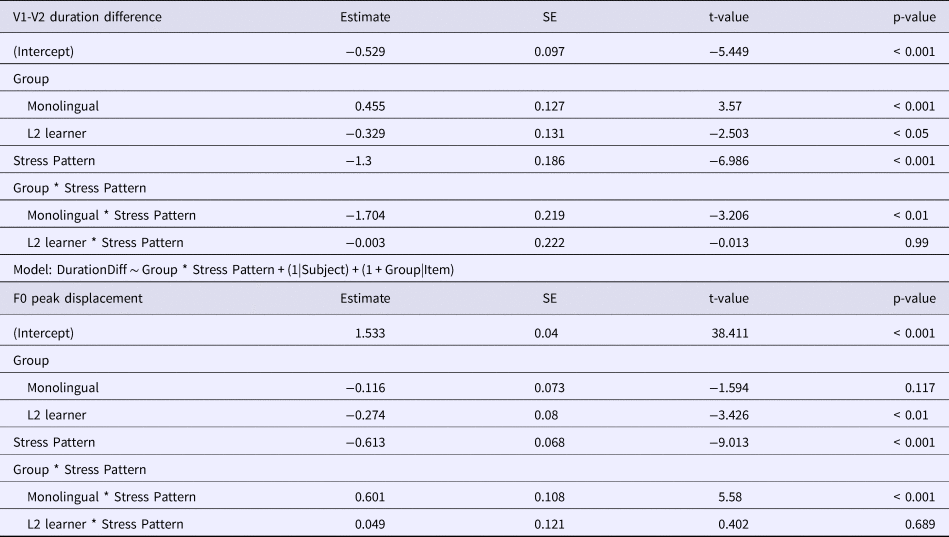
Figure 5 demonstrates V1-V2 duration difference and the f0 peak displacement in prenuclear positions by group and stress pattern. V1-V2 duration difference higher than 0 (marked with horizontal dashed lines) indicates that V1 was produced with longer duration than V2. The two vertical dashed lines in the f0 peak displacement graph indicate the onset and offset of stressed syllables. Thus, if the value is within the two lines, it suggests that the f0 peak was aligned with the stressed syllable and if the value is outside the two lines, it indicates that the f0 peak was displaced to a previous or a following syllable. Table 5 demonstrates the statistical results of V1-V2 duration difference and f0 peak displacement.
Normalized duration difference between penultimate (V1) and final vowels (V2) (left) and normalized distance between stressed syllable onset and f0 peak in prenuclear position (right) in Experiment 2 (M: Spanish monolinguals, HS: Spanish heritage speakers, L2: English L2 learners of Spanish).

Linear mixed effects modeling results of normalized duration difference between penultimate (V1) and final vowels (V2) and normalized f0 peak displacement in prenuclear position in Experiment 2

Model: F0Alignment ~ Group * Stress Pattern + (1 + Stress Pattern|Subject) + (1 + Group|Item).
Results showed that overall heritage speakers' (reference level) V1-V2 duration difference was significantly lower than that of the monolinguals and significantly higher than that of the L2 learners. There was also a significant effect of stress pattern and a significant interaction between group (monolingual) and stress pattern. That is, the oxytones were produced with smaller V1-V2 duration difference than the paroxytones (reference level) and the difference between the two stress patterns was larger for the monolinguals than for the heritage speakers. Pairwise comparisons with group and stress pattern revealed that heritage speakers' V1-V2 duration difference of the paroxytones was significantly smaller than that of the monolinguals (β = −0.807, SE = 0.175, t = −4.615, p < 0.001), while no significant difference was found between their oxytones.
With regard to the f0 peak displacement, results showed that there were main effects of group (L2 learner) and stress pattern. That is, overall the heritage speakers (reference level) displaced the f0 peaks to a larger extent than the L2 learners and the f0 peaks of the paroxytones (reference level) were displaced to a larger extent than those of the oxytones. There was also a significant interaction between group (monolingual) and stress pattern, suggesting that the difference between the two stress patterns was smaller for the monolinguals than for the heritage speakers. Pairwise comparisons with group and stress pattern revealed that the heritage speakers displaced the f0 peaks to a significantly larger degree than the monolinguals when producing the paroxytones (β = 0.416, SE = 0.108, t = 3.861, p < 0.01), while no group difference was found in the f0 peaks displacement of the oxytones. Moreover, while the monolinguals displaced the f0 peaks to a similar degree in the two stress patterns, the heritage speakers displaced the f0 peaks to a significantly larger degree for the paroxytones than the oxytones (β = 0.83, SE = 0.098, t = 8.416, p < 0.001)Footnote 11.
Figure 6 demonstrates the distribution of the paroxytones and the oxytones in prenuclear positions with regard to V1-V2 duration difference and the distance from the f0 peak to word offset (ms). The paroxytones and the oxytones largely overlapped in heritage speakers' and L2 learners' speech, while the monolinguals made a clear distinction between the two stressed patterns.
Distribution of paroxytone and oxytone tokens in prenuclear position in Experiment 2.

Unaccented context
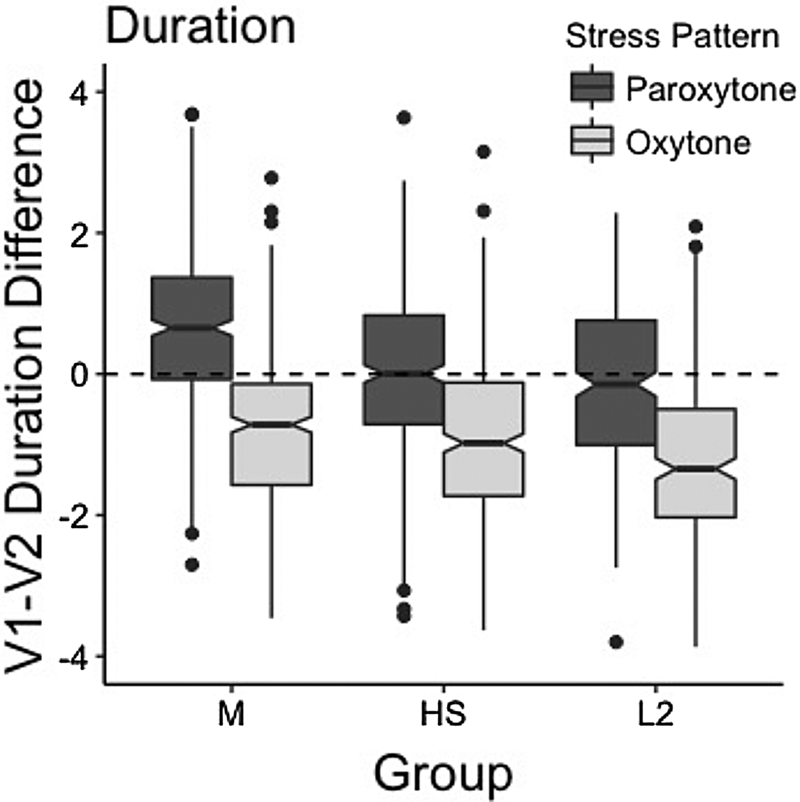
Figure 7 demonstrates V1-V2 duration difference in unaccented context by group and stress pattern and the statistical results are presented in Table 6.
Normalized duration difference between penultimate (V1) and final vowels (V2) in unaccented context in Experiment 2 (M: Spanish monolinguals, HS: Spanish heritage speakers, L2: English L2 learners of Spanish).
Linear mixed effects modeling results of normalized duration difference between penultimate (V1) and final vowels (V2) in unaccented context in Experiment 2

Model: DurationDiff ~ Group * Stress Pattern + (1|Subject) + (1 + Group|Item).
Results showed that V1-V2 duration difference in unaccented contexts shared the same pattern with V1-V2 duration difference in prenuclear positions. Heritage speakers' (reference level) V1-V2 duration difference was significantly lower than that of the monolinguals and significantly higher than that of the L2 learners. There was also a significant effect of stress pattern and a significant interaction between group (monolingual) and stress pattern. That is, the oxytones were produced with smaller V1-V2 duration difference than the paroxytones (reference level) and the difference between the paroxytones and the oxytones was larger for the heritage speakers, compared to the monolinguals. Pairwise comparisons with group and stress pattern revealed that heritage speakers' V1-V2 duration difference for the paroxytones was significantly smaller than that of the monolinguals (β = 0.416, SE = 0.108, t = 3.861, p < 0.01), while the two groups had similar V1-V2 duration difference for the oxytones.
Discussion
Our findings in Experiment 2 demonstrate that the heritage speakers largely deviated from the monolinguals and performed similarly to the L2 learners when producing Spanish stress minimal pairs. In nuclear positions, heritage speakers' V1-V2 duration difference was overall smaller than that of the monolinguals, due to their small V1-V2 duration difference for the paroxytones. While the majority of monolinguals' stressed vowels were produced with longer duration than the unstressed vowels regardless of the stress patterns, more than half of heritage speakers' paroxytones were produced with longer unstressed vowels. The same pattern was found in the L2 learner data. The longer unstressed vowels in the paroxytones may be due to stress misplacement which have been observed in the speech of both heritage speakers (Knightly et al., Reference Knightly, Jun, Oh and Au2003; Robles-Puente, Reference Robles-Puente2014) and L2 learners (Adams, Reference Adams1979; González & Romero, Reference González and Romero2007; Knightly et al., Reference Knightly, Jun, Oh and Au2003; Lord, Reference Lord2007). That is, it is possible that the heritage speakers and the L2 learners produced the paroxytones as if they were oxytones. If this was the case, other stress correlates should align with the patterns found in duration.
However, heritage speakers' use of pitch and intensity was not consistent with their use of duration. Their oxytones were produced with significantly larger V1-V2 pitch difference than those of the monolinguals, while no difference was found between their paroxytones. Moreover, approximately half of heritage speakers' unstressed vowels in the oxytones were produced with higher pitch than the stressed vowels (see Figure 3). The monolinguals produced the stressed vowels with higher pitch than the unstressed vowels in both stress patterns. Regarding intensity, while heritage speakers' oxytones were produced with slightly larger V1-V2 intensity difference than the monolinguals (similar to V1-V2 pitch difference), the values between the two groups did not reach statistical significance. In fact, not only the heritage speakers, but also the monolinguals produced half of the unstressed vowels in the oxytones with higher intensity than the stressed vowels (see Figure 3). In this study, the target words in nuclear positions were produced in isolation (e.g., Ceno. ‘I eat dinner’) or after a clitic (e.g., La tapo. ‘I cover it.’) (i.e., at the end of an utterance). Thus, the results of the monolingual data suggest that, among the three stress correlates, intensity is the least robust cue to lexical stress in Spanish, most likely due to loss of energy which commonly occurs at the end of an utterance (Davis, MacNeilage, Matyear & Powell , Reference Davis, MacNeilage, Matyear and Powell2000; Lieberman, Reference Lieberman1984; Smith, Reference Smith1978). When compared to the L2 learners, the heritage speakers did not show any significant difference in their use of pitch and intensity.
Therefore, rather than stress misplacement, it is more likely that the heritage speakers (and the L2 learners) lengthened the final vowel as a way to compensate for the decrease of pitch and intensity. While phrase-final lengthening has been observed across many languages, its phonetic realization is subject to language-specific variation (Hirst & Di Cristo, Reference Hirst, Di Cristo, Hirst and Di Cristo1998; Hockey & Fagyal, Reference Hockey and Fagyal1998; Ortega-Llebaria & Prieto, Reference Ortega-Llebaria, Prieto, Prieto, Mascaró and Solé2007; Prieto, Vanrell, Astruc, Payne & Post, Reference Prieto, Vanrell, Astruc, Payne and Post2012; Rao, Reference Rao and Ortega-Llebaria2010). For instance, phrase-final lengthening occurs to a lesser degree in Spanish (Ortega-Llebaria & Prieto, Reference Ortega-Llebaria, Prieto, Prieto, Mascaró and Solé2007; Prieto et al., Reference Prieto, Vanrell, Astruc, Payne and Post2012), compared to English in which substantial phrase-final lengthening has been documented (Davis et al., Reference Davis, MacNeilage, Matyear and Powell2000; Klatt, Reference Klatt1975; Lehiste, Reference Lehiste, Lindblom and Ohman1979; Lieberman, Reference Lieberman1984; Smith, Reference Smith1978; Wightman, Shattuck-Hufnagel, Ostendorf & Price, Reference Wightman, Shattuck-Hufnagel, Ostendorf and Price1992). Thus, heritage speakers' and L2 learners' longer unstressed vowels in paroxytones may be a result of English-like phrase-final lengthening.
In prenuclear positions, tonal alignment, together with duration, is an important stress correlate. Similar to our findings in nuclear positions, heritage speakers' V1-V2 duration difference was smaller than that of the monolinguals in this position, mainly due to their small V1-V2 duration difference when producing the paroxytones. Approximately half of heritage speakers' paroxytones were produced with longer unstressed vowels. The same pattern was observed in the L2 learners, although their V1-V2 duration difference was overall smaller than that of the heritage speakers (see Figure 5).
With respect to the tonal alignment of lexical stress, heritage speakers' overall degree of f0 peak displacement did not differ significantly from that of the monolinguals. However, when comparing the degree of f0 peak displacement between the paroxytones and the oxytones, the heritage speakers displaced the f0 peaks from the stress syllable onset to a larger degree when producing the paroxytones than when producing the oxytones, while the monolinguals displaced the f0 peaks to a similar degree in the two stress patterns. The L2 learners also displaced the f0 peaks to a larger degree when producing the paroxytones. However, their degree of f0 peak displacement was overall smaller than that of the heritage speakers. Interestingly, when producing the oxytones, the L2 learners aligned the f0 peak within the stressed syllable in almost half of the cases, instead of displacing it to a following syllable (see Figure 5). English prenuclear pitch accents are generally marked as an f0 peak within the stressed syllable (H*) (Estebas-Vilaplana, Reference Estebas-Vilaplana2007; Lleó et al., Reference Lleó, Rakow, Kehoe and Face2004). Thus, this finding suggests that English may have an effect on L2 learners' tonal alignment when they produce Spanish lexical stress in prenuclear positions. Note that, unlike the oxytones, the f0 peaks of L2 learners' paroxytones were seldom aligned with the stressed syllables; instead they were displaced to a following syllable.
Heritage speakers' and L2 learners' larger f0 peak displacement in paroxytones is consistent with the pattern found in the duration cue, in that they both suggest that the heritage speakers and the L2 learners may have misplaced the stress and produced some paroxytones as if they were oxytones. Thus, while the monolinguals clearly distinguished the two stress patterns using duration and tonal alignment cues, a large overlap was observed in heritage speakers' and L2 learners' speech (Figure 6).
Lastly, in unaccented contexts, duration is considered as the main acoustic correlate of Spanish lexical stress (Torreira et al., Reference Torreira, Simonet, Hualde, Campbell, Gibbon and Hirst2014). Participants' use of duration cue in unaccented contexts showed the same pattern as in prenuclear positions. Heritage speakers' V1-V2 duration difference was overall smaller than that of the monolinguals, due to their small V1-V2 duration difference when producing the paroxytones. Although heritage speakers' overall V1-V2 duration difference was larger than that of the L2 learners, both groups produced approximately half of the paroxytones with longer unstressed vowels, demonstrating a large overlap between the two stress patterns (see Figure 7).
Overall, the findings of Experiment 2 suggest that, unlike the monolinguals who clearly distinguished the two stress patterns using relevant stress correlates in each prosodic context, the heritage speakers and the L2 learners did not use these cues in a consistent manner. Instead, they demonstrated a large overlap between the paroxytones and the oxytones, most likely due to: phrase-final lengthening when they were in nuclear positions; and stress misplacement when they were in other prosodic contexts.
General discussion
The present study investigated the relationship between Spanish heritage speakers' perception and production of Spanish lexical stress by taking into account different prosodic contexts (nuclear position, prenuclear position and unaccented context) and the relevant acoustic correlates of lexical stress in these contexts. Since heritage speakers speak the heritage language less frequently than they hear it (Campbell & Rosenthal, Reference Campbell, Rosenthal and Rosenthal2000; Beaudrie & Ducar, Reference Beaudrie and Ducar2005; Hakuta & D'Andrea, Reference Hakuta and D'Andrea1992; Hurtado & Vega, Reference Hurtado and Vega2004; Potowski, Reference Potowski2004) and a large amount of time and practice is needed to develop stable target-like speech production (Godson, Reference Godson2004; Knightly et al., Reference Knightly, Jun, Oh and Au2003; Trofimovich & Baker, Reference Baker and Montreuil2006, Reference Trofimovich and Baker2007), we hypothesized that Spanish heritage speakers will show a more non-target-like behavior in their production than their perception regardless of the prosodic context.
The results of the present study confirmed our hypothesis: the heritage speakers performed more similarly to the monolinguals when perceiving lexical stress than when producing it, and this pattern was consistent across the prosodic contexts in which stress correlates vary. The perception results showed that, while the L2 learners had difficulty distinguishing Spanish stress minimal pairs, the heritage speakers were sensitive to varying stress correlates and their performance was comparable to that of the monolinguals. Unlike the perception results, the production results showed that the heritage speakers diverged from the monolinguals and behaved more similarly to the L2 learners; while the monolinguals used a combination of relevant stress correlates to distinguish paroxytones from oxytones, the heritage speakers and the L2 learners did not effectively use these cues and demonstrated a large overlap between the two stress patterns.
Figure 8 is an example that clearly shows the relationship between the perception and production of lexical stress in the three groups. The upper panel shows participants' rates of paroxytone responses when listening to paroxytone and oxytone stimuli in nuclear positions in Experiment 1. The stimuli are distributed in a two-dimensional space with V1-V2 pitch difference on one axis and V1-V2 duration difference on the other. The lower panel shows the distribution of participants' productions of paroxytones and oxytones in Experiment 2 in the same two-dimensional space. The monolinguals and the L2 learners showed consistent patterns between the perception and the production. The monolinguals correctly perceived the paroxytone stimuli (not the oxytone ones) as paroxytones based on the duration and pitch cues and they effectively used these cues to distinguish the paroxytones and the oxytones in their production. The L2 learners did not use any of these cues in a consistent manner to distinguish the two stress patterns in either their perception or production. With regard to the heritage speakers, similar to the monolinguals, they successfully identified the paroxytone stimuli as such based on the duration and pitch cues, but they did not systematically use them in their production.
Paroxytone rates of stimuli in nuclear position in Experiment 1 plotted in scatterplots of duration and pitch difference between penultimate (V1) and final vowels (V2) (upper panel) and scatterplots of the same stress correlates in Experiment 2 (lower panel).

The discrepancy found between heritage speakers' perception and production suggests that the link between speech perception and production is not always automatic. Despite English being the more frequently used language, compared to Spanish, the heritage speakers in this study did not show transfer from English in their perception of Spanish lexical stress. Heritage speakers' target-like perception of heritage language speech sounds may be due to lasting effects of early exposure to the heritage language and/or continued input in the heritage language at home and through media. Nevertheless, non-target-like patterns may be found in their production when heritage language use reduces. While further research with a detailed questionnaire should be carried out to compare the exact amount of heritage language input and use and examine their link to discrepancies between heritage language perception and production, the present study has implications for the importance of continued use of the heritage language.
This study also has some limitations that should be accounted for in future research. The results of the oral picture-naming task showed that the heritage speakers had higher proficiency in Spanish than the L2 learners. This is a possible confound, because heritage speakers' better performance in the perception of Spanish lexical stress (Experiment 1) may be due to their higher Spanish proficiency, not necessarily because of their early exposure to Spanish. Future study should control for heritage speakers' and L2 learners' Spanish proficiency to tease apart the effects of Spanish proficiency and input on their perception of Spanish lexical stress. However, it is important to note that, nonetheless, the heritage speakers still performed like the L2 learners when they produced Spanish lexical stress (Experiment 2). This finding suggests that early exposure to the heritage language alone is not sufficient to develop stable target-like production.
Based on heritage speakers' production of stress correlates, the present study suggested that the overlap between their paroxytones and oxytones is possibly due to phrase-final lengthening (nuclear positions) and stress misplacement (prenuclear positions and unaccented contexts). However, it is uncertain how Spanish listeners perceive these tokens. Thus, a native listener judgment task should be carried out to confirm whether the conflicting stress correlates mainly found in heritage speakers' paroxytones indeed lead to miscomprehension. This measure will also be useful to directly examine the correlation between heritage speakers' perception and production.
It is also important to note that the present study collected heritage speakers' production data through a sentence reading task. Heritage speakers generally lack literacy skills, because they learn the heritage language orally, unlike L2 learners who generally learn the L2 through textbooks in the classroom (Campbell & Rosenthal, Reference Campbell, Rosenthal and Rosenthal2000; Montrul, Reference Montrul2011; Polinsky & Kagan, Reference Polinsky and Kagan2007). Therefore, future research should examine heritage speakers' production of lexical stress in various registers, including spontaneous speech, to have a more comprehensive understanding of their use of suprasegmental cues when marking lexical stress.
Conclusion
The present study analyzed Spanish heritage speakers' use of suprasegmental information in their perception and production of Spanish lexical stress. The findings demonstrate that early exposure to the heritage language is beneficial in later perception of heritage language speech sounds (Au et al., Reference Au, Oh, Knightly, Jun and Romo2008; Knightly et al., Reference Knightly, Jun, Oh and Au2003; Oh et al., Reference Oh, Jun, Knightly and Au2003). The heritage speakers were comparable to Spanish monolinguals when distinguishing Spanish stress minimal pairs in various prosodic contexts. Stress minimal pairs in Spanish are distinguished mainly by suprasegmental information, which differ from English in which segmental and suprasegmental information covary. Thus, this finding supports that, despite English being their dominant language, heritage speakers are able to attend to relevant suprasegmental cues when perceiving Spanish lexical stress. However, when producing Spanish stress minimal pairs, the heritage speakers diverged from the monolinguals and behaved more similarly to the L2 learners. While the monolinguals used a combination of relevant stress correlates to distinguish paroxytones from oxytones, heritage speakers' stress correlates largely overlapped between the two stress patterns, especially the duration cue; they produced the final vowels longer than the penultimate vowels for both paroxytones and oxytones and this pattern was consistent across the prosodic contexts. As shift to English (majority language) generally occurs as heritage speakers grow up, the discrepancy found between heritage speakers' perception and production of Spanish lexical stress provides implications for the importance of continued use of the heritage language. Speech production requires complex coordination of articulatory movement and substantial amounts of time and practice are needed to develop stable target-like speech production. Thus, without continued use of the heritage language, early exposure to the heritage language alone may not guarantee target-like production.
Supplementary Material
Supplementary material can be found online at http://doi.org/10.1017/S1366728918001220
Author ORCIDs
Ji Young Kim, 0000-0002-5708-6461
Acknowledgements
I would like to express my deepest appreciation to José Ignacio Hualde for his invaluable feedback, as well as the anonymous reviewers for their helpful comments and suggestions. I would also like to thank Eduardo Velázquez for his help and support in the data collection in Mexico and all my participants who not only willingly participated in the study, but also provided me with fresh new insights on heritage speakers. This research was supported by a grant from the National Science Foundation (BCS-1424329).