Implications
Results from this study reveal insights into the profile of cow locomotion score and lameness throughout lactation. Both traits are of considerable interest and importance to dairy farmers and breeders around the world. The outcomes of the study also indicate the existence of heritable variation in the two traits which can be used to genetically improve locomotion and lameness without adversely affecting other important traits. Practical implementation of the results can contribute to better on-farm management and enhanced genetic selection and breeding programmes.
Introduction
Lameness is a major health and welfare issue for dairy cattle worldwide (Greenough, Reference Greenough2007). Together with reproductive failure and mastitis, lameness is one of the most common causes of cow culling (United States Department of Agriculture, 2007). Reported incidence and prevalence range from 23.7% to 54.6% and 15.0% to 62.0%, respectively (Whitaker et al., Reference Whitaker, Kelly and Smith2000; Haskell et al., Reference Haskell, Rennie, Bowell, Bell and Lawrence2006; Archer et al., Reference Archer, Green and Huxley2010). In the Netherlands, the cost per case has been estimated to range from €48 to 886, including treatment associated expenses, milk yield loss and discarded milk, increased calving intervals and culling (Noordhuizen, Reference Noordhuizen2012).
Lameness is a symptom, not a disease. Regardless of the actual cause, it is perceived as impaired locomotion of variable severity (Greenough, Reference Greenough2007). In order to quantify this impairment, various 3- to 6-point scales have been developed by different research groups, based mainly on gait and posture characteristics (Amory et al., Reference Amory, Kloosterman, Barker, Wright, Blowey and Green2006; Archer et al., Reference Archer, Green and Huxley2010). These are generally considered credible descriptors of lameness severity; when one such system was tested, it was found to be well correlated with foot lesions (Bicalho et al., Reference Bicalho, Cheong, Cramer and Guard2007a). Locomotion scoring is a widespread management practice, providing useful epidemiological data, both for monitoring and confronting the problem (Haskell et al., Reference Haskell, Rennie, Bowell, Bell and Lawrence2006). However, a pattern of lameness dynamics before first calving and during a complete lactation is lacking as published research has mainly focused on the first stage of lactation, trying: (a) to identify correlations with milk production and reproductive performance or (b) to ascertain the influence of putative risk factors. Causes of lameness are classified as either contagious or as a disruption of claw horn formation and are actually multifactorial in nature (Greenough, Reference Greenough2007). Several management-related issues like farming system, nutrition, cow comfort and hygienic conditions are well-recognised risk factors and they are specifically targeted during farm investigations dealing with increased prevalence of lameness (Cook, Reference Cook2003; Amory et al., Reference Amory, Kloosterman, Barker, Wright, Blowey and Green2006; Espejo and Endres, Reference Espejo and Endres2007).
Unambiguously, lameness is a heritable trait, as well. Heritability estimates of locomotion scores either for diagnosing lameness (Van Dorp et al., Reference Van Dorp, Boettcher and Schaeffer2004) or as a linear trait assessed as part of a linear type classification scheme (Onyiro and Brotherstone, Reference Onyiro and Brotherstone2008; Laursen et al., Reference Laursen, Boelling and Mark2009; van der Linde et al., Reference van der Linde, de Jong, Koenen and Eding2010) range from 0.05 to 0.14. Heritability of lameness itself has been estimated to range from 0.07 to 0.10 (Boettcher et al., Reference Boettcher, Dekkers, Warnick and Wells1998; Pryce et al., Reference Pryce, Nielsen, Veerkamp and Simm1999; Zwald et al., Reference Zwald, Weigel, Chang, Welper and Clay2004). Early heritability estimates of specific foot diseases/lesions (Koenig et al., Reference Koenig, Sharifi, Wentrot, Landmann, Eise and Simianer2005; van der Waaij et al., Reference van der Waaij, Holzhauer, Ellen, Kamphuis and de Jong2005) ranged from 0.01 to 0.11; more recent ones range from 0.03 to 0.07 (Onyiro et al., Reference Onyiro, Andrews and Brotherstone2008; van der Linde et al., Reference van der Linde, de Jong, Koenen and Eding2010; Buch et al., Reference Buch, Sorensen, Lassen, Berg, Eriksson, Jakobsen and Sorensen2011). Reported genetic correlations with body condition score (Van Dorp et al., Reference Van Dorp, Boettcher and Schaeffer2004; Onyiro et al., Reference Onyiro, Andrews and Brotherstone2008) and reproductive performance (Buch et al., Reference Buch, Sorensen, Lassen, Berg, Eriksson, Jakobsen and Sorensen2011; Zink et al., Reference Zink, Stipkova and Lassen2011) were unfavourable; on the other hand, they were favourable with milk yield and milk component traits (Van Dorp et al., Reference Van Dorp, Dekkers, Martin and Noordhuizen1998; Buch et al., Reference Buch, Sorensen, Lassen, Berg, Eriksson, Jakobsen and Sorensen2011). None of these studies discriminate between before and after first calving or between different stages of lactation. Calving and lactation onset is a stressful event and environmental effects are expected to be greater around and, cumulatively, after lactation peak.
Most of the research papers cited above also report significant genetic correlations of lameness, locomotion scores and specific diseases/lesions with feet conformation traits (feet and leg composite, rear leg side view, rear leg rear view and foot angle) based on cow records. Swalve et al. (Reference Swalve, Alkhoder and Pijl2008) derived prediction equations of daughter locomotion score and lameness from their sires’ estimated breeding values for conformation traits. This could facilitate farmers’ decisions regarding sire selection, as part of a multi-trait selection index, in order to decrease the incidence and prevalence of lameness in their herds.
The objective of this study was: (i) to determine the profile of locomotion score and lameness before the first calving and throughout the first and second lactation, (ii) to investigate whether heritability estimates and their correlation with milk yield, body condition score, BW and reproduction of these traits vary throughout the same period, and (iii) to derive cow locomotion and lameness predictions from their sires’ breeding values for conformation traits.
Material and methods
Animals and data
Data were derived from a large commercial Holstein herd in Northern Greece; the farm was closely monitored by the authors’ research team from January 2008 until April 2010. Cows were housed in two similar free-stall barns; the lying surfaces were covered with rubber mattresses without extra bedding. Walking surface was grooved concrete and no outside exercise area was provided. Cows were fed, twice a day, a total mixed ration to meet their energy and protein requirements. Ration formulation was based on US National Research Council recommendations (NRC, 2001). Cows were bred using artificial insemination, either after a natural oestrus or after being synchronized using the Ovsynch protocol, described by (Stevenson et al., Reference Stevenson, Kobayashi, Shipka and Rauchholz1996). A total of 303 cows (237 in their first and 66 in their second lactation) were included in the study. These cows had been imported from five different countries (Denmark, France, Germany, the Netherlands and Switzerland) as pregnant heifers and were daughters of 155 proven sires. About 10% of the sires were common across the five countries. All cows had complete pedigree. All cows were monitored on a weekly basis throughout their respective lactation leading to the collection of a total of 12 221 repeated records on various traits as described below.
The locomotion of each cow was evaluated weekly throughout the entire lactation by the leading author, a trained veterinarian, during the animal’s exit from the milking parlour, using the method described by Rajkondawar et al. (Reference Rajkondawar, Liu, Dyer, Neerchal, Tasch, Lefcourt, Erez and Varner2006). Briefly, cows received a locomotion score from one to five (in increments of one), where one denoted an animal with a sound, uninhibited and symmetrical gait, and five a seriously lame animal, reluctant or incapable of moving or standing up. For first-lactation cows, weekly locomotion evaluation started 6 weeks before their first calving. Cows with locomotion score equal to one were considered healthy and lameness-free, whereas cows with a locomotion score ⩾2 were considered lame. This is a conservative definition of the condition that combines mild and serious cases of lameness into a single category. All cows diagnosed as lame were hoof trimmed by the leading author; lesions were recorded and treated as necessary.
Body condition score was recorded immediately after the locomotion evaluation by the leading author using the 1- to 5-point scale of Ferguson et al. (Reference Ferguson, Galligan and Thomsen1994) in increments of 0.25. The ends of this scale refer to emaciated (1) and obese (5) animals, respectively. An estimation of BW was also recorded at the time of body condition evaluation as a weight scale was not available on the farm. BW was assessed with the indirect method proposed by Heinrichs et al. (Reference Heinrichs, Rogers and Cooper1992) based on the measurement of the heart girth. The following equation was used to assess BW:
 $$BW=102.71{\minus}(2.876\cdot HG){\plus}(0.02655\cdot HG^{2} )$$
where BW is the body weight (kg); HG the heart girth (cm).
Daily milk yield records were available in the database of the farm (DeLaval in-line milk metres, serviced twice a year). A 7-day average was calculated for each week of locomotion score, lameness, body condition score and BW record. The farm database was also used to derive the following reproductive traits: calving interval (between first and second calving for first-lactation cows and between second and third calving for second-lactation cows), conception rate at first insemination and in the first 305 days of lactation, number of inseminations per conception, and interval from calving to conception. Finally, estimated breeding values of the sires of these cows were obtained from Interbull (International Bull Evaluation Service, 2012) for the following traits: rear leg side view, rear leg rear view, foot angle, overall body conformation, overall feet and leg conformation, body condition score, and locomotion. Since sires were from different countries, their estimated breeding values were expressed on the US scale and base for comparability and consistency.
Statistical analyses
Repeated records of locomotion score and lameness were analysed with the following model; each trait was analysed separately:
 $$\eqalignno{Y_{{ijkmnopq}} =YS_{i} {\plus}C_{j} {\plus}L_{o} {\plus}M_{p} {\plus}S_{q} {\plus}a_{1} {\times}age \cr \quad{\plus}\mathop{\sum}\limits_{n=0}^2 {b_{n} P_{n} W_{m} } {\plus}\mathop{\sum}\limits_{n=0}^2 {A_{{kn}} } P_{n} W_{m} \cr \quad{\plus}\mathop{\sum}\limits_{n=0}^1 {PE_{{kn}} P_{n} W_{m} } {\plus}e_{{ijkmnpq}} $$
where Y ijkmnopq is the locomotion score or lameness record of cow k in week from calving m; YS i the fixed effect of year-season of calving i (four levels); C j the fixed effect of country of origin j of cow (five levels); L o the fixed effect of number of lactation o (two levels); M p the fixed effect of calendar month of the year p (12 levels); S q the fixed effect of barn q (two levels); a 1 the linear regression coefficients on age at calving (age); W m the week m from calving; b n the fixed regression coefficient on week from calving; A kn the random regression coefficient on week from calving associated with the additive genetic effect of cow k (including all pedigree amounting to 2139 animals in total); P n the nth orthogonal polynomial of week from calving (n the order of polynomial); PE kn the random regression coefficient on week from calving associated with the permanent environment effect of cow k; e ijkmnopq the random residual term.
In model 1, the fixed regression coefficient was associated with an overall average lactation curve per lactation for locomotion score and lameness, whereas the random regression was associated with each individual cow’s deviation from the overall curve. The fixed effects in the model were fitted after preliminary analyses showed they had a statistically significant effect (P<0.05) on the traits. The final order of random polynomial (third for either trait) was determined with the use of the log-likelihood test in sequential analyses of gradually increasing orders. Polynomial order is 3 for animal (0, 1, 2) and 2 for permanent environment (0, 1). Four measurement error classes were defined using the time relative to calving as: all weeks before the first calving and weeks 1 to 2, 3 to 39 and 40 to 45 after calving. The definition of these classes aimed to capture the differences in various periods associated with pre-partum, immediate post-partum, main lactation and late lactation. The specific threshold, albeit somewhat subjective, coincided with considerable changes in the variance of locomotion score. Different residual variances were estimated for each measurement error class, while co-variances between these classes were assumed to be zero. A probit function was fitted to model 1 for the analysis of lameness to account of the binary nature of the trait. In this case, results were expressed on the underlying liability scale. Estimates of (co)variance components from model 1 were used to calculate heritabilities for each trait and week from calving. The relevant magnitude of these results was confirmed in a series of repeatability model analyses of data spanning the same time as each of the four measurement error classes.
A series of bivariate analyses using model 1 were also conducted to calculate genetic and phenotypic correlations of locomotion score and lameness on the one hand with milk yield, body condition score and BW on the other. Probit function for the analysis of lameness to account of the binary nature of the trait was used in these analyses, too.
In another series of bivariate analyses, genetic and phenotypic correlations of locomotion score and lameness with reproductive traits were estimated. Locomotion score and lameness repeated records were analysed with model 1 whilst reproduction was analysed with the following model:
 $$\eqalignno {Y_{{ijknopq}} = \,&YS_{i} {\plus}C_{j} {\plus}L_{o} {\plus}S_{q} {\plus}M_{p} {\plus}G_{n} {\plus} \cr &\,a_{1} \cdot age{\plus}a_{r} \cdot dm{\plus}A_{k} {\plus}e_{{ijknopq}} $$
Y ijknopq is the reproductive trait of cow k; YS i the fixed effect of year-season of calving i (four levels); C j the fixed effect of country of origin j of cow (five levels); L o the fixed effect of number of lactation o (two levels); S q the fixed effect of barn q (two levels); M p the fixed effect of calendar month p of the first artificial insemination of the cow (12 levels); G n the fixed effect indicating whether the cow participated in an oestrus synchronisation scheme implemented on the farm (two level); a 1 the linear regression coefficients on age at calving (age); a r the linear regression coefficients on days in milk when the first artificial insemination of the cow took place (dm); A k the random genetic effect of cow k (including all pedigree); e ijknopq the random residual term.
The impact of the sires’ estimated breeding values for conformation traits on daughter first-lactation locomotion score and lameness was assessed by adding a linear regression on the former in model 1. A quadratic regression was also fitted for traits with an intermediate optimum, namely rear leg side view and foot angle. All analyses were conducted using the statistical software package ASREML (Gilmour et al., Reference Gilmour, Gogel, Cullis, Welham and Thompson2006).
Results and discussion
Adjusted average locomotion score and lameness incidence in various time periods are shown in Table 1. The periods coincide with the measurement error classes defined in model 1 that aimed to capture variance differences in distinct periods associated with calving and the ensuing lactation. Both locomotion score and lameness appear to be less of a problem before or immediately after the first calving compared with the main duration of first lactation and the whole second lactation. A likely reason is that high milk production demands in the latter stages of lactation influence the cow’s metabolic profile leading to increased susceptibility to these conditions. Boettcher et al. (Reference Boettcher, Dekkers, Warnick and Wells1998) reported higher lameness prevalence during the earliest stages of lactation but comparisons with our study are difficult due to different demarcation of lactation stages. On the other hand, our results are in agreement with those of Capion et al. (Reference Capion, Thamsborg and Enevoldsen2008) who report lameness prevalence to be lowest before parturition with a gradual increase through the latter stages of lactation.
Average locomotion score (1 to 5 scale) and lameness incidence (0 to 1 scale) of 237 first-lactation and 66 second-lactation dairy cows observed in weekly intervals, in various lactation stages

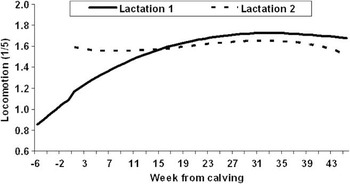
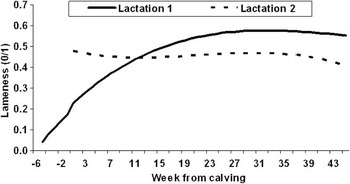
The trends observed in Table 1 are confirmed in Figures 1 and 2 that illustrate the fixed curves for locomotion score and lameness, respectively, derived from the analyses with model 1. These curves are adjusted for all sources of systematic variation that were included in the model as well as the correlation between successive weekly assessments of locomotion score and lameness. Thus, the effect on the locomotion score of a cow in a given week on the score of the following week is effectively accounted for by the function (polynomial) used in model 1 to describe the trajectory of the trait across time. To our knowledge, this is the first report of adjusted locomotion score and lameness profile across a cow’s lactation that also includes data before calving.
Locomotion score profile of 237 first-lactation and 66 second-lactation dairy cows across lactation; random regression mixed model solutions fitting third order polynomials.

Lameness profile across lactation of 237 first-lactation and 66 second-lactation dairy cows; random regression mixed model solutions fitting third order polynomial.

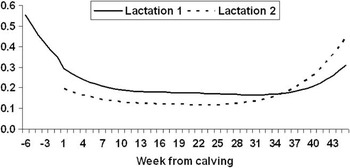
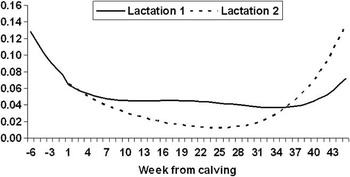
Weekly estimates of the genetic variance for locomotion score and lameness are shown in Figures 3 and 4, respectively. These estimates were derived from the random regression model 1 and were statistically greater than zero (P<0.05) in all cases, demonstrating the presence of genetic factors that control the animal’s capacity for uninhibited movement and resistance to lameness. The estimates before first calving are particularly noteworthy, since no such results have been reported in the literature. Although relatively few locomotion and lameness problems were associated with this period (Figures 1 and 2), the amount of genetic variance present suggests that selection would be particularly effective then.
Estimates of the genetic variance of locomotion score of 237 first-lactation and 66 second-lactation dairy cows by week from calving; standard errors ranged from 0.03 to 0.12.

Estimates of the genetic variance of lameness of 237 first-lactation and 66 second-lactation dairy cows by week from calving; standard errors ranged from 0.01 to 0.04.

Estimates of first-lactation heritability derived from the genetic variances discussed above are shown in Table 2. These are average estimates of weekly heritabilities in the designated time periods and were all significantly greater than zero (P<0.05). Average weekly heritability estimates for the entire period for locomotion score and lameness were 0.39±0.06 and 0.26±0.06.
Average heritability estimates of five traits from 237 first-lactation dairy cows in various stages of lactation (standard errors in parentheses)

BCS=body condition score.
The genetic variance estimates (Figures 3 and 4) were consistent with the heritability of locomotion score and lameness and were greatest before and immediately after the first calving. Heritability estimates for milk yield, body condition score and BW are also shown for comparison. Sizeable heritability estimates for locomotion score and lameness derived throughout lactation suggest that both traits are amenable to improvement with genetic selection, nearly as much as the other traits shown in Table 2, which already feature in the breeding programmes in many countries. Similar to the conclusion of van der Waaij et al. (Reference van der Waaij, Holzhauer, Ellen, Kamphuis and de Jong2005), first-lactation locomotion score and lameness records are suitable indicators for future claw health.
Weekly heritability estimates across the second lactation (not shown) followed closely the trend in genetic variance (Figures 3 and 4). Average heritability across the second lactation was 0.29±0.06 for locomotion score and 0.18±0.05 for lameness.
As this is a one-herd study in a controlled environment, residual variances are expected to be low allowing the genetic variance estimates to account a greater proportion of the total phenotypic variance. Therefore, locomotion score and lameness heritability estimates derived in the present study are higher compared with literature estimates based on field studies with many herds and more diverse environments (0.05 to 0.14), (Van Dorp et al., Reference Van Dorp, Boettcher and Schaeffer2004; van der Linde et al., Reference van der Linde, de Jong, Koenen and Eding2010). Another novelty of this study is the longitudinal analysis of repeated locomotion score and lameness records per cow throughout lactation using random regression models. No previous estimates of such analysis for these traits were found in the literature.
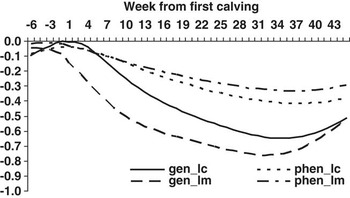
Genetic and phenotypic correlation estimates between locomotion score and lameness on the one hand, and body condition score on the other are shown in Figure 5. These are weekly estimates derived from bivariate analyses based on model 1 and pertain to the period before first calving and throughout first lactation. Genetic correlations were statistically significant (P<0.05) beyond week 12 and 8 of lactation for locomotion score and lameness, respectively, while phenotypic correlations were statistically significant beyond week 4 for both traits. Negative genetic correlations of locomotion score and lameness with body condition score (shown in Figure 5), suggest that high body condition scores are associated with healthy cow movement and reduced lameness on any week of lactation. At the genetic level, this indicates that cows pre-disposed to maintain good levels of body condition score are also less susceptible to locomotion and lameness problems. This is consistent with the results of Boettcher et al. (Reference Boettcher, Dekkers, Warnick and Wells1998) and Van Dorp et al. (Reference Van Dorp, Boettcher and Schaeffer2004) in studies conducted with Holstein cows in United States and Canada. Statistically significant (P<0.05) negative genetic correlations were also found between body condition score on 1 week of lactation and locomotion score and lameness on the following week. These phenotypic and genetic correlation estimates varied from −0.32 to −0.64 for locomotion score and −0.46 to −0.75 for lameness.
Genetic and phenotypic correlations between locomotion score and body condition score (gen_lc, phen_lc) and between lameness and body condition score (gen_lm, phen_lm) by week from first calving (237 cows); statistically significant (P<0.05) estimates for weeks 12 or greater (genetic-locomotion), 8 or greater (genetic-lameness) and 4 or greater (phenotypic-both traits); standard errors ranged from 0.05 to 0.22.

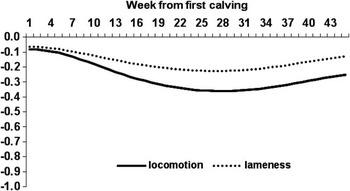
Phenotypic correlations of milk yield with locomotion score and lameness are shown in Figure 6. These results pertain to phenotypic correlation estimates on the same week in lactation and are all statistically significant (P<0.05). Genetic correlations between these traits (not shown) were not statistically different from zero (P>0.05). A positive genetic correlation between milk yield and lameness is reported in the literature (Van Dorp et al., Reference Van Dorp, Dekkers, Martin and Noordhuizen1998; Koenig et al., Reference Koenig, Sharifi, Wentrot, Landmann, Eise and Simianer2005; Buch et al., Reference Buch, Sorensen, Lassen, Berg, Eriksson, Jakobsen and Sorensen2011). Our results suggest that phenotypic correlations in Figure 6 mainly illustrate an unfavourable environmental correlation; lame cows have lower feed intake and consequently, lower milk yield. This observation alludes to proper management practices favouring all traits in question.
Phenotypic correlations of milk yield with locomotion score and lameness by week of first-lactation (237 cows); all estimates were statistically significant (P<0.05); standard errors ranged from 0.03 to 0.07.

Genetic and phenotypic correlations of body condition score and milk yield with locomotion score and lameness in the second lactation were not statistically different from zero (P>0.05). The same was true for correlations of BW with locomotion score and lameness in both lactations. Genetic and phenotypic correlations of locomotion score and lameness with reproductive traits were not statistically different from zero (P>0.05). The only exception was an average phenotypic correlation between lameness and conception rate in the first 305 days of lactation of −0.19±0.07, indicating that lame cows are associated with lower success at conceiving. Zink et al. (2011) also found a negative genetic correlation (−0.34) between locomotion scores and days from calving to conception, both for first and second parity cows. This result was consistent with Pryce et al. (Reference Pryce, Coffey and Brotherstone2000) who found that excellent locomotion was correlated with shorter calving intervals. Bicalho et al. (Reference Bicalho, Vokey, Erb and Guard2007b) also concluded that lame cows have poor reproductive performance and increased odds to be culled.
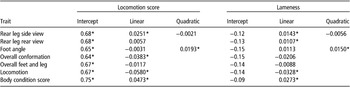
Significant heritable variation found for locomotion score and lameness in the present study combined with the genetic and phenotypic correlation results discussed above warrant genetic selection for the improvement of the two traits that is not expected to adversely affect other important animal functions. Prediction equations of first-lactation daughter locomotion score and lameness from the sires’ estimated breeding values for conformation are shown in Table 3. Since the cows considered in the present study had not been included in the estimation of their sires’ breeding value, the regressions derived represent an authentic association of the two variables based on independent datasets. Of interest are the quadratic relationships with traits exhibiting intermediate optima, namely scores from 4 to 6 on the 1 to 9 linear scale system (Holstein Association USA, 2012). Optimum (intermediate) foot angle conformation is indeed related to improved locomotion and less lameness; steeper angles are preferable than lower ones. On the other hand, the quadratic relationships of rear leg side view, which is also an intermediate optimum trait, were not statistically significant from zero (P>0.05); instead, the linear ones were, suggesting that straight rear legs are associated with improved locomotion and less lameness. Van Dorp et al. (Reference Van Dorp, Dekkers, Martin and Noordhuizen1998 and Reference Van Dorp, Boettcher and Schaeffer2004) reached the same conclusion. Furthermore, it has been suggested that such conformation is also associated with a longer productive life (Holstein Association USA, 2012). Lame cows have increased odds of being culled (Bicalho et al., Reference Bicalho, Vokey, Erb and Guard2007b). Favourable rear leg, rear view conformation was significantly associated (P<0.05) with lower incidence rates of lameness in this study; this was also the case (P<0.05) with overall conformation regarding locomotion score. Feet and leg scores showed a favourable but statistically not significant (P>0.05) linear relationship with locomotion score and lameness in this study. Selection for improved conformation of feet and legs is considered to result in cows less vulnerable to lameness (Koenig et al., Reference Koenig, Sharifi, Wentrot, Landmann, Eise and Simianer2005; Onyiro et al., Reference Onyiro, Andrews and Brotherstone2008; van der Linde et al., Reference van der Linde, de Jong, Koenen and Eding2010). Many authors also concluded that inclusion of specific claw health traits in a ‘lameness index’ would result in faster genetic progress (Koenig et al., Reference Koenig, Sharifi, Wentrot, Landmann, Eise and Simianer2005; van der Linde et al., Reference van der Linde, de Jong, Koenen and Eding2010; Buch et al., Reference Buch, Sorensen, Lassen, Berg, Eriksson, Jakobsen and Sorensen2011). Swalve et al. (Reference Swalve, Alkhoder and Pijl2008), working with sires’ estimated breeding values, concluded that feet and legs conformation traits would not be of great aid in reducing lameness. In the US system, the feet and legs composite index (FLC=0.5×(0.48 foot angle+0.37 rear legs rear view−0.15 rear legs side view)+0.5 (feet and legs score)) may underestimate the effect of rear leg side view scores and this could weaken its role as a lameness predictor. The favourable relationship of locomotion as a conformation trait with lameness was expected; that was the original intention of this trait. Finally, based on our results, the association of higher body condition scores with less lameness was evident once again, consistently with earlier studies (Boettcher et al., Reference Boettcher, Dekkers, Warnick and Wells1998; Van Dorp et al., Reference Van Dorp, Boettcher and Schaeffer2004). If a ‘lameness index’ is to be constructed, it seems that it should include properly weighted feet and leg conformation traits, body condition scores and claw health traits (when available). Until then, farmers and their consultants have to base selection and mating decisions on single or provisionally combined individual traits of known favourable effects.
Regression coefficients of 237 first-lactation cow locomotion score and lameness on their sires’ (155 bulls) estimated breeding values for conformation traits

* Statistically different from zero (P<0.05).
As mentioned earlier, the present study was based on data from a single herd of closely monitored animals. This allowed the opportunity to collect repeated observations on the same cow in a controlled environment for a detailed study of their locomotion score and lameness profile across lactation. The trade-off was that only a limited number of animals were included in the study.
Clearly the utility of this study is different from large-scale field studies based on multiple herds and thousands of animals with single or very limited number of lameness records. Results from both types of studies are needed to derive a thorough understanding of the dynamics of these conditions and properly utilise it in genetic selection and improvement schemes. The fact that the heritability of lameness appears to be much higher around first calving that is, when most management issues related with lactation stress have not been raised, yet, could prove a useful tool, in this respect.
Acknowledgements
The VIVARTIA dairy farm for offering access to their resources and the Interbull Centre for providing sire estimated breeding values for this research study; the first author acknowledges financial support from the Greek State Scholarships Foundation.