INTRODUCTION
Viable trematode transmission from one host to another is an important process in maintaining sustainable parasite populations within ecosystems. The miracidium is the first free-living phase in a trematode's life cycle and is a key component in the transmission from vertebrate to molluscan host. However, compared to the second free-living stage, the cercariae, their biology is relatively poorly understood. This is not surprising considering the practical difficulties in acquiring sufficient material to experiment with. Most work with miracidia is confined to those species of medical and veterinary importance regularly maintained in laboratories, where access to a constant supply of parasites is not a problem.
Nevertheless, many species of trematodes are known to have actively infecting miracidia that rapidly swim through water seeking out a suitable molluscan intermediate host. Temperature is one of the main environmental factors regulating the miracidial life span (Ginetsiskaya, Reference Ginetsinskaya1988) and may have significant effects on transmission viability. It directly influences activity with elevated levels of movement occurring at higher temperatures (Wilson and Denison, Reference Wilson and Denison1970; Mason and Fripp, Reference Mason and Fripp1976). As miracidial energy generation is dependent on the endogenous glycogen store acquired in the vertebrate host (Tielens et al. Reference Tielens, Van de Pas, Van den Heuvel and Van den Bergh1991; Boyunaga et al. Reference Boyunaga, Schmitz, Brouwers, Van Hellemond and Tielens2001), at higher temperatures glycogen utilization increases, due to more intense parasite movement, and thereby results in elevated mortality. Understanding the thermal biology of trematodes is an important step in discerning the future dynamics of parasite populations under climate change. Climate can change the extent and intensity of parasitism through affects on both hosts and parasites with temperature being an especially influential factor (Mas-Coma et al. Reference Mas-Coma, Valero and Bargues2009). Trematodes in particular appear to have a complex and variable relationship with temperature (Vernberg and Vernberg, Reference Vernberg and Vernberg1965; Koprivnikar and Poulin, Reference Koprivnikar and Poulin2009; Morley, Reference Morley2011a), although comparative studies of different species have so far been restricted to cercariae (Poulin, Reference Poulin2006; Morley, Reference Morley2011a).
Young et al. (Reference Young, Bundy and Taylor1984) considered that many studies on the influence of temperature on ectotherm metabolism had utilized either indirect metabolic measures, such as oxygen consumption, ciliary activity inter alia, or studied isolated enzyme systems which have tenuous relevance to the holistic in vivo condition. However, the lifespan of lecithotrophic larvae, such as cercariae and miracidia, is a critical life parameter, and is a direct function of active, in vivo glycogen depletion, therefore providing a simple model of integrated ectotherm metabolism.
Using this approach these authors investigated the effects of temperature on the survival and metabolism of a tropical marine cercariae, Cercaria caribbea LXXI, and demonstrated an empirical relationship between mean expected life span and the half life of the population (t 0·5). In addition, the reciprocal of t 0·5 was found to be a good index of glycogen utilization which could thus be used an in indicator of the effects of temperature on cercarial metabolism using the common measures of temperature effects on reaction rates, Q 10 and Arrhenius activation energy (E* or μ). The Q 10 is the factor by which a reaction velocity is increased for a rise of 10 °C (Prosser, Reference Prosser1973) with higher values often occurring at low experimental temperatures and lower values at high temperatures (Newell, Reference Newell and Wieser1973). The Arrhenius critical incremental energy of activation (E*) is considered the most realistic measure of temperature-driven reaction rates and represents the energy which molecules in their initial state must acquire before they can participate in a chemical reaction. A physiological process depends on a catenary series of reactions, each with its characteristic critical thermal increment. At its simplest level, the rate of the entire process is governed by the slowest reaction in the series, and this is the master reaction. Therefore the E* value for a complex physiological activity is the value of its limiting or pacemaker step and generally ranges from 1–25 Kcal./mole (Hoar, Reference Hoar1983).
Young et al. (Reference Young, Bundy and Taylor1984) showed that Cercaria caribbea LXXI demonstrated thermostability over a temperature range that corresponded with normal environmental temperatures from its sampled habitat. They also recognized that this measure of glycogen utilization and metabolism was applicable to a wider range of non-feeding helminth free-living stages that rely on endogenous non-renewable glycogen stores. However, despite the importance of this work in understanding the influence of temperature on metabolism it remained largely overlooked until the comparative study of Morley (Reference Morley2011a) on cercarial survival/metabolism. This study used the protocols of Young et al. (Reference Young, Bundy and Taylor1984) as a template to analyse survival data from the scientific literature and established that cercarial species have a variable response to temperature that was not influenced by their life history attributes or size. Over most temperature ranges there were only limited differences in the common measures of temperature-mediated reaction rates (Q 10 and E*), although strain-specific differences were apparent for 2 species, and in almost half of the studies analysed cercariae demonstrated a discrete zone of thermostability over a range that correlated to typical individual mean summer temperatures.
Nevertheless, it remains to be determined whether the thermal response of cercariae is applicable to other stages in the trematode's life history, particularly the miracidia. Studies on aquatic invertebrates have demonstrated differing metabolic responses to changing temperatures between individual life stages of the same species (Costlow et al. Reference Costlow, Bookhout and Monroe1960; Vernberg and Vernberg, Reference Vernberg and Vernberg1964; Mangum et al. Reference Mangum, Oakes and Shick1972), whilst miracidia may originate from either endothermic or ecotothermic vertebrate hosts, a potentially influential factor for their subsequent thermal biology.
Differing thermal responses of trematode life stages may have important implications for evaluating the efficiency of parasite transmission under the impact of temperature changes associated with global climate change. The aim of the present study was to (1) establish the comparative survival/metabolic response of miracidia to changing temperature from compiled experimental data using the methodology of Young et al. (Reference Young, Bundy and Taylor1984); (2) determine the extent of miracidial thermostability across a range of species; and (3) compare the relative responses of miracidia and cercariae to thermal changes whilst placing these results in the context of global climate change. Data will be evaluated using the common measures of temperature-driven reaction rates (Q 10 and E*).
MATERIALS AND METHODS
Experimental data on miracidial survival at different temperatures were obtained from the scientific literature. Numerous studies of this kind exist; however, in order to effectively determine survival trends over increasing temperatures and identify evidence of thermostability only those investigations that utilized at least 5 temperature readings were used. This produced a much smaller number of 13 studies undertaken on 11 species (Table 1). One species, Schistosoma mansoni, had multiple investigations undertaken on it, allowing comparisons for strain variations. Three laboratory strains of this species have been studied. These strains were ‘Puerto Rico’ (Anderson et al. Reference Anderson, Mercer, Wilson and Carter1982) maintained at the University of York, UK, and derived from a culture kept at the National Institute of Medical Research, UK, which originated from material collected in Puerto Rico during the early 1950s; ‘Tanzania 1’ (Wen, Reference Wen1961) maintained at Mekerere College, Uganda, originating from material collected in Tanzania during the late 1950s; and ‘Tanzania 2’ (Purnell, Reference Purnell1966) maintained at the East African Institute for Medical Research, Tanzania, originating from material collected in Tanzania during the mid-1960s.
Characteristics of the miracidial species used in the analysis
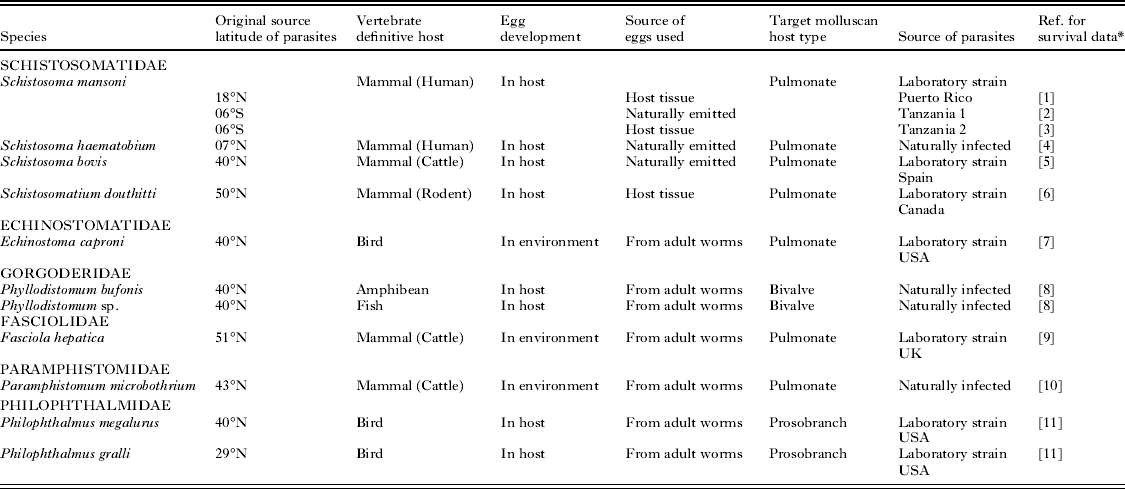
* References: [1] Anderson et al. (Reference Anderson, Mercer, Wilson and Carter1982); [2] Wen (Reference Wen1961); [3] Purnell (Reference Purnell1966); [4] Hira (Reference Hira1968); [5] Ramajo-Martin (Reference Ramajo-Martin1979); [6] Farley (Reference Farley1962); [7] Ford et al. (Reference Ford, Nollen and Romano1998); [8] Ubelaker and Olsen (Reference Ubelaker and Olsen1970); [9] Smith and Grenfell (Reference Smith and Grenfell1984); [10] Samnaliev (Reference Samnaliev1977); [11] Nollen et al. (Reference Nollen, Samizadeh-Yazd and Snyder1979).
Although some variations in experimental protocol existed between the 13 studies they were not considered, in general, to be sufficiently influential to alter the trend of changing survival over a given temperature range. The typical study consisted of isolating recently emerged miracidia from eggs maintained at each temperature. Miracidia, either individually or in small groups, were then placed into containers of dechlorinated tap water and survival was observed every few hours until all had died.
For the purposes of this investigation only data showing the time to 50% survival (t 0·5) was used, following the study of Young et al. (Reference Young, Bundy and Taylor1984) as a template which demonstrated that the reciprocal of the median survival time (1/t 0·5) is a useful, though simplistic, measure of the rate of glycogen utilization and can thus be used as an index of temperature effects on the metabolism of free-living parasites. For comparative purposes the t 0·5 for each species over the studied temperature range was extracted from the original source reference and transformed to give a glycogen utilization rate index as follows-
 $${\rm Log}\,{t_{\it 0.5}} ^{ - 1} $$
To determine if changing temperature substantially altered the rate of survival/metabolism of miracidia, Q 10 values were calculated using the original t 0·5 data for a range of temperatures that approximately encompassed temperature increases of roughly 10 °C as follows: 5–15 °C (≈10 °C), 10–20 °C (≈15 °C), 15–25 °C (≈20 °C), 20–30 °C (≈25 °C), and 25–35 °C (≈30 °C). The Q 10 was calculated using the following form of the van't Hoff equation (Randall et al. Reference Randall, Burggren and French2001):
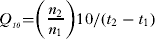 $$Q__{ \it 10}{\rm =} \left( \matrix{\underline {n_2} \hfill \cr n_1 \hfill} \right)10/(t_2 - t_1 )$$
where n 1 and n 2 are (t 0·5 − 1)1 and (t 0·5 − 1)2 at temperatures t 1 and t 2 respectively. Q 10 values ranging between 2 and 3 are typically the norm and are indicative of a doubling or tripling of physiological rates per 10 °C increase in temperature (Prosser, Reference Prosser1973; Randall et al. Reference Randall, Burggren and French2001). A value between 1 and 2 indicates little change, whereas less than 1 indicates a reduced rate. In general, Q 10 values of approximately 2–3 are usually encountered by ectotherms over the normal environmental temperature range of the organism.
The data were then analysed to determine the critical incremental energy of activation (E* or μ) over the same range of temperatures using the following form of the Arrhenius equation (Prosser, Reference Prosser1973):
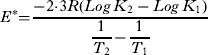 $$E^*{\rm =} \displaystyle{{ - 2{\cdot}3R(Log\,K_2 - Log\,K_1 )} \over {\displaystyle{1 \over {T_2}} - \displaystyle{1 \over {T_1}}}} $$
where K 1 and K 2 are (t 0·5 − 1)1 and (t 0·5 − 1)2 at absolute temperatures T 1 and T 2, and R is the gas constant (1·98 cal/mole). For many enzymatic and biological processes in living organisms E* values usually range from 1 to 25 Kcal./mole. Normal activation energy is approximately 10 Kcal./mole with many respiratory metabolic processes having values typically of 11 or 16 Kcal./mole (Crozier, Reference Crozier1924; Brandts, Reference Brandts and Rose1967; Hoar, Reference Hoar1983). Significant differences between Q 10 or E* values at each temperature range were analysed using Student's t-test.
A zone of thermostability in miracidial survival/metabolism was determined to occur where values of Log t 0·5 − 1 demonstrate a relative plateau over a temperature range that were different from values found at temperatures above and below. This was considered to arise when values changed by less than 0·10 over a 5 °C range.
In order to determine whether miracidial survival/metabolism responds differently to temperature changes compared to the cercarial stage, data on cercariae were utilized from Morley (Reference Morley2011a), except for S. haematobium cercariae which was calculated from raw data reported by Hira (Reference Hira1968) using methodologies of Morley (Reference Morley2011a). Differences between Q 10 values of cercariae and miracidia were analysed at each temperature range using Student's t-test. In addition, direct comparisons using Q 10 and E* of survival/metabolism from the same species strains of miracidia and cercariae were possible for 4 examples namely S. mansoni ‘Puerto Rico’ strain (Lawson and Wilson, Reference Lawson and Wilson1980; Anderson et al. Reference Anderson, Mercer, Wilson and Carter1982), S. mansoni ‘Tanzania 2’ strain (Purnell, Reference Purnell1966), S. haematobium (Hira, Reference Hira1968), and S. bovis (Ramajo-Martin, Reference Ramajo-Martin1979; Ramajo-Martin and Simon-Martin, Reference Ramajo Martin and Simon Martin1984). Metabolic responses were considered to be comparable between the two life stages when values of E* showed a difference of less than 2 Kcal./mole over each temperature range.
RESULTS
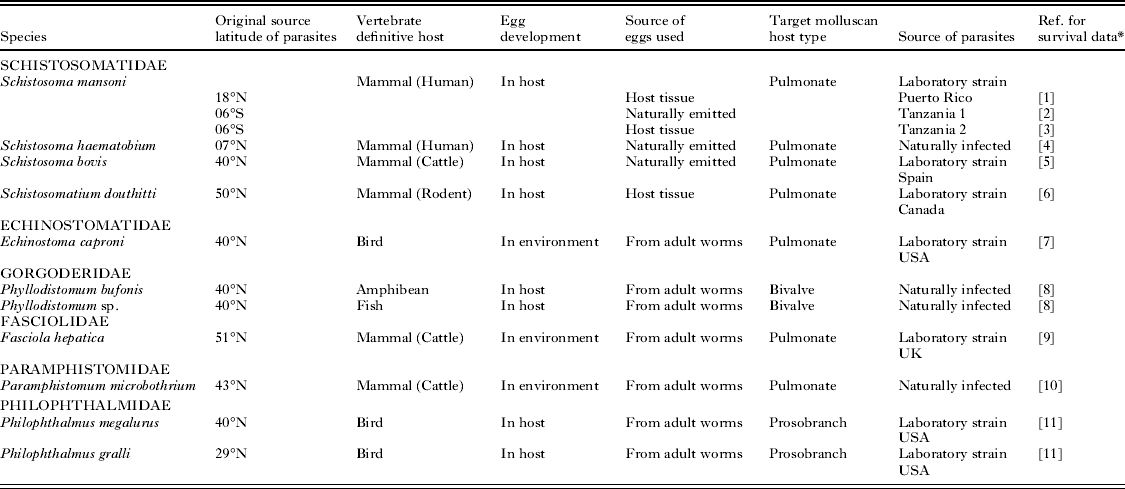
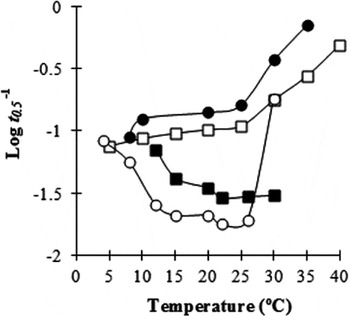
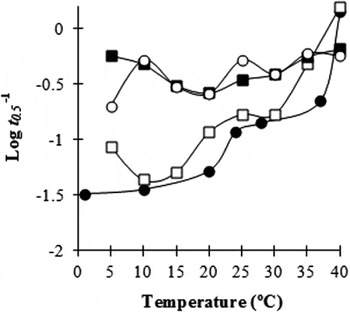
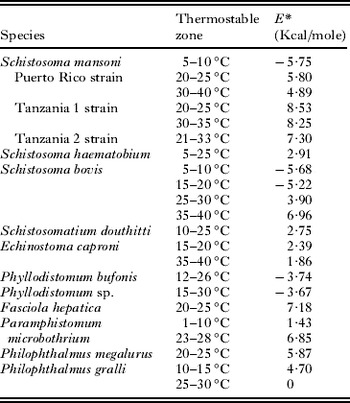
The survival/metabolism of miracidia was altered by changes in temperature. Fluctuations in the thermal regime had a variable effect on the miracidial survival/metabolism of individual species with all species demonstrating a thermostable stable zone over at least a 5 °C range (Figs 1–4, Table 2). Nevertheless, some general trends were apparent. Phyllodistomum bufonis, Phyllodistomum sp., Schistosoma haematobium, and Schistosomatium douthitti have a wide thermostable zone extending over an approximate 15 or 20 °C range before the glycogen utilization rate increased rapidly as the temperature continued to rise (Fig. 1). In contrast, a number of species demonstrated multiple thermostable zones of 5 °C ranges, often separated by sharp changes in glycogen utilization rate (Figs 2, 4). These included Paramphistomum microbothrium, Philophthalmus gralli, Echinostoma caproni, Schistosoma bovis, and Schistosoma mansoni (all strains). A third group, comprising Fasciola hepatica and Philophthalmus megalurus, had just a single 5 °C thermostable zone (Fig. 3).
Miracidial species demonstrating a wide stability zone in the relationship of the glycogen utilization rate (Log t 0·5 − 1) over temperature (○-Phyllodistomum bufonis, ●-Schistosomatium douthitti, ■-Phyllodistomum sp., □-Schistosoma haematobium).

Miracidial species demonstrating multiple 5 °C thermostable zones in the relationship of the glycogen utilization rate (Log t 0·5 − 1) over temperature (●-Paramphistomum microbothrium, □-Philophthalmus gralli, ○-Echinostoma caproni, ■-Schistosoma bovis).

Miracidial species demonstrating a single 5 °C thermostable zone in the relationship of the glycogen utilization rate (Log t 0·5 − 1) over temperature (●-Fasciola hepatica, ○-Philophthalmus megalurus).

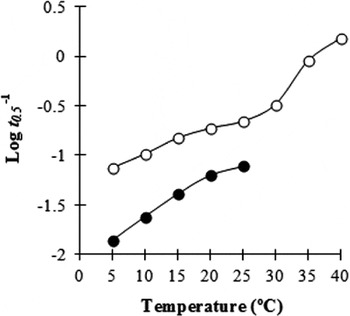
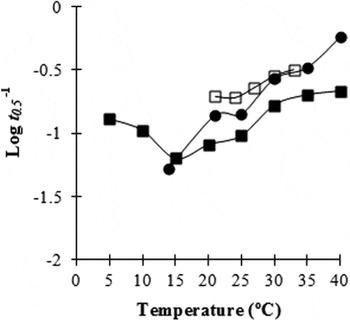
Strains of Schistosoma mansoni miracidia demonstrating related changes in the glycogen utilization rate (Log t 0·5 − 1) over temperature (■-‘Puerto Rico’ strain, ●-‘Tanzania 1’ strain, □-‘Tanzania 2’ strain).

Values of E* of miracidial species demonstrating thermostability over the relevant stable temperature range

There appears to be no obvious correlation between the attributes of each species (Table 1) and their thermobiology. Although the majority of species originate from endothermic vertebrates, the examples from ectotherms, Phyllodistomum spp., suggest that thermodynamics between the two groups are compatible, at least for those individuals demonstrating a wide thermostable zone. Nevertheless, both Phyllodistomum species exhibit a continuous slight increase in survival with rising temperature up to approximately 26 °C, which is not replicated by those species originating from endothermic hosts (Fig. 1).
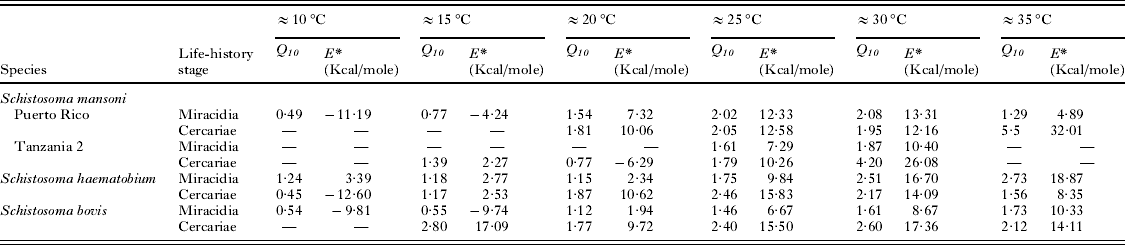
Analysis of the miracidial glycogen utilization rate of the 3 laboratory strains of S. mansoni showed many similarities. Over the temperature range of 20 to 35 °C (Fig. 4) there is a large degree of conformity in the thermal response, particularly between ‘Puerto Rico’ and ‘Tanzania 1’ strains. All these strains demonstrate thermostability at least between approximately 20 and 25 °C and between 30 and 35 °C for ‘Puerto Rico’ and ‘Tanzania 1’ strains, whilst ‘Tanzania 2’ strain shows complete stability over the entire experimental range of 21 to 33 °C. Comparable Q 10 and E* values occur for ‘Puerto Rico’ and ‘Tanzania 1’ strains over the core ranges of ≈25 °C and ≈30 °C, although ‘Tanzania 2’ strain demonstrates a greater stability over these ranges (Tables 2 and 3). Nevertheless, at more extreme temperature ranges (≈20 °C and ≈35 °C) more substantial differences in thermal responses are apparent (Table 3).
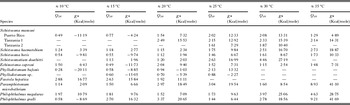
Values of Q 10 and E* over the six temperature ranges for each miracidial species

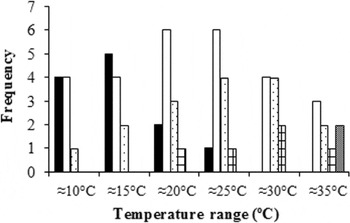
Values of Q 10 and E* over 10 °C ranges for each miracidial species are shown in Table 3 and demonstrate only a very gradual increase as temperatures rise. Significant differences in the Q 10 values were only found between ≈30 °C range and all ranges between ≈10 °C and ≈25 °C (two tailed t-test t ⩽ − 2·311, P ⩽ 0·037), between ≈10 °C and both ≈25 °C and ≈30 °C (two tailed t-test t ⩽ − 2·209, P ⩽0·040), and between ≈15 °C and ≈30 °C (two tailed t-test t = − 2·859, P=0·010). The frequency of Q 10 values is shown in Fig. 5 and demonstrates that the majority of species up to a temperature range of ≈25 °C have values of 0–1 or 1–2, indicative of relative stable or reduced physiological rates. Nevertheless, at higher temperature ranges there is an increased occurrence of species with Q 10 values of 2–3, representing typical normal rate increases over 10 °C ranges, only at ≈30 °C and ≈35 °C ranges do higher Q 10 values become increasingly more frequent.
Frequency distribution of miracidial Q 10 values at each studied 10 °C temperature range (■-Q 10 values 0–1, □-Q 10 values 1–2,  -Q 10 values 2–3,
 -Q 10 values 3–5,
 -Q 10 values 5+).

Values of E* generally mirror changes in Q 10 over the different temperature ranges (Table 3). Significant differences in E* values occurred between ≈35 °C and all ranges up to ≈25 °C (two tailed t-test t ⩽ − 2·353, P ⩽0·030), between ≈30 °C and ranges up to ≈20 °C (two tailed t-test t ⩽ − 2·141, P ⩽0·045), and between ≈25 °C and ≈15 °C or ≈10 °C (two tailed t-test t ⩽ − 2·672, P⩽ 0·014).
Across the thermostable zone of each species low E* values of less than 9 Kcal./mole were recorded. Individual strains of S. mansoni differed little in their activation energy across comparable core thermostable zones (Table 2).
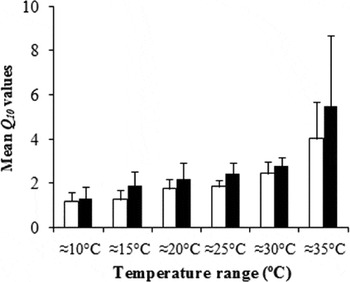
Comparisons of miracidial and cercarial responses to thermal changes showed that miracidia have an increased frequency of Q 10 values of either 0–1 or 1–2 over the temperature ranges of ≈10 °C to ≈20 °C and also a greater proportion of 1–2 and 2–3 Q 10 values at ≈25 °C and ≈30 °C (Fig. 5) compared to cercariae (see Morley, Reference Morley2011a). In addition, analysis of mean Q 10 values over each temperature range showed that miracidia demonstrate a trend of greater stability than cercariae which show markedly elevated Q 10 values at the higher temperature ranges of ≈30 °C and ≈35 °C (Fig. 6). However, due to the wide variability in Q 10 demonstrated by both miracidia and cercariae and the restricted amount of data available for analysis the differences in mean metabolic rates between the two life-history stages was not significantly different at any temperature range (two tailed t-test t ⩾ − 1·624, P ⩾0·117).
Mean Q 10 values of miracidia (□) and cercariae (■) over each studied 10 °C temperature range.

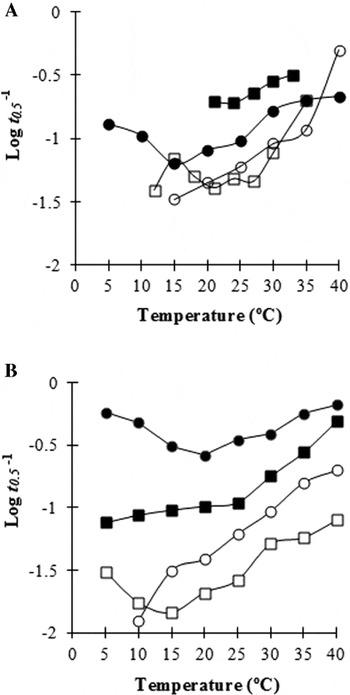
Nevertheless, the more detailed analysis possible for miracidial and cercarial survival/metabolism with the 4 species strains show more obvious differences. In general, each life-history stage of S. mansoni (‘Puerto Rico’ and ‘Tanzania 2’ strain), S. haematobium, and S. bovis show different thermal biology compared to their same species strain counterpart (Fig. 7, Tables 4 and 5). However, there are a number of occurrences where comparable Q 10 and E* values are found at certain temperature ranges for the tropical species S. mansoni (‘Puerto Rico’ strain) and S. haematobium. For S. mansoni (‘Puerto Rico’ strain) comparable metabolism for miracidia and cercariae occurs at ≈25 °C and ≈30 °C but diverts markedly at the higher range of ≈35 °C. In contrast, S. haematobium has comparable metabolic responses at ≈15 °C but are substantially different at most other temperature ranges. However, a more detailed examination of the thermal responses of this species shows that the 2 life-stages do not demonstrate parallel thermodynamics over this temperature range (Fig. 7B) and the comparable Q 10 and E* values obtained at ≈15 °C must be treated with caution. In contrast, S. bovis, a subtropical species derived from Spain, showed no metabolic correlations between miracidia and cercariae at any temperature range (Table 4, Fig. 7B).
Relationship of the glycogen utilization rate (Log t 0·5−1) over temperature of the same species strains of miracidia and cercariae. (A) Schistosoma mansoni (‘Puerto Rico’ strain) cercariae (○) and miracidia (●), S. mansoni (‘Tanzania 2’ strain) cercariae (□) and miracidia (■); (B) S. bovis cercariae (○) and miracidia (●), S. haematobium cercariae (□) and miracidia (■).

Comparative values of miracidial and cercarial Q 10 and E* values from the same species strains over the six temperature ranges
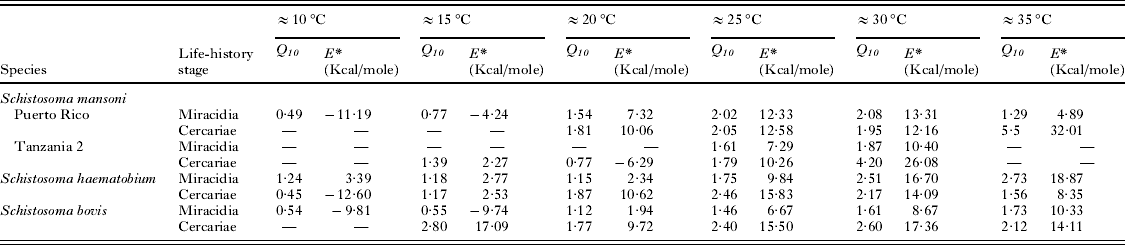
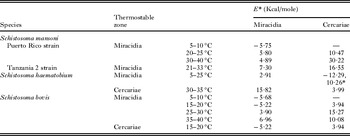
Values of E* of miracidia and cercariae from the same species strains demonstrating thermostability over the relevant stable temperature range

* Cercarial survival increases between 5 and 15 °C and decreases between 15 and 25 °C.
Examination of thermostable zones between the two life-history stages of each species strain shows substantial differences in E* values (Table 5). Zones of thermostability generally do not correspond at the same temperature ranges for miracidia and cercariae, or are simply absent altogether for the two cercarial strains of S. mansoni (Table 5). Cercariae have substantially higher activation energy at all the temperature ranges where miracidia demonstrate stability (Table 5).
DISCUSSION
Temperature has complex effects on miracidia. The majority of the species used in the present analysis are derived from laboratory cultures. This is to be expected given the practical difficulties in acquiring sufficient experimental material from natural sources. However, some caution needs to be taken when assessing laboratory-maintained species because of their tendency to become rapidly inbred, resulting in alterations in their functional biology compared to their naturally-infected counterparts (Morley, Reference Morley2011b). Nevertheless, widespread interspecific and intraspecific differences in the thermodynamics of free-living or mollusc-associated trematodes from natural sources are apparent (Vernberg and Vernberg, Reference Vernberg and Vernberg1965; Koprivnikar and Poulin, Reference Koprivnikar and Poulin2009; Morley, Reference Morley2011a) suggesting that any specific emphasis on this aspect of laboratory-cultured strains in the present analysis may be unnecessary.
The majority of miracidial Q 10 and E* values over the lower temperature ranges show either stable or reduced metabolic rates with 10 °C increases. Only at temperature ranges of ≈25 °C or above are more typical doubling/tripling of physiological rates or even higher values common. These results suggest that, in general, miracidial survival/metabolism is not generally affected by temperature and is well adapted to the normal thermal ranges encountered by each species. Nevertheless, all of the species examined in the present study are from freshwater habitats and the majority derive from endothermic vertebrate hosts creating an unavoidable bias to the analysis. However, less detailed studies on marine miracidia (Vanoverschelde, Reference Vanoverschelde1982) suggest comparable results, whilst studies on cercarial thermodynamics could find no distinctive differences in the responses of species between either marine or freshwater habitats and endothermic or ectothermic definitive hosts (Morley, Reference Morley2011a) suggesting the bias in the miracidial analysis is unlikely to be significant.
The 3 laboratory strains of S. mansoni miracidia showed only limited differences in their thermal responses with comparable Q 10 and E* values over core temperature ranges, and is in contrast to S. mansoni cercarial strains where distinct differences in survival/metabolism occurred (Morley, Reference Morley2011a). This suggests that cercarial thermal biology may be more closely tied to the temperatures encountered during development in the molluscan host than found for miracidia, whose functional biology may be influenced by temperatures encountered whilst developing within the egg or during the eggs own formation in the vertebrate definitive host.
Certainly a potentially important practical factor for evaluating temperature effects in miracidia is the source of eggs used for experimental studies. Eggs can be obtained from host tissues, sexually mature worms, or from naturally emitted routes and their origins can determine both the duration of egg embryonation and miracidial survival and viability (Weina, Reference Weina1986; Zanotti-Magalhaes et al. Reference Zanotti-Magalhaes, de Paiva, Magalhaes and de Carvalho1988; McKindsey and McLaughlin, Reference McKindsey and McLaughlin1994). The available evidence on temperature and miracidial survival suggests that overall there are significant differences between individuals hatched from eggs removed from adult flukes and eggs passed naturally in the host faeces. However, the relationship between temperature and survival remains the same for both groups (McKindsey and McLaughlin, Reference McKindsey and McLaughlin1994) indicating that the thermodynamics of miracidial survival/metabolism is not substantially altered by different sources of experimental egg material. Certainly, the slight variations in survival duration obtained with the S. mansoni strains in the present study, manifested as different but generally parallel Log t 0·5 − 1 values, may be associated with eggs obtained from different sources (Table 1), with all 3 still maintaining their similar temperature relationships over core ranges.
All miracidia in the present analysis demonstrated some degree of thermostability which is in contrast to cercariae, where only 7 out of 16 studies showed a thermostable zone (Morley, Reference Morley2011a). Miracidial thermostability appears to occur in 3 forms: a continuous wide zone over a temperature range of 15 or 20 °C, multiple 5 °C thermostable zones, or a single 5 °C zone similar to that found with cercariae.
Metabolic plateaus over temperature ranges occur in a wide range of ectothermic animals (Wieser, Reference Wieser and Wieser1973) and are considered to be adaptive mechanisms for saving energy, most strikingly observed in those animals that have to economize with their energy reserves such as inter-tidal organisms. Wieser (Reference Wieser and Wieser1973) considered that various patterns of ‘reaction rates: temperature’ curves are associated with the ecology and biology of the animals concerned, although accurate interpretations may require a more detailed knowledge of an organism's environment relationships than is usually available.
Within the present study each thermostable zone is characterized by low activation energy of less than 9 Kcal./mole. The presence of thermostable zones suggests that an adaptive mechanism exists, allowing maintenance of a certain degree of metabolic homeostasis over key temperature ranges. Young et al. (Reference Young, Bundy and Taylor1984) speculated that there were 2 potential ways such mechanisms could operate. The first is a diminished enzyme-substrate affinity with increasing temperature, which could result from thermal molecular reorganization, effectively counteracting the thermal increase in the number of molecules exceeding the critical activation energy (E*) for the rate-limiting metabolic reaction. Alternatively it could result from the interactions of 2 separate enzymatic systems, one increasing as the other decreases in activity with rising temperature.
Nevertheless, with cercariae such thermostability could be correlated with normal summer temperature ranges occurring in individual aquatic habitats (Morley, Reference Morley2011a), presumably encountered during development in the molluscan host. For miracidia such correlations are less apparent, although many species still encompass typical summer temperatures. Both the ‘wide thermostable’ and ‘multiple thermostable’ zones would suggest that these species have adapted their energy consumption for anticipated rather than prevailing conditions in the natural habitat and indeed may indicate a ‘default’ metabolism only loosely associated with current environmental conditions. Certainly thermostability at very low temperatures is of dubious advantage if the target molluscan host is unavailable due to its own cold-temperature torpor.
Perhaps the most striking example of the disparate influence of temperature on miracidial and cercarial thermostability is shown by S. haematobium from natural infections occurring in Ibadan, Nigeria. Here, miracidia show wide stability between 5 and 25 °C, whilst cercariae are stable only over the range of 30 to 35 °C. As the temperature of most water bodies in this area typically ranges from 25 to 32 °C (Egborge and Sagay, Reference Egborge and Sagay1979) it can be seen that compared to cercariae miracidia are, at least metabolically, less-well adapted to these thermal conditions. As this species is considered to have been present in this region for millions of years (Morgan et al. Reference Morgan, Dejong, Snyder, Mkoji and Loker2001) it would be expected that both free-living stages would have evolved to optimally metabolize at the prevailing temperature. This potentially suggests that, in general, any thermal adaptation of trematodes, when it can be demonstrated, may not be an inherited characteristic, but instead most likely arises during development in the molluscan host and is specific for that individual water body. For those species that show little evidence of adaptation to a specific temperature range it further suggests that their resident habitat is potentially subjected to a highly variable temperature regime.
It is clear that there are many differences in the metabolic responses of cercariae and miracidia to temperature. Organisms with smaller body sizes are considered to possess lower Q 10 values (Rao and Bullock, Reference Rao and Bullock1954). However, metabolic studies on the thermal responses of cercariae could find no significant correlation with individual species body size and temperature (Morley, Reference Morley2011a) suggesting that this was not an important parameter for comparative purposes within this life-history stage. Nevertheless, miracidia are, in general, significantly smaller than the typical cercariae and therefore would be expected to possess a different metabolic rate. The present study has demonstrated that miracidia show a greater degree of thermostability and lower Q 10 values than cercariae, which becomes increasingly apparent at higher temperatures. This is most obvious when comparing cercarial and miracidial responses of the same species strains to temperature, although this turns out to be less distinct with tropical species such as S. mansoni, a finding concordant with size-temperature relationship studies in other ectothermic organisms (Rao and Bullock, Reference Rao and Bullock1954). Altered degrees of thermal resistance exhibited by different life-history stages have been demonstrated for numerous invertebrates (Vernberg and Vernberg, Reference Vernberg and Vernberg1964; Mangum et al. Reference Mangum, Oakes and Shick1972) and elevated levels of thermal tolerance may be a mechanism to allow larvae to survive temporary exposure to extreme temperatures during their distribution phase (Vernberg and Vernberg, Reference Vernberg and Vernberg1970). This physiological capability of miracidia would allow optimal larval survival in a greater range of thermal environments within a habitat over a range of seasonal conditions, increasing the chances of transmission to the target molluscan host. This capacity may be associated with their vertebrate definitive host's ability to move through habitats with more wide-ranging thermal regimes than found for relatively stationary molluscan hosts that release cercariae.
Nevertheless, although miracidial survival/metabolism shows an enhanced level of thermal resistance under experimental conditions an additional poorly understood factor is the temperature regime that the vertebrate definitive host is exposed to which may influence miracidial viability. Increases in temperature can both positively and negatively affect the growth, development and fecundity of adult trematodes in both ecothermic and endothermic hosts through direct and indirect means (Lightner, Reference Lightner1975; Chubb, Reference Chubb1979; Andrews and Chubb, Reference Andrews and Chubb1980; Ichii et al. Reference Ichii, Irie and Yasuraoka1990). A decline in the conditions that the adult trematode is exposed to can affect the quality of the miracidia produced (Chernin, Reference Chernin1974; Newport and Weller, Reference Newport and Weller1982). It could therefore be beneficial for the understanding of trematode population dynamics under climate change if this aspect of their thermal response was better understood.
The most important question raised by this study is how the interspecific variation in miracidial survival/metabolism thermodynamics may influence parasite transmission under a changing climate. The process of host-finding and infection by miracidia is affected by a range of biotic and abiotic factors of which temperature is one of the most important (Christensen, Reference Christensen1980). For certain cercarial species it has been established that temperature has a similar effect on both t 0·5 and loss of infective capacity, indicating that the time to 50% parasite mortality could potentially act as a proxy indicator of infection potential (Pechenik and Fried, Reference Pechenik and Fried1995). No such correlation has been formally established for miracidia; however, the similarity in energy metabolism between the two life-history stages suggests that miracidial t 0·5 may also potentially be indicative of infective capacity. Nevertheless, temperature has been found to have a variable effect on miracidial infectivity, demonstrating a capacity for both a wide temperature optima (Chu et al. Reference Chu, Massoud and Sabbaghian1966) and both increasing and decreasing transmission success as temperatures rise over core thermal ranges (DeWitt, Reference DeWitt1955; Christensen and Nansen, Reference Christensen and Nansen1976; Anderson et al. Reference Anderson, Mercer, Wilson and Carter1982; Waadu and Chappell, Reference Waadu and Chappell1991), probably due to both energy consumption and other factors. However, miracidial thermal stability, in terms of survival and metabolism, may influence transmission to a large extent, particularly in relation to activity. It therefore seems unlikely that parasite viability will be substantially affected by temperature rises of 2–4 °C that are predicted to occur under the pressure of climate change.
The present study suggests that the impact of temperature, and hence climate change, on miracidial survival and metabolism is limited. Miracidia demonstrate substantial thermal resistance and are in general less influenced by temperature than cercariae, themselves only modestly affected metabolically by thermal changes. Nevertheless, distinct differences in the metabolism of various laboratory and geographical strains of cercarial species were less apparent with laboratory strains of S. mansoni miracidia, which demonstrated a degree of conformity over core temperature ranges. Consequently, taking into consideration the effects on both cercarial survival and emergence (Poulin, Reference Poulin2006; Morley, Reference Morley2011a) it is this stage, rather than the miracidia, that appears to be the weaker link in the life cycle under climate change and would therefore benefit from a closer scrutiny of its thermal biology in future studies. Nevertheless, it presently remains undetermined whether individual target molluscan host species for miracidia retain a similar degree of resistance to fluctuating temperatures as the parasite, and this aspect may be the limiting factor in determining miracidial transmission viability under a changing climate. Both the differential effect of temperature on cercariae and miracidia and the relative miracidial thermostability found in the present study are therefore important factors that need to be incorporated into future assessments of global climate change effects on the dynamics of trematode infections.