Implications
Multiple regression equations were developed to predict grass dry matter intake (GDMI), milk yield (MY) and milk fat and protein yield (milk solids yield (MSY)) of spring calving dairy cows during the grazing season. The equations are based on easily obtainable on-farm independent variables and can be used by both farmers and dairy consultants to predict GDMI, MY and MSY during the grazing season. The equations may also promote future research areas by highlighting the main factors which have significant effects on GDMI, MY and MSY of grazing dairy cows.
Introduction
Grazed grass is the cheapest source of feed available to dairy farmers (Finneran et al., Reference Finneran, Crosson, Wallace, O'Kiely, Forristal and Shalloo2010), therefore maximising its intake by dairy cows leads to reduced costs and increased profitability. Dillon et al. (Reference Dillon, Roche, Shalloo and Horan2005) showed that, across a number of countries, a 10% increase in the proportion of grazed grass in the dairy cow diet reduced the average cost of milk production by 13% (cost of production €0.20). Despite this, it is difficult to predict grass dry matter intake (GDMI) for a dairy herd. Feeding the grazing dairy cow is a difficult task due to the lack of information available to the farmer to accurately estimate the intake of the animal during grazing (Delagarde and O'Donovan, Reference Delagarde and O'Donovan2005). In order to maximise the performance and profitability of the dairy herd, the GDMI of the herd needs to be estimated. Elucidating the factors that affect GDMI, milk yield (MY) and milk fat and protein yield (milk solids yield (MSY)) will lead to improved grazing management, supplementation, animal performance and farm profitability. Currently, grazing management decisions are based on guesstimating the quantity of feed required by the animal rather than having an accurate predicted value for the quantity of feed that will be consumed by the animal (Delagarde and O'Donovan, Reference Delagarde and O'Donovan2005).
Prediction equations exist to predict the dry matter intake (DMI) of cows in confined milk production systems. The prediction of the DMI of grazing dairy cows is more complex due to the constraints placed on the cows by grazing conditions (interaction of the animal, plant and management factors) and the fluctuation in daily climatic conditions (Dillon, Reference Dillon2006). Despite this, equations have been developed to predict the GDMI and MY of grazing dairy cows (Maher et al., Reference Maher, Stakelum and Rath2003; Delagarde and O'Donovan, Reference Delagarde and O'Donovan2005). Currently, there are no multiple regression equations available for the prediction of the MSY of grazing dairy cows or equations to predict GDMI, MY and MSY during different periods of the grazing season. These equations can only be developed from a large database with sufficient data across seasons.
This study aims to develop prediction equations for GDMI, MY and MSY in spring (SP), summer (SU) and autumn (AU) of grazing spring calving dairy herds, using a large data set.
Material and methods
Data editing
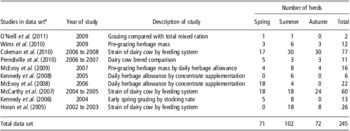
Initially a database was created using data from three experimental dairy research farms of Teagasc. The database contained 8787 per cow GDMI (average value of a 5- or 6-day intake measurement period (IMP)) and MY (average value of a 7-day measurement period during the IMP) measurements from 19 published studies conducted between the years 1988 and 2009 (O'Neill et al., Reference O'Neill, Lewis, O'Donovan, Shalloo, Mulligan, Boland and Delagarde2013). The multiple regression equations were developed at a herd rather than at an individual cow level as animals are typically managed as a herd rather than on an individual basis by farmers. Individual cow data were averaged by grazing herd to create herd data (animals grazing in the same paddock during the IMP). This equated to 522 grazing herds. All cows grazing as a herd in the same paddock received the same management, including the same individual quantity of concentrate, and grazed a perennial ryegrass sward of identical quality and composition. Grazing herds retained for the development of the multiple regression equations were required to have all data available for the independent variables used in the multiple regression analysis. As a result, herds missing BW data (two herds), calving body condition score (BCS) data (81 herds), BCS data (139 herds), pre-grazing sward height (PrGSH) data (six herds), grass CP data (32 herds) and grass in-vitro organic matter digestibility (OMD) data (16 herds) were removed from the data set. One herd with a grass OMD value <640 g/kg (very low quality sward for Irish conditions) was removed from the data set. This resulted in 245 herds remaining in the data set for the development of the multiple regression equations (Table 1). This data set was composed of 10 published studies conducted between the years 2002 and 2009. All cows in the data set calved in spring due to the nature of the calving period in Ireland with 13, 217 and 15 herds having a mean calving date in January, February and March, respectively. As a result, the effect of season was confounded with the stage of lactation. Equations were developed for different periods during the grazing season. The data set was divided by season. Seasons were categorised as SP (5 March to 30 April), SU (1 May to 31 July) and AU (1 August to 31 October). Spring data were available from 5 March, as there was no IMP before this date in the data set. The majority of the cows in the data set were Holstein-Friesian or Friesian cows (234 herds) with 11 herds containing a similar proportion of Holstein-Friesian, Jersey, Jersey crossbred and Norwegian Red × Friesian cows.
Description of the 10 grass-based lactating dairy cow studies included in the data set, which was used to construct multiple regression equations to predict grass dry matter intake, milk yield and milk solids yield at the herd level for spring (5 March to 30 April), summer (1 May to 31 July) and autumn (1 August to 31 October)

aThe full references are given in Supplementary Material S1.
Dependent variables
The three dependent variables investigated in this study were GDMI, MY and MSY. The data set used to develop the multiple regression equations contained data measured using the same methodology. As a result, the independent variables that were significant in the multiple regression equations highlight the variables that were associated with GDMI, MY and MSY during the grazing season.
Using the data set of 245 grazing herds, multiple regression equations were developed to predict each of these dependent variables across the three periods during the grazing season. The data for the dependent variables were collected during the IMP. The average daily GDMI was estimated using the n-alkane technique as modified by Dillon and Stakelum (Reference Dillon and Stakelum1989). Individual MY was recorded automatically at each milking (Dairymaster, Causeway, Co. Kerry, Ireland) and the average daily MY during the IMP was used. Milk fat and milk protein concentrations were determined from a morning and evening milk sample taken on two successive days during the IMP. The concentration of milk constituents was determined using a Milkoscan 203 (Foss Electric DK, Hillerød, Denmark). The MSY during the IMP was calculated by multiplying the concentrations of milk fat and milk protein in the milk by the average daily MY for the IMP.
Independent variables
The independent variables included in the development of the multiple regression equations were divided into three categories: (i) animal, (ii) sward and grazing management and (iii) concentrate supplementation.
The animal category included:
• Peak MY (kg per cow per day) was the average of the individual peak MY achieved by each cow in the herd during lactation.
• Days in milk (DIM) were the average days in milk of the herd.
• BW (kg) was the average BW of the herd recorded during the IMP or the closest BW measurement to the IMP up to a maximum of 3 weeks pre or 3 weeks post the IMP and was measured using an electronic portable weighing scales and the Winweigh software package (Tru-test Limited, Auckland, New Zealand).
• BCS was the average herd BCS on a scale of 0 to 5 (Lowman et al., Reference Lowman, Scott and Somerville1976), during the IMP or closest BCS measurement to the IMP up to a maximum of 3 weeks pre or 3 weeks post the IMP.
• BCS at calving was the herd average BCS closest to calving up to a maximum 3 weeks post-calving on a scale of 0 to 5 (Lowman et al., Reference Lowman, Scott and Somerville1976).
The sward and grazing management category contained the variables pertaining to the sward structure, chemical composition and daily herbage allowance (DHA) offered to the herd during the IMP.
• Pre-grazing herbage mass (PGHM) above 4 cm was calculated by cutting four strips (1.2 m × 10.0 m) with a motor Agria (Etesia UK Ltd, Warwick, UK) before grazing each paddock. Ten grass height measurements were recorded before and after harvesting on each cut strip using a rising plate meter (Jenquip, Fielding, New Zealand). All mown grass from each strip was collected, weighed and sub-sampled (0.3 kg). A sample of 0.1 kg fresh weight was dried for 16 h at 90°C in a drying oven (Carbolite, Derbyshire, UK) for dry matter (DM) determination. The remaining grass sample collected from the four strips was bulked, a sub-sample (0.1 kg) was taken and oven-dried (Carbolite, Derbyshire, UK) for 48 h at 40°C and milled through a 1-mm screen before chemical analysis. On the basis of the above measurements, the PGHM was calculated from the average of the four strips per paddock using the following equation:
 $${{{\rm{Fresh}}\;{\rm{weight}}\;{\rm{of}}\;{\rm{grass}}\;{\rm{from}}\;{\rm{mown}}\;{\rm{strip}}\;{\rm{(kg)}}\atop {\rm{\times }}\,{\rm{10}}\:{\rm{000}}\,{\rm{\times }}\,{\rm{grass}}\;{\rm{dry}}\;{\rm{matter}}\;{\rm{content}}\;{\rm{(proportion)}}}}\over {{{\rm{Area}}\;{\rm{of}}\;{\rm{mown}}\;{\rm{strip}}\;{\rm{(1}}{\rm{.2}}\:{\rm{m}}\,{\rm{\times }}\,{\rm{10}}{\rm{.0}}\:{\rm{m)}}}}$$
• PrGSH was measured daily throughout the IMP by recording ∼30 heights across the two diagonals of each paddock using a rising pasture plate meter (Jenquip, Feilding, New Zealand). The average of the 30 heights was used as the PrGSH.
• Post-grazing sward height (PoGSH) was also measured daily following grazing by recording ∼30 heights across the two diagonals of each paddock using a rising pasture plate meter. The average of the 30 heights was used as the PoGSH.
• DHA above 4 cm was the quantity of grass, allowing for a 4 cm residual above ground level, allocated to each animal for a period of 24 h, expressed in kg DM per cow per day. DHA was calculated using the PGHM of the paddock, area offered to the herd during the day and the number of cows in the herd.
• Grass OMD was determined using the in vitro neutral detergent cellulose method outlined by Morgan et al. (Reference Morgan, Stakelum and Dwyer1989) using the Fibertec™ Systems (FOSS, Ballymount, Dublin, Ireland).
• Grass NDF was determined using the Ankom 200 Fiber Analyzer (ANKOM Technology, Macedon, NY, USA) using the procedure of Van Soest et al. (Reference Van Soest, Robertson and Lewis1991).
The concentrate supplementation category contained the variables and interactions pertaining to the concentrate consumed by the herd during the IMP.
• Concentrate consumed (kg DM per cow per day).
• Interaction between concentrate consumed and DHA.
• Interaction between concentrate consumed and PGHM.
• Interaction between concentrate consumed and DIM.
In addition, the square and inverse terms of PGHM, DHA and concentrate consumed were investigated as independent variables.
Multiple regression analyses
The significant independent variables associated with changes in the dependent variables (GDMI, MY and MSY) were identified by multiple linear regression analysis. This analysis was carried out using the general linear model procedure in SAS Institute (2005) using a forward stepwise regression method. An equation containing the independent variables peak MY, DIM, PGHM, DHA and concentrate consumed was generated for all dependent variables. These independent variables were chosen as they were shown to be significantly associated with GDMI and MY in prediction equations in the literature (Delagarde and O'Donovan, Reference Delagarde and O'Donovan2005). Following the first equation, forward stepwise multiple regression was used to identify to what extent these, and the other, independent variables contributed to the prediction of the dependent variables (GDMI, MY and MSY). The stepwise regression was carried out manually by adding or removing independent variables rather than by using the automatic iterative procedure in SAS Institute (2005). This was carried out to prevent the inclusion of collinear variables in the equation, as the simplest method to remove colinearity is to omit variables that are correlated in the same equation. Each step after the first equation added a single independent variable (one step for each variable). If the significance of the calculated F-statistic was P < 0.05 for an independent variable, the variable was retained in the next step. Independent variables were removed from the equation if, after the addition of a new independent variable, the significance of the calculated F-statistic for the independent variable became P > 0.05. This resulted in one equation being generated for each dependent variable in each period with all independent variables in the equation being significant (F-statistic P < 0.05).
Results
Descriptive statistics
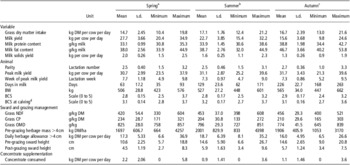
The data set for developing the multiple regression equations contained 71, 102 and 72 herds in SP, SU and AU, respectively (Table 1). Mean values for the dependent and independent variables for the total data set during the three periods are shown in Table 2. The average GDMI of herds in SP, SU and AU were 14.7 (±2.45), 17.1 (±1.76) and 16.7 (±2.39) kg DM per cow per day, respectively. The average MY of herds in SP, SU and AU were 27.7 (±3.66), 22.7 (±3.85) and 15.6 (±3.68) kg per cow per day, respectively. The average MSY of herds in SP, SU and AU were 2.0 (±0.26), 1.6 (±0.25) and 1.3 (±0.26) kg per cow per day, respectively. Herds in the data set ranged from 35 to 263 DIM. Cows in the herds ranged in peak MY from 21.3 to 39.6 kg per cow per day. The average BW of herds in the data set ranged from 423 to 662 kg. The mean parity of herds ranged from 1.0 to 3.3 lactations.
Mean herd values of the dependent and independent variables in the 245-herd data set at time of grass dry matter intake measurement

s.d. = standard deviation; DM = dry matter; BCS = body condition score; OMD = organic matter digestibility.
aSpring – 5 March to 30 April.
bSummer – 1 May to 31 July.
cAutumn – 1 August to 31 October.
dBody condition score (scale 0 to 5; Lowman et al., Reference Lowman, Scott and Somerville1976).
Herds in the data set were offered on average good quality grass (high OMD, high CP and low NDF; Table 2). Grass nutritive quality was highest in SP and decreased slightly in SU and AU. Mean NDF was 420 (±54.4), 453 (±37.0) and 456 (±29.3) g/kg DM in SP, SU and AU, respectively. Mean CP was 234 (±28.7), 204 (±30.8) and 210 (±29.6) g/kg DM in SP, SU and AU, respectively. Mean OMD was 825 (±28.0), 796 (±29.3) and 774 (±41.5) g/kg DM in SP, SU and AU, respectively.
The average DHA in SP, SU and AU was 17.3 (±5.33), 18.7 (±6.39) and 16.0 (±4.95) kg DM per cow per day, respectively. Concentrate was consumed in SP, SU and AU at an average rate of 2.2 (±2.06), 0.9 (±1.41) and 1.1 (±1.46) kg concentrate DM per cow per day, respectively. In SP, SU and AU 68%, 38% and 43%, respectively, of the herds in the data set received concentrate, with the remainder of herds receiving a grass only diet.
GDMI
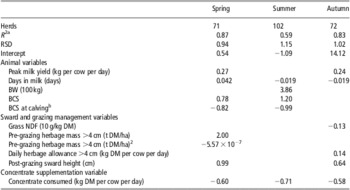
The equations for the prediction of GDMI in SP, SU and AU are presented in Table 3.
Multiple regression equations predicting grass dry matter intake (kg DM per cow per day) of grazing spring calving dairy herds in spring (5 March to 30 April), summer (1 May to 31 July) and autumn (1 August to 31 October)

DM = dry matter; RSD = residual standard deviation (kg); BCS = body condition score.
aCoefficient of correlation.
bBody condition score 0.25 unit (scale 0 to 5; Lowman et al., Reference Lowman, Scott and Somerville1976).
Spring
An increase in peak MY and DIM was associated with an increase in GDMI in SP. Cows with a higher BCS had higher GDMI in SP, 0.78 kg per 0.25 unit BCS. In addition, cows with a higher BCS at calving had a lower GDMI in SP, −0.82 kg per 0.25 unit BCS at calving. Sward and grazing management variables were associated with changes in GDMI in SP. The PGHM of the sward was significantly and positively associated with GDMI. There was a very small quadratic effect of sward PGHM on GDMI. Increasing PoGSH was associated with an increase in GDMI (+0.99 kg GDMI/cm increase in PoGSH). Herds consuming concentrate in SP reduced GDMI by −0.60 kg GDMI/kg DM concentrate consumed.
Summer
Heavier cows in SU had a higher GDMI (3.86 kg per 100 kg BW). Cows with a higher BCS had higher GDMI in SU (1.20 kg per 0.25 unit BCS). In addition, cows with a higher BCS at calving had a lower GDMI in SU (−0.99 kg per 0.25 unit BCS at calving). In SU, an increase in DIM was associated with a decrease in GDMI. Sward and grazing management variables were not associated with GDMI in SU. Herds consuming concentrate in SU had the largest decrease in GDMI associated with concentrate consumption (−0.71 kg GDMI/kg DM concentrate consumed).
Autumn
As was observed in SP, an increase in peak MY was associated with an increase in GDMI. The increase in GDMI was similar in both the SP and AU equations (0.27 and 0.24 kg increase in GDMI/kg increase in peak MY respectively). An increase in DIM in AU was associated with a similar decrease in GDMI as was found in SU (−0.019 kg/DIM). Sward and grazing management variables were associated with changes in GDMI in AU. Increasing DHA was associated with an increase in GDMI (0.14 kg/kg increase in DHA). An increase in the grass NDF content was associated with a decrease in GDMI (−0.13 kg/10 g increase in NDF content). Increasing PoGSH was associated with an increase in GDMI, with a smaller increase in GDMI associated with an increase in the PoGSH in AU in comparison to SP (+0.64 kg GDMI/cm increase in PoGSH).
Herds consuming concentrate in AU had a similar reduction in GDMI associated with concentrate consumption as was observed in SP (−0.58 kg GDMI/kg DM concentrate consumed).
MY
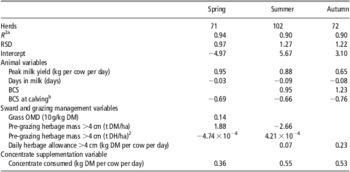
The equations for the prediction of MY in SP, SU and AU are presented in Table 4.
Multiple regression equations predicting milk yield (kg per cow per day) of grazing spring calving dairy herds in spring (5 March to 30 April), summer (1 May to 31 July) and autumn (1 August to 31 October)

RSD = residual standard deviation (kg), BCS = body condition score; OMD = organic matter digestibility; DM = dry matter.
aCoefficient of correlation.
bBody condition score 0.25 unit (scale 0 to 5; Lowman et al., Reference Lowman, Scott and Somerville1976).
Spring
A higher peak MY was associated with a higher MY in SP. An increase in DIM was associated with a decrease in MY in SP (−0.03 kg milk/day). BCS was not associated with any change in MY in SP. A higher BCS at calving was associated with a decrease in MY in SP of −0.69 kg per 0.25 unit BCS at calving. The sward and grazing management variable grass OMD was associated with an increase in MY of 0.14 kg with each 10 g increase in grass OMD. PGHM had a quadratic effect on MY in SP. As the PGHM of the sward increased MY increased. Concentrate supplementation was associated with an increase in MY in SP. The response to concentrate supplementation was 0.36 kg milk/kg DM concentrate consumed.
Summer
A higher peak MY was associated with a higher MY in SU
An increase in DIM was associated with a decrease in MY in SU which was at a larger rate than in SP (−0.09 kg milk/day). Cows with a higher BCS in SU had an increased GDMI (0.95 kg per 0.25 unit BCS). A higher BCS at calving was associated with a decrease in MY in SU of −0.66 kg per 0.25 unit BCS at calving. As in SP, PGHM had a quadratic effect on MY in SU. In SU, however, as the PGHM of the sward increased MY decreased. Concentrate supplementation was associated with an increase in MY in SU. The response to concentrate supplementation was 0.55 kg milk per kg DM concentrate consumed.
Autumn
A higher peak MY was associated with a higher MY in AU.
An increase in DIM was associated with a decrease in MY in AU at a rate similar to the decrease in SU (−0.08 kg milk/day). Cows with a higher BCS in AU had an increased GDMI (1.23 kg per 0.25 unit BCS). A higher BCS at calving was associated with a decrease in MY in AU of −0.76 kg per 0.25 unit BCS at calving. The sward and grazing management variable DHA was associated with an increase in MY in AU of 0.23 kg milk per kg DHA. Concentrate supplementation was associated with an increase in MY in AU. The response to concentrate supplementation was 0.53 kg milk per kg DM concentrate consumed.
MSY
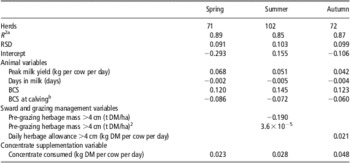
The equations for the prediction of MSY in SP, SU and AU are presented in Table 5.
Multiple regression equations predicting milk solids yield (milk fat and protein yield (kg per cow per day)) of grazing spring calving dairy herds in spring (5 March to 30 April), summer (1 May to 31 July) and autumn (1 August to 31 October)

RSD = residual standard deviation (kg); BCS = body condition score; DM = dry matter.
aCoefficient of correlation.
bBody condition score 0.25 unit (scale 0 to 5; Lowman et al., Reference Lowman, Scott and Somerville1976).
Spring
Peak MY had a significant positive effect on MSY in SP. An increase in DIM was associated with a decrease in MSY in SP. A higher BCS was associated with an increase in MSY of 0.120 kg MS per cow per day per 0.25 unit BCS. A higher BCS at calving was associated with a decrease in MSY in SP (reduction of 0.086 kg MS per 0.25 unit BCS at calving). The sward and grazing management variables were not associated with a change in MSY in SP.
Similar to MY, concentrate supplementation was associated with an increase in MSY in SP. The response to concentrate supplementation was 0.023 kg MS per kg DM of concentrate consumed.
Summer
Peak MY had a significant positive effect on MSY in SU. An increase in DIM was associated with a decrease in MSY. A higher BCS was associated with an increase in MSY of 0.145 kg MS per cow per day per 0.25 unit BCS. In SU, a higher BCS at calving was associated with a decrease in MSY of −0.072 kg MS per 0.25 unit BCS at calving. In SU, the PGHM offered to the herd had a quadratic effect on MSY. An increase in PGHM was associated with a decrease in MSY. The response of MSY to concentrate supplementation was similar in SU as it was in SP (0.028 kg MS per kg DM of concentrate consumed).
Autumn
Peak MY had a significant positive effect on MSY in AU similar to SP and SU. An increase in DIM was associated with a decrease in MSY as in SP and SU. In AU, a higher BCS was associated with an increase in MSY of 0.123 kg MS per cow per day per 0.25 unit BCS. A higher BCS at calving was associated with a decrease in MSY in AU (−0.060 kg MS per 0.25 unit BCS at calving). In AU, an increased DHA was associated with an increase in MSY (0.021 kg MS per kg increase in DHA). As for MSY in SP and SU, concentrate supplementation increased MSY in AU. The response to concentrate supplementation was largest in AU with an increase of 0.048 kg MS per kg DM of concentrate consumed.
Discussion
The objective of this study was to develop accurate prediction equations for GDMI, MY and MSY in SP, SU and AU for spring calving dairy herds grazing grass, using independent variables that are easily obtainable. Portability of empirical equations are often limited by the size and range of the data set used to develop them (Delagarde and O'Donovan, Reference Delagarde and O'Donovan2005). The size and range of the data set used in this analysis results in equations that can be used to predict GDMI, MY and MSY during the grazing season for conditions similar to those of the data set.
MY and MSY from pasture are largely dependent on the factors controlling GDMI (Dillon, Reference Dillon2006). The factors influencing GDMI, MY and MSY are numerous, but the development of the multiple regression equations for different periods of the grazing season highlight the most significant variables and the response achieved from changes in these variables.
GDMI
There is a genetic correlation between MY and DMI (van Aarendonk et al., Reference Van Aarendonk, Nieuwhof, Vos and Korver1991). As a result, it has been shown that high producing dairy cows have increased GDMI (Peyraud et al., Reference Peyraud, Comeron, Wade and Lemaire1996). The inclusion of peak MY as the independent variable representing milk production potential in the equations is justified. As expected, peak MY was a significant independent variable in SP and AU for GDMI. The equations are useful to predict GDMI after peak MY, because before peak MY date, peak MY is unknown. Peak MY was previously used in the multiple regression of Delagarde and O'Donovan (Reference Delagarde and O'Donovan2005) to predict GDMI during the grazing season but there are currently no multiple regression equations predicting GDMI at different stages during lactation. Delagarde and O'Donovan (Reference Delagarde and O'Donovan2005) found that GDMI increased by 0.23 kg per kg increase in fat corrected peak MY. This is similar to the response found in SP and AU in the current study (0.27 and 0.24 kg increase in GDMI/kg increase in peak MY per cow per day).
Peak MY was not a significant variable in SU; instead BW was the independent variable accounting for more of the variation in GDMI. In SU, an increase in BW was associated with an increase in GDMI. Heavier cows had a greater potential to consume grass. Intake was higher by 3.86 kg GDMI per 100 kg BW for heavier cows. This BW coefficient is higher than in other multiple regression equations predicting GDMI (Peyraud et al., Reference Peyraud, Comeron, Wade and Lemaire1996; Maher et al., Reference Maher, Stakelum and Rath2003; Delagarde and O'Donovan, Reference Delagarde and O'Donovan2005), due to the absence of peak MY as an independent variable in the equation.
The DIM of the herd was significantly associated with GDMI in all equations. In SP, as DIM increased the GDMI of cows increased. Peak GDMI occurs in weeks 8 to 22 post-calving (Ingvartsen and Andersen, Reference Ingvartsen and Andersen2000). After peak GDMI was reached, intake decreased and this was observed in the equation in SU and AU with the same rate of decline of GDMI in both seasons as DIM increased. Delagarde and O'Donovan (Reference Delagarde and O'Donovan2005) found that GDMI increased during lactation at a rate of 0.005 kg DM per DIM. This is contrary to the findings of the current study. It should be noted that the study of Delagarde and O'Donovan (Reference Delagarde and O'Donovan2005) generated a single GDMI prediction equation across all stages of lactation, which would have included the increase to peak GDMI as well as the decrease following peak GDMI resulting in an overall increase in GDMI over the whole lactation.
The BCS at calving is a very influential factor on the lactation performance of the dairy cow as it affects early lactation GDMI, MY and MSY (Roche et al., Reference Roche, Friggens, Kay, Fisher, Stafford and Berry2009). In SU, a higher BCS at calving was associated with a lower GDMI. In SU, a higher BCS was associated with a higher GDMI.
The PGHM of the sward offered to the herd was associated with GDMI in SP. The fact that PGHM and PGHM2 were both significant demonstrates that there was a curvilinear relationship between PGHM and GDMI. In SP, an increase in PGHM was associated with an increase in GDMI. Delagarde and O'Donovan (Reference Delagarde and O'Donovan2005) found similar coefficients for PGHM (2.6 kg DM/t DM per ha) and PGHM2 (−0.0005 kg DM/t DM per ha) in the prediction of GDMI to those found in the current study. Peyraud et al. (Reference Peyraud, Comeron, Wade and Lemaire1996) also found a curvilinear relationship between organic matter (OM) intake and PGHM of the sward, but the coefficients for PGHM (9.43 kg OM/t OM per ha) and PGHM2 (−0.820 kg OM/t OM per ha) were larger than those of the current study. The differences were due to the fact that Peyraud et al. (Reference Peyraud, Comeron, Wade and Lemaire1996) investigated the effect of PGHM on OMI of autumn-calving cows in spring, whereas the GDMI of spring calving cows in spring was investigated in our study. Peyraud et al. (Reference Peyraud, Comeron, Wade and Lemaire1996) also used different variables for the prediction of intake compared with the current study, which would have resulted in PGHM accounting for a different proportion of the variation in GDMI. In addition, the PGHM of swards used by Peyraud et al. (Reference Peyraud, Comeron, Wade and Lemaire1996) to develop the multiple regression equations were higher than the range of data in the current study.
The PoGSH is a function of DHA (O'Donovan and Delaby, Reference O'Donovan and Delaby2008). Increasing DHA reduces grazing intensity leading to an increase in PoGSH. Increasing PoGSH, in SP and AU, resulted in a positive response in terms of GDMI. In SP, the GDMI response (0.99 kg GDMI per cm) was higher than in AU (0.64 kg GDMI per cm). This may be due to the GDMI profile during lactation. In SP, the GDMI of the herd increases, increasing the PoGSH increases GDMI. In AU, the GDMI of the herd decreases resulting in a lower response to an increase in PoGSH. There was no influence of PoGSH on GDMI in SU as cows were less restricted in SU with a higher mean DHA and a higher mean PoGSH (Table 2). Although PoGSH was associated with an increase in GDMI in SP, there was no association with MY or MSY. Instead DHA had an effect on MY in SU and AU and on MSY in AU.
DHA (>4 cm) was found to be positively associated with GDMI in AU. In AU, the increase in GDMI (0.14 kg GDMI per kg DHA) was similar to that observed by Maher et al. (Reference Maher, Stakelum and Rath2003) when DHA increased from 19.8 kg to 24.0 kg (>3.5 cm) (0.12 kg GDMI per kg DHA). Other prediction equations found a curvilinear relationship between DHA and GDMI (Peyraud et al., Reference Peyraud, Comeron, Wade and Lemaire1996). In the current study, the relationship between DHA and GDMI was linear.
The prediction equations also highlighted that in AU an increase in the NDF of grass was associated with a decrease in GDMI. Grass NDF is an important nutritional factor through its effects on digestion and rumen fill, with a lower rate of digestion and higher rumen fill expected as NDF in the diet increases (Van Soest, Reference Van Soest1994) which is related to reduced intake (Oba and Allen, Reference Oba and Allen1999). Delagarde et al. (Reference Delagarde, Peyraud, Delaby and Faverdin2000) found that the NDF in the vertical sward above 10 cm (from ground level) increased significantly in October. In Ireland, best practice grassland management dictates that grazing swards have increased PGHM as the rotation and regrowth length increases in AU to build-up farm covers resulting in increased sward height, increased NDF and an increased effect on GDMI in AU.
Feeding concentrate was associated with a decrease in GDMI in all periods. Stakelum (Reference Stakelum1986) found that feeding concentrate reduced GDMI by 0.59 kg GDMI per kg concentrate. This substitution rate was similar to that observed in the GDMI prediction equations in SP and AU. The larger substitution rate observed in SU may be as a result of herds receiving an increased DHA level, because as DHA increases, substitution rate increases (Penno et al., Reference Penno, MacDonald, Holmes, Davis, Wilson, Brookes and Thom2006).
MY and MSY
The prediction of MY and MSY followed a similar pattern in SP, SU and AU. There was a decrease in MY and MSY as DIM increased in each of the three periods. This is due to peak MY occurring in week 5 to 7 post-calving (Ingvartsen and Andersen, Reference Ingvartsen and Andersen2000). The average DIM for SP herds was 63 DIM, whereas peak MY was achieved at 54 DIM, explaining the decrease in MY and MSY in SP. As anticipated MY decreased in SU and AU (Ingvartsen and Andersen, Reference Ingvartsen and Andersen2000) at a similar rate of decline (0.09 kg and 0.08 kg per DIM in SU and AU, respectively). This is a higher rate of decline than that found by Delagarde and O'Donovan (Reference Delagarde and O'Donovan2005; 0.05 kg per DIM). The higher rate of decline found in the current equations is due to the equations predicting MY in SP, SU and AU, whereas the equation of Delagarde and O'Donovan (Reference Delagarde and O'Donovan2005) predicted the rate of decline for the overall lactation, including the period before peak MY. In SP, SU and AU, MSY also decreased with increasing DIM. The decrease in MSY showed a similar trend to the decrease in MY, which was expected as MY is a multiplicative component of MSY.
In SU and AU, a higher BCS was associated with a higher MY. In SP, SU and AU, a higher BCS was associated with a higher MSY. An increase in BCS is an indicator that the cow is no longer in negative energy balance and as a result is no longer mobilising body reserves. Instead, the cow has excess energy available after energy is partitioned for maintenance, milk production and pregnancy and as a result the excess energy is used to increase BW and BCS. Thus at this point, a higher intake would be expected to result in a higher BW and a higher BCS, which was found.
The BCS at calving is a very influential factor on the lactation performance of the dairy cow as it affects early lactation MY and MSY (Roche et al., Reference Roche, Friggens, Kay, Fisher, Stafford and Berry2009). Roche et al. (Reference Roche, Friggens, Kay, Fisher, Stafford and Berry2009) showed a curvilinear association between BCS and milk production, with an optimum calving BCS for milk production of between 3.0 and 3.5. A higher BCS at calving was associated with a lower MY and MSY in all seasons in our study. As shown above a higher BCS at calving was associated with a lower GDMI in SP and SU. The lower GDMI of the cows with a higher BCS at calving would lower energy intake, as a result the cow would have less energy available for MY and MSY. This would reduce peak MY and MSY and as a result could result in a lower MY and MSY following peak.
The PGHM of the sward offered to the herd was associated with MY in SP and SU, and with MSY in SU. The fact that PGHM and PGHM2 were both significant demonstrates that there was a curvilinear relationship between PGHM and MY and PGHM and MSY at different times during the grazing season. As with GDMI, an increase in PGHM in SP was associated with an increase in MY. In SU, however, MY and MSY decreased as the herd grazed swards with an increase in PGHM. Curran et al. (Reference Curran, Delaby, Kennedy, Murphy, Boland and O'Donovan2010) also found that cows grazing a low PGHM sward (1600 kg DM/ha) had an increased MY and MSY in comparison with cows on a high PGHM sward (2400 kg DM/ha).
DHA (>4 cm) was found to be positively associated with MY and MSY in AU and with MY in SU. Other prediction equations found a curvilinear relationship between DHA and MY (Delagarde and O'Donovan, Reference Delagarde and O'Donovan2005). In the current study, the relationship between DHA and MY was linear. The absence of a curvilinear relationship is probably associated with the highest DHA offered being only 36.9 kg DM per cow per day. Maximum GDMI is achieved when DHA is twice the maximum GDMI (Bargo et al., Reference Bargo, Muller, Kolver and Delahoy2003). In this study, at the maximum DHA in SP, SU and AU (36.9, 35.2 and 26.6 kg DM per cow per day), the DHA was only 1.9, 1.7, 1.2 times the maximum GDMI. Increasing the DHA meant cows had access to increased quantities of grass; the cows were less restricted and increased the quantity of grass that they consumed (Maher et al., Reference Maher, Stakelum, Buckley and Dillon1999). This resulted in an increase in the energy available for MY and MSY. Stakelum (Reference Stakelum1986) reported that DHA had a significant positive effect on MY and MSY in AU, which is similar to the findings from the current study. The MY response in AU was similar to the response in previous multiple regression equations (0.20 kg per kg DHA (Delaby et al., Reference Delaby, Peyraud and Delagarde2001) and 0.30 kg per kg DHA (Maher et al., Reference Maher, Stakelum and Rath2003)). Indeed, the reduced grazing intensity in AU allowed greater selection of a higher nutritive value grass and may have contributed to the increased MY and MSY observed with an increased DHA.
The grass OMD is frequently used to characterise the energy available to the cow. Vegetative swards in spring consist predominantly of leaf and are highly digestible. The prediction equation for MY in SP showed that an increase in grass OMD was associated with an increase in MY. As energy is the main limiting factor to milk production at grazing an increase in the OMD of the grass results in increased energy being available to the cow for milk production (Stakelum and Dillon, Reference Stakelum and Dillon1990).
Feeding concentrate was associated with an increase in MY and MSY in all periods. Many lactation studies have reported an MY response to concentrate. Stakelum (Reference Stakelum1986) found that concentrate increased MY by 0.61 kg and MSY by 0.02 kg at a DHA of 16 kg DM per cow per day (above ground level). These responses agree with the responses to concentrate found in the current study. The coefficients for concentrate in the current study show that the response to concentrate is different at different stages of lactation and seasons. The MY response to concentrate is reportedly lower in SP compared with SU (Stockdale, Reference Stockdale1999) due to the higher energy content of spring grass. This was observed in the current study where the lowest MY and MSY response occurred in SP. The MY and MSY response to concentrate depends largely on the size of the energy deficit between the potential energy demand and the actual energy supplied by the feed consumed (Baudracco et al., Reference Baudracco, Lopez-Villalobos, Holmes and MacDonald2010). A large response is achieved only if the performance of the cow is severely limited by lack of feed (Holmes and Mathews, Reference Holmes and Matthews2001). Factors that increase the energy deficit decrease the substitution rate and increase the MY and MSY response to concentrate (Baudracco et al., Reference Baudracco, Lopez-Villalobos, Holmes and MacDonald2010). Delaby et al. (Reference Delaby, Peyraud and Delagarde2001) found an MY response to concentrate in mid-lactation of 1.04 kg per kg DM concentrate consumed which was a large response. This response in comparison to the current study may be as a result of the genetic merit of the cows used in the study of Delaby et al. (Reference Delaby, Peyraud and Delagarde2001). Cows were in mid-lactation (177 DIM) and were producing 28.3 to 30.7 kg milk/day at the beginning of the study. In the current study, cows in mid lactation (SU) were producing on average 31.1 kg milk/day at peak MY. The response to concentrate in Delaby et al. (Reference Delaby, Peyraud and Delagarde2001) was characteristic of restrictive grazing conditions compared with the energy requirements of the cows resulting in a high MY response to concentrate. In the current study, the response was characteristic of cows that are not restricted by grazing conditions, hence a high substitution rate and low milk response. Kellaway and Porta (Reference Kellaway and Porta1993) concluded that when DHA was restricted, offering concentrate was likely to result in an immediate response of 0.041 kg MS per kg DM concentrate. Robaina et al. (Reference Robaina, Grainger, Moate, Taylor and Stewart1998) found that MSY increased linearly by 0.064 kg MS per kg DM concentrate for quantities of concentrate varying from 1.8 to 6.7 kg DM per cow per day. The current study found a response to concentrate of between 0.023 and 0.048 kg MS/kg DM concentrate consumed. The MSY response found by Robaina et al. (Reference Robaina, Grainger, Moate, Taylor and Stewart1998) was the response to concentrate of cows on poor quality grass (<700 g DM digestibility per kg grass DM). The response in the current study may be lower due to the cows in the current study being offered grass of high digestibility compared with the sward offered to cows in Robaina et al. (Reference Robaina, Grainger, Moate, Taylor and Stewart1998). Grass quality has an effect on the response of MY and MSY to concentrate with a higher response found from cows offered concentrate on a poor quality sward compared with a high-quality sward. The MSY response of cows offered concentrate was largest in the AU and lowest in SP, which is similar to Penno et al. (Reference Penno, MacDonald, Holmes, Davis, Wilson, Brookes and Thom2006). This may be due to the lactation profile of milk fat and protein content (Roche et al., Reference Roche, Berry and Kolver2006). As lactation progresses the milk fat and protein concentration increases from nadir. As all herds in the data set were spring calving, late lactation corresponded to AU. The MY response to concentrate was similar in SU and AU, but the fat and protein concentration of the milk was higher in AU than in SU leading to an increased MSY and a better response of MSY to concentrate in AU than in SU. Roche et al. (Reference Roche, Berry and Kolver2006) also found a 0.03 and 0.08 percentage unit increase in milk protein concentration from cows consuming 3 or 6 kg DM concentrate compared with cows consuming no concentrate.
The development of the prediction equations will increase the knowledge available to dairy farmers, will allow a more accurate dietary evaluation and improve decision making with regard to the requirement for concentrate supplementation and grazing management. This will lead to increased confidence in grazing management and reliance on grazed grass, increased proportion of grazed grass in the dairy cow diet and increased profitability.
Conclusion
This study developed multiple regression equations from easily obtainable variables available at farm level for the prediction of GDMI, MY and MSY for spring calving dairy herds across a wide range of grazing situations. The equations developed account for a large proportion of the variation in GDMI, MY and MSY using the most significant animal, sward and grazing management and concentrate supplementation factors.
Acknowledgements
This work was funded by the Irish Department of Agriculture, Food and the Marine Research Stimulus Fund (RSF 07 526). The authors acknowledge the researchers of Teagasc, Moorepark and the researchers of INRA, St. Gilles for their time and assistance.