I. INTRODUCTION
TiO2, which is widely studied as a promising photocatalyst, has attracted tremendous research interest for photocatalytic water splitting, Reference Fujishima and Honda1–Reference Chen, Li, Grätzel, Kostecki and Mao4 solar hydrogen generation, Reference Chen, Shen, Guo and Mao5–Reference Chen and Mao8 and environmental pollution removal. Reference Liang, Zhang, Zheng, Tsang, Li, Shu, Cheng and Li9 However, its wide band gap of 3.0–3.2 eV limits its activity mainly in the ultraviolet region of the solar spectrum. Our recent discovery of black TiO2 nanocrystals by hydrogenation provides one more solution for extending its optical properties into the near-infrared region and improving its photocatalytic activity, Reference Chen, Liu, Yu and Mao10 beyond the traditional metal-/nonmetal-doping Reference Choi, Termin and Hoffmann11,Reference Chen and Burda12 and semiconductor sensitizing Reference Baker and Kamat13 approaches. Besides their dramatic structural, Reference Xia and Chen14–Reference Liu, Yu, Chen, Mao and Shen16 optical, Reference Chen, Liu, Yu and Mao10 and photocatalytic Reference Chen, Liu, Yu and Mao10 property changes, hydrogenated TiO2 nanocrystals have displayed superior performance as electrode materials for lithium-ion batteries, Reference Shen, Uchaker, Zhang and Cao17,Reference Xia, Zhang, Li, Oyler, Liu and Chen18 supercapacitors, Reference Lu, Wang, Zhai, Yu, Gan, Tong and Li19 fuel cells, Reference Zhang, Yu, Li, Gao, Zhao, Song, Shao and Yi20 and field emission. Reference Zhu, Wang, Chen, Li, Zhou and Zhang21 Here, we report hydrogenated TiO2 nanocrystals with excellent and tunable microwave absorption properties, based on a novel collective-movement-of-interfacial-dipole (CMID) mechanism. This study paves a way for new applications of TiO2 and other oxide materials beyond their traditional fields and opens a new avenue for developing new generations of microwave absorption materials (MAMs).
Gigahertz MAMs play important roles in many military (e.g., the stealth coating on the B-2 bomber) and civil (e.g., telecommunications, noise reduction, information security, signal, and data protection) applications. Reference Micheli22–Reference Xia, Zhang, Oyler and Chen28 Increasing the absorption capability of shielding materials in the microwave region (2−18 GHz) is key to minimize radar reflection from aircraft surfaces to avoid radar detection, and to reduce data and information leakage in various electronic devices. Reference Micheli22–Reference Xia, Zhang, Oyler and Chen28 The absorption of the microwave electromagnetic field can be attributed to the losses of the electrical and magnetic fields of the microwave radiation within the materials. Reference Bowler24,Reference Petrov and Gagulin25 The electrical loss is primarily caused by dielectric relaxation effects associated with the alignment of polar groups (permanent and induced dipoles) in the materials due to the rapidly propagating microwave electromagnetic field. Reference Bowler24,Reference Petrov and Gagulin25 This mechanism is called dipole rotation. Reference Bowler24,Reference Petrov and Gagulin25,Reference Xia, Zhang, Oyler and Chen28 The magnetic loss is primarily induced by the strongly interacting electron spins in magnetic domain walls via ferromagnetic filler particles (e.g., iron or cobalt) dispersed in a matrix, namely ferromagnetic resonance. Reference Feng, Qiu, Shen and Li26,Reference Peng, Wang, Kan, Shen, Wei and Chen27 Traditional MAM candidates are carbonaceous materials and ferroelectric ceramics. Reference Petrov and Gagulin25 Ferrites and ferromagnetic materials, Reference Petrov and Gagulin25 barium and lead zirconates/titanates Reference Petrov and Gagulin25 are examples of ferroelectric ceramics. Carbonaceous materials, such as carbon nanotubes Reference Zhao, Li and Shen23 and carbonyl-iron, Reference Feng, Qiu, Shen and Li26 are conventionally good MAMs. They have typical real permittivity values of 10–16 and dielectric dissipation factors of 0.1–0.4 in the frequency range of 2–18 GHz. Reference Zhao, Li and Shen23 However, ceramic ferroelectrics cannot be used as such due to their high reflection coefficients at the interface with air, and carbonaceous materials have flame resistance concerns. Reference Petrov and Gagulin25 These MAMs work through dipole rotation or ferromagnetic resonance mechanisms.
Although it has a large static dielectric constant, TiO2 is not a good MAM because of its poor absorption in the microwave electromagnetic frequency range of 1–18 GHz by the lack of effective dipole rotation or ferromagnetic resonance. Recently, we proposed a new approach in inducing strong microwave absorption in hydrogenated TiO2 nanocrystals based on the CMID mechanism to cause collective interfacial polarization amplified microwave absorption (CIPAMA). Reference Xia, Zhang, Oyler and Chen28 Interfacial polarization occurs whenever there is a buildup of a charge at a boundary between two regions or materials. Reference Yu and Cardona29 Charge transfers and accumulation are commonly observed in crystal defects, such as dislocations, disorders, grain or phase boundaries. Rutile, anatase TiO2, and the recently reported hydrogenated TiO2 have different electronic band structures and dielectric constants. Reference Chen, Liu, Yu and Mao10,Reference Chen, Liu, Liu, Marcus, Wang, Oyler, Grass, Mao, Glans, Yu, Guo and Mao15,Reference Yu and Cardona29,Reference Diebold30 Hydrogenated TiO2 nanocrystals have additional crystalline/disordered interfaces. Reference Chen, Liu, Yu and Mao10,Reference Chen, Liu, Liu, Marcus, Wang, Oyler, Grass, Mao, Glans, Yu, Guo and Mao15 Interfacial band bending and polarization are expected in the boundaries between these phases. The rutile phase can evolve from the anatase phase by simply heating at elevated temperatures Reference Xia, Otto, Dutta, Murowchick, Caruso, Peng and Chen31 and hydrogenation can induce a crystalline/disordered core/shell structure. Reference Choi, Termin and Hoffmann11,Reference Chen, Liu, Liu, Marcus, Wang, Oyler, Grass, Mao, Glans, Yu, Guo and Mao15 Thus, a combination of heating and hydrogenation can induce integration of the rutile, anatase, and hydrogenated TiO2 on the nanometer scale to increase interfacial areas. This will increase the interfacial polarization between the anatase/rutile and crystalline/disordered interfaces. The propagation of the microwave electromagnetic field through the material will cause rapid switching of the polarizing direction and charge accumulation at these interfaces. Previous studies of microwave photoconductance measurements have found that the photoconductance of TiO2 may play important roles in the charge transport and transfer across the interfaces. Reference Marchioro, Teuscher, Friedrich, Kunst, van de Krol, Moehl, Grätzel and Moser32 The possible higher conductance of the hydrogenated TiO2 nanoparticles in the microwave region may further help the propagation of the microwave electromagnetic field through the material. Reference Shin, Joo, Samuelis and Maier33,Reference Xia, Zhang, Murowchick, Liu and Chen34 This will induce a CMID to cause the CIPAMA effect. Reference Xia, Zhang, Oyler and Chen28 Thereby, enhanced microwave absorption is obtained. In this scheme, the enhancement is mainly caused by the loss of the electrical component of the microwave irradiation. The latter is attenuated and dissipated into thermal energy along the course of its propagation through the material.
Here, we demonstrate that excellent and tunable microwave absorption is achieved by tuning the structural properties of the hydrogenated TiO2 nanocrystals, i.e., the hydrogenated anatase/rutile crystalline/amorphous compositions. We also elucidate the roles of the anatase/rutile and crystalline/amorphous interfaces in the enhancement of the microwave absorption in the hydrogenated TiO2 nanocrystals. The findings of turning TiO2 nanocrystals by hydrogenation into an excellent MAM may prove to be useful to other material systems and may inspire other new applications.
II. EXPERIMENTAL SECTION
Pristine crystalline TiO2 nanoparticles were first prepared with a precursor solution consisting of titanium butoxide, ethanol, and deionized water. The solution was stirred at room temperature for 24 h and then dried at 120 °C overnight. The dried white powders were calcinated in air at 500 °C for 2 h to enhance their crystallinity to obtain pristine anatase TiO2 nanocrystals. Pristine TiO2 nanocrystals with various anatase/rutile ratios were obtained by annealing pristine anatase TiO2 nanocrystals at 450−650 °C for a suitable time period. The pristine TiO2 nanocrystals were placed in a sealed sample chamber under vacuum for 1 h and hydrogenated in a 5.0 bar H2 atmosphere at about 450–650 °C for various time periods to obtain the hydrogenated TiO2 nanocrystals with different anatase/rutile ratios.
The x-ray diffraction (XRD) was performed using a Rigaku Miniflex XRD instrument with Cu Kα as the x-ray source (wave length = 1.5418 Å). The Brunauer–Emmett–Teller (BET) surface specific areas were measured by Micromeritics ASAP 2020 (Micromeritics, Atlanta, GA). Before BET measurement, the sample was pretreated at 150 °C for 10 h under nitrogen sweep. The transmission electron microscopy (TEM) study was performed on a FEI Tecnai F200 TEM (FEI, Hillsboro, OR) with an electron accelerating voltage of 200 kV. A small amount of sample dispersed in water was dropped onto a thin holey carbon film, and dried overnight before TEM measurements. The Raman spectra were collected on an EZRaman-N benchtop Raman spectrometer with the excitation wave length of 785 nm. The spectrum range was from 100 to 3100 cm−1. The spectrum collection time was 4 s and was averaged over three measurements to improve the signal-to-noise ratio.
The complex permittivity and permeability were measured at the frequency range of 2–18 GHz using HP8722ES network analyzer (HP, Palo Alto, CA). The TiO2 nanocrystals were dispersed in molten paraffin wax, and cast into a ring mold with a thickness of 2.0 mm, an inner diameter of 3 mm, and an outer diameter of 7 mm. The content of TiO2 nanocrystals was 60 wt%, and the testing was performed at ambient temperature.
The Fourier transform infrared (FTIR) spectra were collected using a Thermo-Nicolet iS10 FTIR spectrometer (Thermo Fisher Scientific, Waltham, MA) with an attenuated total reflectance (ATR) unit. TiO2 nanocrystals were pressed onto the ZnSe crystal of the ATR unit, and the measurements were performed in air at ambient temperature. All 1H nuclear magnetic resonance spectroscopy (NMR) experiments were performed on an 8.45 tesla Oxford magnet with a three channel Tecmag Apollo NMR console, using a home-built, doubly tuned, MAS solid-state NMR probe with a 3.2 mm stator assembly from Revolution NMR. The magic angle spinning rate was 8 kHz, the proton excitation pulse during the Bloch decay experiment was about 50 kHz, and each spectrum was acquired with 512 repetition rate. The spectra were externally referenced to D2O. NMR spectra were acquired from all samples as well as an empty rotor to measure the hydrogen present. The contribution of the empty rotor was then subtracted to obtain the information from the samples which was further scaled by the mass of samples to give a quantitatively accurate spectrum.
The surface chemical bonding information was obtained with XPS on a PHI 5400 XPS system (Physical Electronics, Inc., Chanhassen, MN) equipped with a conventional (non-monochromatic) Al anode x-ray source with Kα radiation. A small amount of TiO2 nanocrystals were pressed onto conductive carbon tape for XPS measurements. The binding energies were calibrated with respect to the C 1s peak from the carbon tape at 284.6 eV. The electron spin resonance (ESR) spectra were collected on a Benchtop Micro-ESRTM instrument, at a microwave frequency of 9.70 GHz at room temperature without light irradiation. The ESR data were calibrated in relation to g = 2.0066 of 2,2,6,6-tetramethyl-4-hydroxylpiperidine-1-oxyl. The scanning time was 30 s per sweep, and the spectrum was averaged over 30 sweeps. Quartz ESR tubes with an inner diameter of 5.8 mm were used.
III. RESULTS AND DISCUSSION
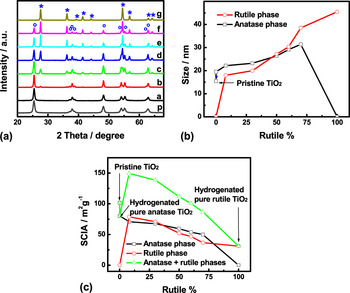
We found previously that hydrogenation of TiO2 anatase nanocrystals at a high temperature creates a disordered surface layer on the crystalline core of TiO2 nanoparticles Reference Chen, Liu, Yu and Mao10 and transforms a partial anatase phase into a rutile phase at the same time. Reference Xia, Zhang, Oyler and Chen28 Thus, we believe that by changing the hydrogenation temperature or reaction time, we can tune the anatase/rutile and crystalline/amorphous composition in the hydrogenated TiO2 nanocrystals. Figure 1(A) shows the XRD patterns of the starting pristine TiO2 nanocrystals in comparison with those of hydrogenated TiO2 nanocrystals with various anatase/rutile compositions. The strong diffraction peaks suggested that all the samples contained highly crystalline phases. The anatase/rutile composition in the hydrogenated TiO2 nanocrystals was calculated from the (101) peak at 2θ = 25.4° in the anatase phase and (110) peak at 2θ = 27.5° according to this formula:
 $$x = {\left( {1 + 0.8\,{{{I_{\rm{A}}}} \mathord{\left/ {\vphantom {{{I_{\rm{A}}}} {{I_{\rm{R}}}}}} \right. \kern-\nulldelimiterspace} {{I_{\rm{R}}}}}} \right)^{ - 1}}\quad ,$$
where x is the weight fraction of rutile in the powders, and I A and I R are the x-ray intensities of the anatase (101) and rutile (110) peaks, respectively. Reference Spurr and Myers35
(A) XRD patterns of pristine (curve p) TiO2 and hydrogenated anatase/rutile crystalline/amorphous TiO2 nanocomposites: (a) H-anatase (0% rutile), (b) H-8 wt% rutile, (c) H-30 wt% rutile, (d) H-50 wt% rutile, (e) H-60 wt% rutile, (f) H-70 wt% rutile, (g) H-rutile (100 wt% rutile). The labels (o) and (*) denote anatase and rutile phases, respectively. (B) Calculated crystalline grain size changes of the anatase and rutile phases in the pristine and hydrogenated TiO2 nanocomposites. The data points in both of the black line and red line are calculated from the XRD patterns as shown in (A). The red and black lines represent the change of the average size of the crystalline anatase phase and rutile phase, respectively, versus the percentage of the rutile phase. (C) Calculated SCIA changes of the crystalline anatase and rutile phases in the pristine and hydrogenated TiO2 nanocomposites.

Figure 1(B) shows the calculated change of the crystalline grain sizes of the anatase and rutile phases in the pristine and hydrogenated TiO2 nanocomposites. The average size of primary crystalline grains was calculated using the Scherrer equation: τ = (kλ)/(βcosθ), where τ is the mean size of the ordered (crystalline) domains, k is the shape factor with a typical value of 0.9, λ is the x-ray wave length, β is the line broadening full width at half maximum (FWHM) peak height in radians, and θ is the Bragg angle. Reference Jenkins and Snyder36 The positions and FWHMs of the anatase (101) and rutile (110) peaks were used to calculate the grain size of the anatase and rutile phases, respectively. The average size of the crystalline anatase phase increased to 19.5 nm in the hydrogenated anatase TiO2 nanocrystals from 15.4 nm in the pristine anatase TiO2 nanocrystals. The size of the crystalline anatase phase slowly increased to 31.4 nm as the percentage of rutile increased to 70% in the hydrogenated TiO2 nanocomposite. The average size of the crystalline rutile phase increased from 18.0 nm in the hydrogenated TiO2 nanocomposite with 8% rutile content to 45.5 nm as the percentage of rutile increased to 100%. As hydrogenated TiO2 nanocomposites were obtained by heating pristine TiO2 nanocrystals at about 450–650 °C for various time periods under H2 atmosphere. This heating step led to the growth of the crystalline grains in the hydrogenated nanoparticles besides the phase transition. The average size of the crystalline rutile phase was smaller than that of the anatase phase in the hydrogenated TiO2 nanocomposites when the percentage of rutile phase was <50%, but became larger afterward. The increase in size of the crystalline rutile phase was faster than that of the anatase phase in the hydrogenated TiO2 nanocomposites.
The specific surface areas (SSAs) of isolated particles can be estimated according to the formula SSA = 6/ρD, where ρ is the density of the particle and D is the diameter of the particle. Reference Ortega, Kodas, Chadda, Smith, Ciftcioglu and Brennan37 Here we can use this formula to estimate the specific crystalline interfacial area (SCIA) of crystalline grains. As the size of the crystalline phase is known, the changes in the SCIA of the crystalline anatase and rutile phases in the pristine and hydrogenated TiO2 nanocomposites can be calculated as shown in Fig. 1(C). The density of bulk anatase (3.83 g/cm3) and rutile (4.24 g/cm3) was used in the calculation. The SCIA of the starting pristine anatase TiO2 nanocrystals was around 101.5 m2/g. It decreased to 80.4 m2/g when they were converted to hydrogenated anatase TiO2 nanocrystals, as the size of the crystalline phase increased. The SCIA of the anatase phase continued to decrease as the rutile phase emerged and grew with higher percentage. The SCIA of the rutile phase decreased as the percentage of the rutile phase increased, due to the increase of the crystalline rutile grains. In the hydrogenated anatase/rutile mixtures, the SCIAs of the anatase phase were similar to those of the rutile phase, even the percentage of rutile or anatase phase was very small. This was likely due to that when its percentage was small, the size of the crystalline anatase or rutile phase was much smaller than that of the other phase. It has been suggested that within anatase/rutile composites there is a morphology of nanoclusters containing atypically small rutile crystallites interwoven with anatase crystallites, Reference Hurum, Agrios, Gray, Rajh and Thurnauer38 and that the rutile phase starts to form at the interfaces between the anatase particles in the agglomerated TiO2 particles. Reference Zhang, Xu, Feng, Li and Li39 The total SCIA of the anatase and rutile phases in hydrogenated anatase/rutile composites increased when the rutile phase appeared, and then decreased with the increase of the rutile phase. The hydrogenated composite with 8% rutile phase had the highest total SCIA. The total SCIA was larger than that of the pristine TiO2 nanocrystals when the rutile percentage was <60% and the hydrogenated composite with 60% rutile phase had similar total SCIA as the pristine TiO2 nanocrystals. The actual SSAs obtained from BET surface specific area measurements on a Micromeritics ASAP 2020 instrument of pristine TiO2, 15.3 m2 g−1 for pristine TiO2, 13.6 m2 g−1 for hydrogenated TiO2 with 8% rutile, and 11.5 m2 g−1 for hydrogenated TiO2 with pure rutile. The SCIA was roughly 10 times of the SSA. This difference mainly comes from the SCIA, while the SSA was accessed in the BET measurement. If all the particles are single crystalline and isolated from each other, the SCIA will be equal to the SSA. If some of the particles are aggregated or have multiple crystalline grains, the SCIA will be larger than the SSA. The SCIA is a better value to estimate the interfacial areas here, as both the pristine and hydrogenated TiO2 nanoparticles here were aggregated, and the hydrogenated TiO2 with mixed crystalline anatase and rutile phases.
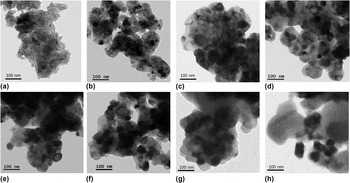
Figure 2 shows typical low-resolution TEM images of pristine anatase TiO2 nanocrystals and hydrogenated TiO2 nanocomposites with various rutile percentages. Pristine TiO2 anatase nanocrystals [Fig. 2(a)] were highly aggregated with each other, and the average size of the primary anatase nanocrystals was around 15 nm in diameter, consistent with the XRD results. The average size of the primary particles increased to around 20 nm for hydrogenated TiO2 anatase nanocrystals [Fig. 2(b)], which were also highly aggregated. This led to the decrease of SCIA. The average size of the primary particles further increased with the increase in percentage of rutile phase in the hydrogenated TiO2 nanocrystals [Figs. 2(c)–2(h)]. The increase in the average size of the primary particles should lead to the decrease in the total SCIA of the nanocomposites as the percentage of the rutile phase. However, the aforementioned XRD analysis suggested that the SSA of the hydrogenated anatase/rutile nanocomposites with rutile percentage <60 wt% [Figs. 2(c)−2(e)] was larger than that of the pristine TiO2 nanocrystals. This can be explained by the increase in the SCIA of the rutile phase which was large than the decrease in the SCIA of the anatase phase when the percentage of rutile was low. So the total SCIA increased. As the sizes of both anatase and rutile phases further increased, the increase in the SCIA of the rutile phase no longer was able to compensate the decrease in the SCIA of the anatase phase, leading to decrease in the total SCIA of the anatase and rutile phases, when the rutile percentage was >60 wt%.
Low-resolution TEM images of (a) pristine anatase TiO2 nanocrystals and hydrogenated anatase/rutile composite nanocrystals. (b) H-anatase (0% rutile), (c) H-8 wt% rutile, (d) H-30 wt% rutile, (e) H-50 wt% rutile, (f) H-60 wt% rutile, (g) H-70 wt% rutile, (h) H-rutile (100 wt% rutile).

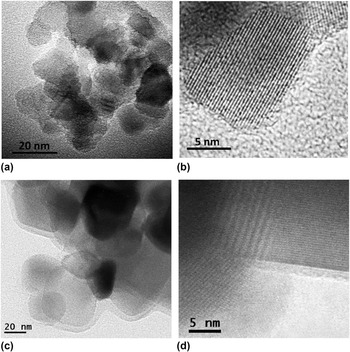
Figure 3 shows high-resolution TEM images of pristine TiO2 and hydrogenated TiO2 nanocomposites with 60 wt% rutile. Pristine anatase TiO2 nanoparticles were highly aggregated and crystalline with clear and sharp lattice fringes and crystal edges as shown in Figs. 3(a) and 3(b). Hydrogenated TiO2 nanocrystals were also highly aggregated, but meanwhile were clearly coated with an additional layer to form a core/shell structure [Fig. 3(c)]. The core was crystalline with well-resolved lattice fringes, but the shell was more amorphous, as shown in Fig. 3(d). This suggested that the atoms in this outer layer were likely disordered from both anatase and rutile phases, consistent with previous observations in hydrogenated TiO2 nanocrystals. Reference Chen, Liu, Yu and Mao10,Reference Xia and Chen14,Reference Chen, Liu, Liu, Marcus, Wang, Oyler, Grass, Mao, Glans, Yu, Guo and Mao15
High-resolution TEM images of (a, b) pristine TiO2 nanocomposites and (c, d) hydrogenated anatase/rutile composite nanocrystals with 60 wt% rutile content.

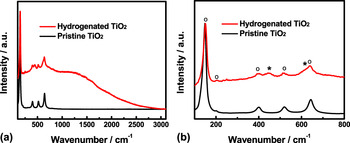
The existence of a disordered phase in the hydrogenated TiO2 nanocrystals was confirmed with the Raman results. The pristine TiO2 nanocrystals displayed strong and sharp Raman peaks at 144, 399, 519, and 644 cm−1 and a near-zero background as shown in Figs. 4(a) and 4(b). These peaks were attributed to the lattice vibrations in crystalline anatase phase. Anatase TiO2 has 15 optical modes with irreducible representations 1A 1g + lA 2u + 2B 1g + lB 2u + 3E g + 2E u . Reference Chen, Liu, Yu and Mao10,Reference Zhang, Harris, Wallenmayer, Murowchick and Chen40 The modes A 1g , B 1g , and E g are Raman active and commonly observed for crystalline anatase phase. Reference Chen, Liu, Yu and Mao10,Reference Xia, Li, Zhang, Kruger, Murowchick, Selloni and Chen41 The modes E g (639 cm−1), B 1g (519 cm−1), and A 1g (513 cm−1) are Ti–O bond stretching vibrations, while the modes B 1g (399 cm−1), E g (197 cm−1), and E g (144 cm−1) are O–Ti–O bending type vibrations. Reference Xia, Li, Zhang, Kruger, Murowchick, Selloni and Chen41 In comparison, hydrogenated TiO2 anatase/rutile composite nanocrystals with 60 wt% rutile had weaker anatase peaks, two weak additional peaks around 445 and 610 cm−1 and a large luminescent background in their Raman spectrum. The two additional peaks around 445 and 610 cm−1 were from the rutile phase. Rutile has 15 optical modes with the irreducible representation 1A 1g + 1A 2g + 1A 2u + 1B 1g + 1B 2g + 2B 1u + 1E g + 3E u . Reference Zhang, Harris, Wallenmayer, Murowchick and Chen40 The modes B 1g , E g , A 1g , and B 2g are Raman active and all consist of motions of anions with respect to stationary central cations, either perpendicular to the c axis (modes B 1g , A 1g , and B 2g ) or along the c axis (mode E g ). Reference Zhang, Harris, Wallenmayer, Murowchick and Chen40 Four vibrational modes were typically observed for rutile TiO2 around: 145 cm−1 – B 1g , 445 cm−1 – E g , 610 cm−1 – A 1g , and 240 cm−1 for the second-order effect. The large luminescent background indicated that there existed disordered phase in the hydrogenated TiO2 nanocomposites. Reference Xia, Zhang, Oyler and Chen28
Raman spectra of the pristine and hydrogenated TiO2 nanocrystals with 60 wt% rutile phase. (a) Raman survey from 100 to 3100 cm−1; (b) enlarged Raman spectrum in the range of 100–800 cm−1. The (o) and (*) denote the anatase and rutile phases, respectively.

These observations suggested that the hydrogenated TiO2 nanocrystals likely had a crystalline/amorphous core/shell structure, and the crystalline core had anatase or rutile or both phases, depending on the percentage of the rutile phase in the nanocomposites. Thus, a mixture of phases of anatase, rutile, and disordered structure was for hydrogenated TiO2 nanocrystals with a rutile content. As these nanocrystals were aggregated with each other, there were many grain and phase boundaries, disorders, and other crystal defects in the hydrogenated TiO2 nanocomposites. Rutile, anatase TiO2, and disordered phases (most likely hydrogenated Reference Chen, Liu, Yu and Mao10,Reference Xia and Chen14 ) have different electronic band structures and dielectric constants. Charge transfers and accumulation are expected in these places and interfacial polarization is resulted. Reference Xia, Zhang, Oyler and Chen28,Reference Yu and Cardona29 The nanoscale integration of these phases in the hydrogenated TiO2 thus allows the local interfacial charge accumulation and polarization between these different phases. Thus, tunable microwave absorption is expected from the CIPAMA effect in the hydrogenated TiO2 nanocrystalline composites by adjusting the anatase/rutile and crystalline/amorphous structural properties. In contrast, in the pristine pure anatase phase TiO2, as the electronic structure was the same for different grains of the anatase phase, the interfacial charge accumulation and polarization effects are believed to be small in the grain boundaries, leading to less obvious improvement.
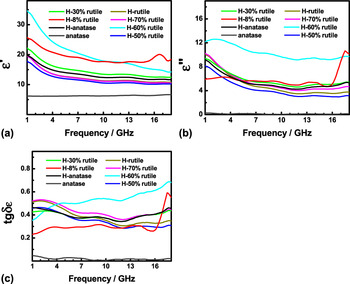
The microwave absorption properties are evaluated with the complex permittivity and permeability values: The real parts, ε′ and μ′, are related to the stored electric and magnetic field energy within the medium, whereas the imaginary parts, ε″ and μ″, are related to the dissipation (or loss) of electrical and magnetic energy, and their ratios, the dielectric and magnetic dissipation factors, tgδε = ε″/ε′ and tgδμ = μ″/μ′, provide a measure of how much power is lost in a material versus how much is stored. Reference Zhao, Li and Shen23,Reference Xia, Zhang, Oyler and Chen28 Microwave absorption measurements were carried out on hydrogenated TiO2 nanocrystals with various anatase/rutile compositions, in comparison to pristine TiO2 nanocrystals with similar anatase/rutile compositions. The nanocrystals were dispersed in molten paraffin wax, and the mixture was cast into a ring for the microwave absorption measurements. Reference Zhao, Li and Shen23,Reference Xia, Zhang, Oyler and Chen28 Figure 5(A) shows the frequency profiles of the real part ε′ of the complex permittivity in the microwave region of 1–18 GHz of hydrogenated TiO2 nanocrystals with various rutile percentages in comparison to that of the pristine anatase TiO2 nanocrystals. The anatase TiO2 nanocrystals/epoxy composites displayed relatively constant values of 6.1–6.5 for ε′ in the frequency range of 1.0–18.0 GHz, whereas the hydrogenated TiO2 nanocrystals/epoxy composites showed much higher ε′ values in the range of 10.22–34.65, depending on the microwave frequency and their anatase/rutile compositions. The ε′ values of all the hydrogenated TiO2 nanocomposites decreased with the increase in the microwave frequency. Among the hydrogenated TiO2 nanocrystals being investigated in this study, the hydrogenated TiO2 nanocrystals with 8 wt% and 60 wt% rutile displayed the highest ε′ values.
The frequency profiles of (A) the real part (ε′), (B) the imaginary part (ε″), and (C) the electrical dissipation factor (tgδε) of the complex permittivity in the microwave region of 1–18 GHz of pristine anatase and hydrogenated TiO2 nanocrystals with various rutile percentages. (a) H-anatase (0% rutile), (b) H-8% rutile, (c) H-30% rutile, (d) H-50% rutile, (e) H-60% rutile, (f) H-70% rutile, (g) H-rutile (100% rutile).

The frequency profiles of the imaginary part ε″ of the complex permittivity in the microwave region of 1–18 GHz are shown in Fig. 5(B). TiO2 nanocrystals/epoxy composites showed relatively constant ε″ values of 0.03–0.3, in the frequency range of 1.0–18.0 GHz, but hydrogenated TiO2 nanocrystals/epoxy composites had much higher ε″ values in the range of 3.00–12.59 in the same frequency range, depending on the microwave frequency and their anatase/rutile compositions. Among the hydrogenated TiO2 nanocrystals being investigated in this study, the hydrogenated TiO2 nanocrystals with 60 wt% rutile displayed the highest ε″ values in the range of 9.18–12.59. Figure 5(C) shows the frequency profiles of the dielectric dissipation factor tgδε in the microwave region of 1–18 GHz. TiO2 nanocrystals/epoxy composites showed relatively constant tgδε values of 0.0048–0.047, but hydrogenated TiO2 nanocrystals/epoxy composites had much higher tgδε values in the range of 0.229–0.687 in the same frequency range, depending on the microwave frequency and their anatase/rutile compositions. Among the hydrogenated TiO2 nanocrystals being investigated in this study, the hydrogenated TiO2 nanocrystals with 60 wt% rutile displayed the highest tgδε values in the range of 0.351–0.687, which increased with the increase in the microwave frequency.
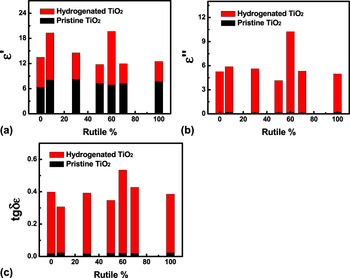
As the hydrogenated TiO2 nanocrystals were an agglomeration of crystalline anatase/rutile phases covered with a disordered phase, both interfacial polarizations at the anatase/rutile and crystalline/disordered interfaces can contribute to the proposed CIPAMA for the enhanced microwave performance. To find out their contributions, we further compared the microwave absorption performance of hydrogenated and pristine TiO2 nanocrystals with similar anatase/rutile ratios. The averaged values of the complex permittivity across the frequency range 1–18 GHz of hydrogenated TiO2 nanocrystals with a series of rutile percentages are shown in Fig. 6, in comparison to those of pristine TiO2 nanocrystals with similar rutile percentages. The complex permittivity frequency profiles of pristine anatase/rutile nanocomposites in the frequency range of 1–18 GHz are shown in Fig. S1. The permittivity ε′, ε″, and tgδε values changed as the anatase/rutile composition changed for both pristine and hydrogenated TiO2 nanocrystals. The averaged real part of permittivity ε′ values across the frequency range of 1–18 GHz was in the range of 11.76–19.66 for hydrogenated TiO2 nanocrystals, depending on their anatase/rutile compositions [Fig. 6(a)]. Hydrogenated TiO2 composites with 60 wt% rutile had the highest ε′ value of 19.66. The averaged real part of permittivity ε′ values across the frequency range of 1–18 GHz was in the range of 6.31–8.25 for pristine TiO2 nanocrystals. Pristine anatase/rutile TiO2 composite with 30 wt% rutile had the highest averaged ε′ value of 8.25 across the frequency range of 1–18 GHz. Thus, the averaged ε′ values of pristine anatase/rutile TiO2 composites accounted for 35−62% of that of the hydrogenated TiO2 at similar anatase/rutile compositions. As the change in the averaged ε′ value of pristine anatase/rutile TiO2 composites matches roughly well with the total SSA change of the anatase and rutile phases (Fig. S2), this contribution was likely from the charge accumulation and polarization at the crystalline anatase/rutile interfaces. The remaining 38−65% contribution in the hydrogenated TiO2 nanocrystals could thus be attributed to the crystalline/disordered interfaces. The real part of permittivity ε′ values is related to the stored electric field energy. Therefore, both the anatase/rutile and crystalline/disordered interfaces played important roles in storing the electromagnetic radiation within the materials.
Comparison of the averaged values of (a) the real part (ε′), (b) the imaginary part (ε″), and (c) the electrical dissipation factor (tgδε) of the complex permittivity in the microwave region of 1–18 GHz of pristine and hydrogenated anatase/rutile composite TiO2 nanocrystals with a series of rutile percentages.

A value in the range of 4.14–10.23 for the averaged imaginary part of permittivity ε″ value across the frequency range of 1–18 GHz was obtained for hydrogenated TiO2 nanocrystals, depending on the anatase/rutile percentages [Fig. 6(b)]. Hydrogenated TiO2 composites with 60 wt% rutile had the highest ε″ value of 10.23. The averaged imaginary part of permittivity ε″ values across the frequency range of 1–18 GHz was in the range of 0.12–0.18 for pristine TiO2 nanocrystals with various anatase/rutile compositions. The ε″ values of pristine anatase/rutile TiO2 composites were <5% of those of hydrogenated TiO2 composites with similar anatase/rutile ratios. The imaginary part of permittivity ε″ is related to the dissipation (or loss) of electric field energy of microwave radiation. Thus, the hydrogenated crystalline/disordered interfaces played a dominating role in dissipating the electric field energy within the materials, given the enhanced microwave absorption of hydrogenated TiO2 nanocrystals comes from the CIPAMA effect at the anatase/rutile interface and the crystalline/disordered interface.
A value in the range of 0.31–0.53 for the averaged dielectric dissipation factor tgδε value across the frequency range of 1–18 GHz was obtained for hydrogenated TiO2 nanocrystals, depending on their anatase/rutile compositions [Fig. 6(c)], compared to 0.018–0.023 for pristine anatase/rutile TiO2 nanocrystals with similar anatase/rutile compositions. The tgδε values of pristine anatase/rutile TiO2 composites were <7% of that of hydrogenated TiO2 composites. The dielectric dissipation factor tgδε tells how efficient the material dissipates the electric field energy into thermal energy to cause the loss of the microwave radiation. The tgδε values of the pristine anatase/rutile TiO2 composites were only very small portions of those of hydrogenated TiO2 composites with the same anatase/rutile compositions. This suggested that the hydrogenated crystalline/disordered interfaces were the main source to induce the CIPAMA effect in the hydrogenated TiO2, and cause the enhanced microwave absorption and the microwave attenuation and loss within the hydrogenated TiO2 nanocrystals.
On the other hand, hydrogenated TiO2 nanocrystals with various rutile contents showed comparable μ′, μ″, and tgδu values in the 1−18 GHz region to those of pristine TiO2 nanocrystals (Figs. S3 and S4). Thus, hydrogenation of TiO2 nanocrystals had very little influence on the magnetic part of the microwave electromagnetic field.
In a brief, by changing the anatase/rutile crystalline/amorphous structural properties, we thus obtained hydrogenated TiO2 nanocrystals of 60% rutile with the best microwave absorption performance. They displayed efficient capability in storing the electric field energy of microwave radiation. Their ε′ had an average value of 19.7, compared to an ε′ value of 6.3 for the pristine TiO2 nanocrystals/epoxy composites, about 4.3 fold increase after taking away the ε′ value around 2.5 of the epoxy matrix. Reference Zhao, Li and Shen23,Reference Xia, Zhang, Oyler and Chen28 Their ε″ value had an average value of 10.3, 103 times improvement over the ε″ value of 0.12 for the pristine TiO2 nanocrystals/epoxy composite. This suggests that hydrogenated TiO2 nanocrystals were highly efficient in dissipating the electromagnetic field. The dielectric dissipation factor tgδε of the hydrogenated TiO2 nanocrystals/epoxy composite had an average value of 0.52, compared to 0.018 of the pristine TiO2 nanocrystals/epoxy composite. This suggests that 52% of the microwave electrical energy is converted into heat by hydrogenated TiO2 nanocrystals, and hydrogenated TiO2 nanocrystals had a 29-fold efficiency increase over pristine TiO2 nanocrystals in dissipating the electrical energy of the microwave electromagnetic field. Permittivity ε′ values of up to 13, ε″ values of up to 6.4, and tgδε values of up to 0.4 averaged in the microwave range of 2–18 GHz have been typically reported for carbon nanotubes or Ni-coated, or Ag-filled carbon nanotubes, or other carbonaceous MAMs. Reference Zhao, Li and Shen23 Thus, hydrogenated TiO2 nanocrystals with ε′ values of up to 19.6, ε″ values of up to 10.23, and tgδε values of up to 0.53 displayed promising future as next generation of MAMs, and the large and tunable microwave absorption of hydrogenated TiO2 nanocrystals allows good flexibility for such new applications.
The microwave reflection loss (RL) curve can be calculated according to the following equations:
 $${Z_{{\rm{in}}}} = {Z_0}{\left( {{\mu _{\rm{r}}}{\varepsilon _{\rm{r}}}} \right)^{{1 \mathord{\left/ {\vphantom {1 2}} \right. \kern-\nulldelimiterspace} 2}}}\;\tanh \left[ {j\left( {{{2\pi fd} \mathord{\left/ {\vphantom {{2\pi fd} c}} \right. \kern-\nulldelimiterspace} c}} \right){{\left( {{\mu _{\rm{r}}}{\varepsilon _{\rm{r}}}} \right)}^{{1 \mathord{\left/ {\vphantom {1 2}} \right. \kern-\nulldelimiterspace} 2}}}} \right]\quad ,$$
 $${\rm{RL}}({\rm{dB}}) = 20\;\log \;|{{\left( {{Z_{{\rm{in}}}} - {Z_0}} \right)} \mathord{\left/ {\vphantom {{\left( {{Z_{{\rm{in}}}} - {Z_0}} \right)} {\left( {{Z_{{\rm{in}}}} + {Z_0}} \right)}}} \right. \kern-\nulldelimiterspace} {\left( {{Z_{{\rm{in}}}} + {Z_0}} \right)}}|\quad ,$$
 $${\rm{RL}}({\rm{dB}}) = 10\;{\log _{10}}\left( {{{{P_{\rm{i}}}} \mathord{\left/ {\vphantom {{{P_{\rm{i}}}} {{P_{\rm{r}}}}}} \right. \kern-\nulldelimiterspace} {{P_{\rm{r}}}}}} \right)\quad ,$$
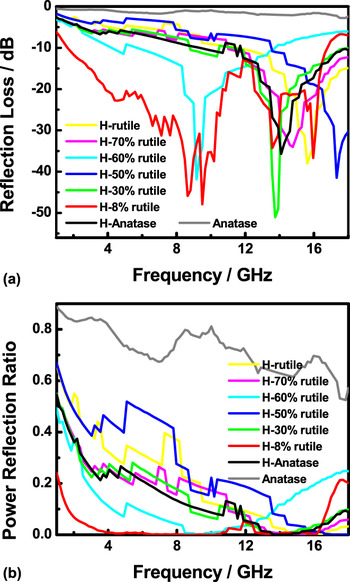
where f is the frequency of the electromagnetic wave, d the thickness of the absorber, c the velocity of light, Z 0 the impedance of free space, Z in the input impedance of the absorber, RL (dB) is the RL in dB, P i is the incident power, and P r is the reflected power. Reference Matsumoto and Miyata42 According to Eqs. (2) and (3), the simulations of the RL of the pristine and hydrogenated TiO2 nanoparticles with a thickness of 3.0 mm are shown in Fig. 7(a). Apparently, all the hydrogenated TiO2 nanoparticles had stronger microwave absorption property than pristine TiO2 nanoparticles. A material with a RL value less than −30 is regarded as an excellent absorber. As all the hydrogenated TiO2 nanoparticles displayed RL peak values of more negative than −30, they are all excellent microwave absorbers. The frequency regions of the RL peaks of the hydrogenated TiO2 nanoparticles apparently depended on their structural characteristics, demonstrating the tunable microwave absorption performance of the hydrogenated TiO2 nanoparticles. The power reflection ratio (P r /P i) describes the amount of microwave being reflected back. The higher the number, the more reflected, and the less absorbed. Figure 7(a) shows the simulations of the power reflection ratio of the pristine and hydrogenated TiO2 nanoparticles. Apparently, pristine TiO2 nanoparticles did not display much microwave absorption, while all the hydrogenated TiO2 nanoparticles had 99.9% RL in certain microwave frequency ranges, demonstrating their high absorbing capability. Among the hydrogenated TiO2 nanoparticles, the one with 8% of rutile displayed the best performance: a broadband absorption with RL larger than 99.9% across 80% of the frequency range of 4–16 GHz. Thus, it is reasonable to believe further tuning of the fabrication conditions and thus the microstructural characteristics could lead to a complete RL across the whole microwave range of 1–18 GHz.
Calculated (a) RL and (b) power reflection ratio of pristine and hydrogenated TiO2 nanocrystals with various rutile compositions.

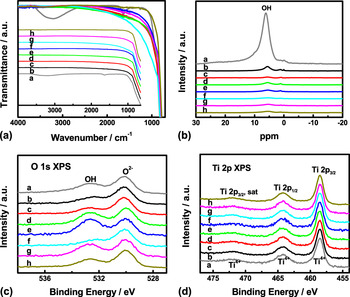
Based on systematic FTIR, NMR, XPS, and ESR studies of all the hydrogenated TiO2 nanocrystals with various rutile contents and pristine TiO2 nanocrystals, we found that traditional dipole rotation or ferromagnetic resonance mechanism had little contribution to the enhanced microwave absorption of the hydrogenated TiO2 nanocrystals, consistent with our previous report. Reference Xia, Zhang, Oyler and Chen28 First, the ferromagnetic resonance mechanism contributed little to the improved microwave absorption performance of hydrogenated TiO2, as both pristine and hydrogenated TiO2 nanocrystals had poor and similar permeability values (Figs. S3 and S4). Second, OH polar groups do make apparent contributions. Pristine TiO2 nanocrystals had strong OH bands in their FTIR spectrum [Fig. 8(A)]. The band around 1640 cm−1 is the O–H bending from molecularly physisorbed water and the band around 3250 cm−1 is the O–H stretching from chemisorbed water and the surface hydroxyl groups. Reference Xia, Zhang, Oyler and Chen28,Reference Li, Li, Boerio-Goates and Woodfield43 However, no OH absorption bands were seen in the FTIR spectra of hydrogenated TiO2 nanocrystals, compared to the obvious OH bands in the pristine TiO2 nanocrystals. We further investigated the OH in the hydrogenated and pure TiO2 nanocrystals with NMR. Spectra were acquired of the samples as well as an empty rotor to measure the hydrogen present. The contribution of the empty rotor was then subtracted to obtain the information from the samples which was further scaled by the mass of samples to give a quantitatively accurate spectrum. Pristine TiO2 nanocrystals had a relatively broad peak centered around 5.94 ppm, and 1–2 small, but narrow, peaks around −0.15 ppm [Fig. 8(B)]. Neither peak exhibits spinning sidebands from the 8 kHz magic angle sample spinning (not visible in the spectrum) indicating that these hydrogen atoms are in a somewhat dynamic environment, Reference Jonsen44,Reference Spahr, Wen, Stavola, Boatner, Feldman, Tolk and Lüpke45 while the breadth of the large peak at 5.9 ppm indicates a significant amount of heterogeneity in the local environment. Compared with the obvious large and broad OH peak in the pristine TiO2 nanocrystals, barely seen OH peaks were observed from the 1H NMR results of hydrogenated TiO2 nanocrystals [Fig. 8(B)]. The enlarged NMR results in Fig. S5 showed that hydrogenated TiO2 nanocrystals with better microwave absorption performance (with 8 and 60 wt% rutile) had lower OH contents.
(A) FTIR, (B) 1H NMR, (C) O 1s XPS, and (D) Ti 2p XPS spectra of (a) pristine and hydrogenated TiO2 nanocrystals: (b) H-anatase (0% rutile), (c) H-8% rutile, (d) H-30% rutile, (e) H-50% rutile, (f) H-60% rutile, (g) H-70% rutile, (h) H-rutile (100% rutile).

We further examined the chemical and bonding properties with XPS. All the pure and hydrogenated TiO2 nanocrystals showed in the O 1s core-level XPS spectra [Fig. 8(C)] one major peak centering at 530.0 eV due to the O2− ions in the TiO2 lattice, and one minor peak centering at 532.5 eV, attributed to the Ti–OH species on the surface and in the bulk. Reference Choi, Termin and Hoffmann11 Although sometimes larger surface OH signals were seen in O 1s XPS spectra for hydrogenated TiO2 nanocrystals with some anatase/rutile ratios, better microwave absorption was obtained in hydrogenated TiO2 nanocrystals with less surface OH signal [8% and 60% rutile in Fig. 8(C)]. All the samples showed similar features of Ti4+ ions in the TiO2 lattice based on the almost identical Ti 2p XPS spectra with peaks centering at 458.7 eV, 464.3 eV, and 472.2 eV due to the Ti 2p 3/2, Ti 2p 1/2, and the satellite peak of Ti 2p 3/2, respectively [Fig. 8(D)]. Reference Chen, Liu, Yu and Mao10,Reference Xia, Zhang, Oyler and Chen28 In addition, the C 1s [Fig. S6(A)] and XPS survey [Fig. S6(B)] spectra showed almost similar patterns for hydrogenated and pristine TiO2 nanocrystals. Third, oxygen vacancy or Ti3+ does not seem to play a role here. As XPS is a surface-probe technique with the information depth of 1–2 nm, we further used ESR to see if Ti3+ was responsible for the microwave absorption. Oxygen vacancy in TiO2 nanocrystals normally shows an ESR signal at g = 2.004, Reference Bityurin, Kuznetsov and Kanaev46,Reference Komaguchi, Maruoka, Nakano, Imae, Ooyama and Harima47 and Ti3+ defects at g = 1.96–1.98. Reference Zuo, Wang, Wu, Zhang, Borchardt and Feng48 No observable signals of Ti3+ or oxygen vacancy were seen for hydrogenated and pristine TiO2 nanocrystals from ESR measurements (Fig. S7). Thus, the contributions of dipole rotations (from OH, Ti3+, and oxygen vacancy) were very small to the enhanced microwave absorption of hydrogenated TiO2 nanocrystals, if any. The excellent microwave absorption of the hydrogenated TiO2 nanocrystals was most likely from the proposed CMID mechanism at the hydrogenated disordered/anatase/rutile interfaces. Although there is no direct physical evidence of the interface effects of the CMID mechanism, the CMID as a hypothesis at this point has successfully explained the origin of the enhanced microwave absorption of the hydrogenated TiO2 nanoparticles. This new mechanism thus opens a new avenue for developing next generations of excellent MAMs.
IV. CONCLUSION
In summary, we have shown that excellent and tunable microwave absorption has been achieved in hydrogenated TiO2 nanocrystals by tuning the anatase/rutile crystalline/amorphous composition. High-temperature hydrogenation of pristine TiO2 nanocrystals can lead to both phase transition and disordering of the crystal structure. Nanoscale integration of anatase/rutile crystalline/amorphous structures causes enhanced interfacial polarization along their grain boundaries due to the difference in their electronic structures. The CMIDs lead to improved microwave absorption. The anatase/rutile and crystalline/amorphous interfaces both contribute to the improved absorption of the electric field energy in the microwave radiation, and the crystalline/amorphous interfaces play key roles in dissipating the electric field energy. Contribution of traditional dipole rotation or ferromagnetic resonance mechanisms to the enhanced microwave absorption of the hydrogenated TiO2 nanocrystals was minimal due to the lack of oxygen vacancy, Ti3+ defects, and largely reduced OH contents. The excellent microwave absorption of the hydrogenated TiO2 nanocrystals was most reasonably from the proposed CMID mechanism at the hydrogenated disordered/anatase/rutile interfaces. Although there is still no direct physical evidence of the interface effects of the CMID mechanism, the CMID as a hypothesis at this point successfully explains the origin of the enhanced microwave absorption of the hydrogenated TiO2 nanoparticles. This study thus opens new applications for TiO2 nanocrystals toward by hydrogenation and may inspire similar studies in other materials.
Supplementary Material
To view supplementary material for this article, please visit http://dx.doi.org/jmr.2014.227.
ACKNOWLEDGMENT
X. Chen acknowledges the support of this research from the College of Arts and Sciences, University of Missouri – Kansas City (UMKC), University of Missouri Research Board and a generous gift from Dow Kokam. X. Chen also thanks Mr. James White from Active Spectrum, Inc., and Professor Thomas C. Sandreczki of the Department of Chemistry, UMKC for the helpful discussion on and help with the measurement of the ESR spectra.