I. INTRODUCTION
Since the breakthrough work was done by GrätzelReference O’Regan and Grätzel1–Reference Grätzel4 in 1991, regenerative dye-sensitized solar cells (DSSCs) have attracted intensive attention, because they possess excellent photoelectrical conversion efficiency (η). The DSSC’s working principle is based on the electron injection from the excited state of the sensitizer into the conduction band of the semiconductor photoelectrode, a suitable redox shuttle is needed to reduce the oxidized dye, and diffusion of the oxidized form of the shuttle to the counter electrode completes the circuit.Reference Haque, Palomares, Cho, Green, Hirata, Klug and Durrant5–Reference Qin, Wenger, Xu, Gao, Jing, Wang, Zakeeruddin and Grätzel8 It has been established that there are a number of factors determining the overall conversion efficiency. Among them, the structural and physical properties of the nanocrystalline semiconductor oxide are predominant.Reference Grätzel9
Anatase TiO2 nanoparticle (NP) film is an excellent starting photoelectrode for DSSCs due to its easy fabrication, minimal cost, and controllable over light scattering.Reference Peter10, Reference Sodergren, Hagfeldt, Olsson and Lindquist11 However, the primary weakness of the small electron diffusion coefficient limits the random walk of electrons through the NP film to the millisecond timescale.Reference O’Regan, Bakker, Kroeze, Smit, Sommeling and Durrant12 Recently, one-dimensional (1D) semiconductor photoelectrodes have been becoming research focus because of their merit of accelerated electron transport.Reference Baxter and Aydil13–Reference De Marco, Manca, Giannuzzi, Malara, Melcarne, Ciccarella, Zama, Cingolani and Gigli15 Yang et al.Reference Law, Greene, Johnson, Saykally and Yang16 demonstrated that 1D nanowire (NW) photoelectrodes had faster electron transfer than TiO2 or ZnO NP films in operating cells (several hundred times). Several works based on 1D ZnO photoelectrodes have been developed.Reference Ho, Hsiao, Lin, Chen, Wang and Lin17–Reference Cheng, Chiu, Lee, Tsai and Hsieh19 However, compared to NP DSSCs, the lower η has been obtained because the lower surface area of 1D photoelectrode materials results in the low dye adsorption.Reference Lei, Zhao, Liu, Zhang, Tong and Cao20
Therefore, the 1D nanomaterial/NP composite can be an ideal structure for the fabrication of DSSC photoelectrode. The NPs can provide high surface area for the dye adsorption, while the 1D nanomaterials can enhance the photogenerated electron transport. So far, there have been several investigations on this system, including TiO2 NW/NP and ZnO NW/NP composite solar cells.Reference Tan and Wu21–Reference Chen, Qiu and Yang23 These researches showed that the improved η could be achieved after the 1D NWs were incorporated with NPs. And 1D ZnO NWs are the research focus for the DSSC photoelectrode. To obtain high η of DSSCs and specify the effects of different 1D ZnO nanostructures on η, it is necessary to fabricate different 1D ZnO nanostructure/TiO2NP composite photoelectrodes.
In this paper, the 1D ZnO nanoneedles (NNs) have been synthesized via facile liquid growth method. The ZnO NN/TiO2 NP composite photoelectrodes have been used to fabricate DSSCs. And the enhanced photoelectrical conversion efficiency was achieved by rational tuning the weight ratio of ZnO NNs and TiO2NPs. The DSSC based on composite photoelectrode with 1 wt% ZnO NNs exhibits the highest conversion efficiency, which is higher than that of conventional P25 nanoparticulate DSSCs under the same conditions. This is because it has the fastest interfacial charge transfer, which is proved by the electrochemical impedance spectra (EIS).
II. EXPERIMENTAL DETAILS
The ZnO NNs have been synthesized via a facile liquid growth method. First, 10 mL of 1 M Zn(CH3COO)2analytical reagent (AR) solution was added into 30 mL of 4 M NaOH aqueous solution under vigorous stirring at room temperature. Then, 6 mL of 0.2 M dodecyl sulfonic acid sodium was added in the above aqueous solution. After heated at 85 °C for 4 h under vigorous stirring, the product was recovered by centrifugation and washed with ultrapure water and ethanol several times until pH value reaches 7. Finally, this product was annealed at 40 °C for 5 h to obtain the powder.
Five pastes, which were homogeneously mixing ZnO NNs and TiO2 NPs into 2 mL TiO2 colloid, were prepared with NN/NP weight ratio of 0%, 1%, 2%, 5%, and 100%. Colloidal TiO2 was prepared according to the literature.Reference Liu, Pan, Zhang, Jia, Lv, Wang, Bai and Li24 The transparent conducting TCO (F-doped SnO2layer, 20 Ω/square, Nippon sheet glass, Tokyo, Japan) is used as received for electrode substrate. A doctor blade technique was used to fabricate the photoelectrodes on a TCO substrate. A thin film was obtained using a glass rod to scrape off the excessive paste. After air dried for 30 min, they were sintered at 450 °C (ramping rate 1 °C) for 30 min. The obtained photoelectrodes with different weight ratios of 0%, 1%, 2%, 5%, and 100% were labeled as E1, E2, E3, E4, and E5, respectively. The thickness of composite film was estimated to be 5 μm as determined by scanning electron microscope (SEM) image. The composite photoelectrodes were immersed in 0.5 mM N719 dye solution for 12 h for dye adsorption, respectively.
The counter electrode was prepared according to the previous work.Reference Hagfeldt and Grätzel25 The dye-sensitized photoelectrode with Pt counter electrode were adhered together with epoxy resin. The space between the electrodes was filled with the electrolyte by capillary action. The fabricated DSSCs based on photoelectrodes of E1, E2, E3, E4, and E5 were labeled as C1, C2, C3, C4, and C5, respectively.
X-ray powder diffraction (XRD) patterns were obtained by a Rigaku D/max-IIIB diffractometer (Rigaku Company, Tokyo, Japan) using Cu Kα radiation (λ = 1.5406 Å). The transmission electron microscopy (TEM) experiment was performed on a JEM-3010 electron microscope (JEOL, Tokyo, Japan) with an acceleration voltage of 200 kV. Carbon-coated copper grids were used as the sample holders. SEM image was taken using a Hitachi S-4800 instrument (Hitachi Ltd., Tokyo, Japan) operating at 15 kV. The dye-sensitized photoelectrodes were desorbed in a 0.02 M NaOH solution in alcohol and H2O (volume ratio, 1:1) for 6 h to measure the adsorption dye amount. Photocurrent density–photovoltage curves were recorded by a BAS100B electrochemical analyzer (Bioanalytical Systems Inc., West Lafayette, IN). A 400 W xenon lamp with a ultraviolet (UV) filter was used as light source. Its illumination intensity was about 50 mW/cm2. The irradiation area of DSSCs was about 0.12 cm2. The EIS were performed with a computer-controlled IM6e Impedance measurement unit (Zahner Elektrik, Leipzig, Germany). EIS were obtained by applying sinusoidal perturbations of 10 mV over the V oc at the frequency range from 0.05 to 100 KHz. All EIS measurements were carried out under illumination of 10 mW/cm2. The obtained spectra were fitted with ZSimpWin software in terms of appropriate equivalent circuits.
III. RESULTS AND DISCUSSION
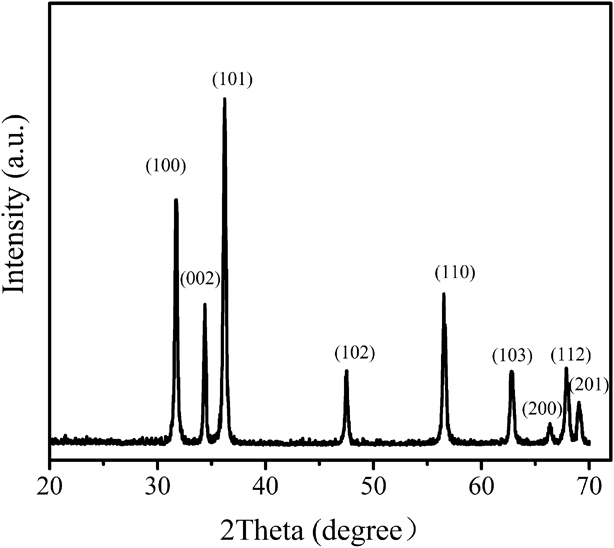
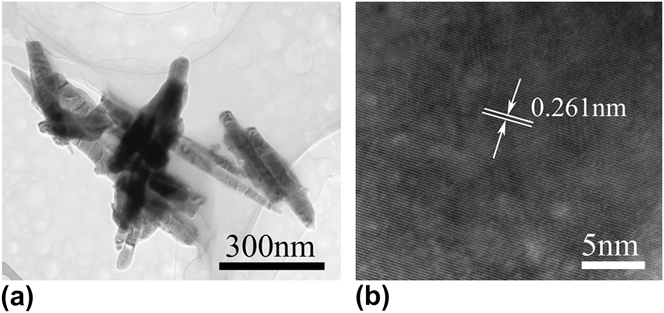
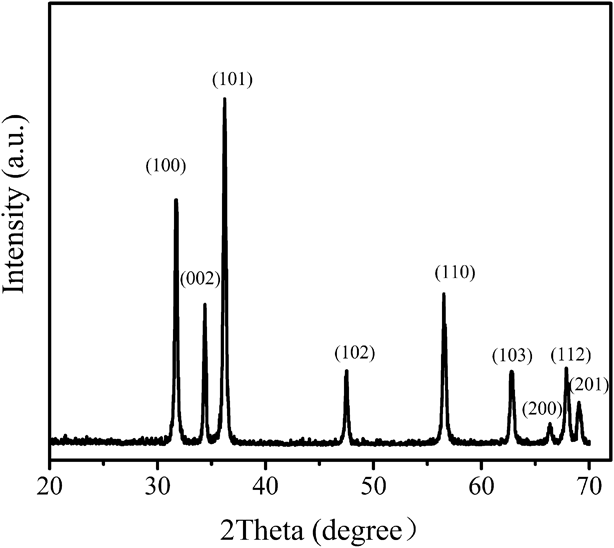
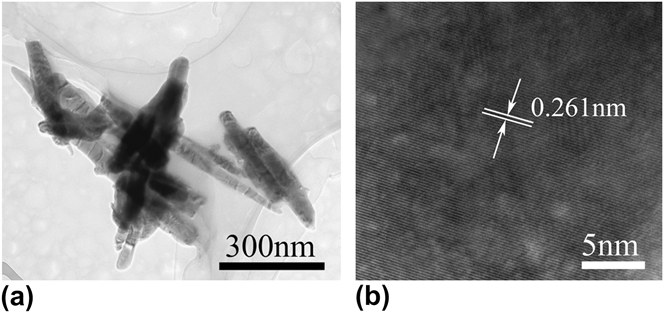
XRD pattern of 1D ZnO NNs is shown in Fig. 1. The sample exhibits characteristic peaks around 2θ = 31.7°, 34.2°, 36.2°, 47.5°, 56.6°, 62.8°, 66.3°, 68.0°, and 69.1°, which correspond to (100), (002), (101), (102), (110), (103), (200), (112), and (201) planes of wurtzite ZnO (JCPDS No. 36-1451), respectively. TEM images are used to analyze the synthesized 1D ZnO NNs to understand their morphological features. One can clearly see from low-resolution TEM image [Fig. 2(a)] that 1D ZnO NNs are typically 500–900 nm in length. And the diameter of NN tips and roots are 20–40 nm and 80–100 nm, respectively. Figure 2(b) shows the high-resolution transmission electron microscopy (HRTEM) image of the ZnO NNs. It can be clearly seen that ZnO NNs were highly crystalline, with lattice spacing of 0.262 nm, corresponding to the distance between the (002) planes of the wurtzite ZnO crystal lattice. This indicates that the ZnO NNs grow in the [0001] direction. More importantly, no crystal dislocations and defects are found from the HRTEM image, showing that the obtained ZnO NNs possess high crystalline quality. Thus, through a facile liquid growth route, 1D ZnO NNs with high crystalline have indeed been obtained.
XRD pattern of 1D ZnO NNs.
Low-resolution TEM image of (a) ZnO NN and HRTEM image of (b) ZnO NN.
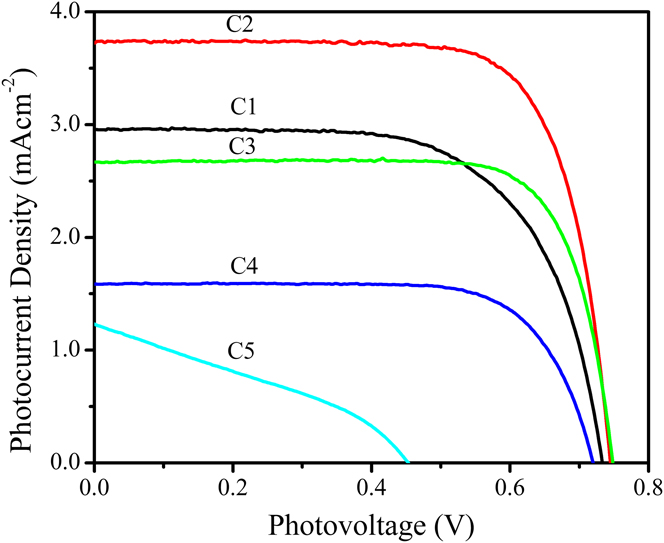
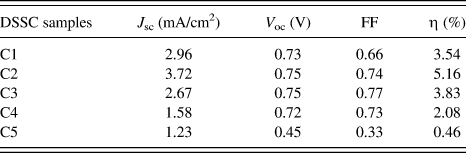
The 1D ZnO NN/TiO2 NP composite photoelectrodes could exhibit the merits of the two building blocks, i.e., the high surface area of TiO2 NPs and the rapid interfacial electron transport of 1D ZnO NNs. So, composite photoelectrodes with 1D ZnO NNs of different weight ratio have been fabricated to obtain the high η of DSSCs. The typical photocurrent density–photovoltage curves of C1, C2, C3, C4, and C5 are shown in Fig. 3. The film photoelectrodes share the same batch. Each value for cell performance was taken as an average of more than three samples. The values of open-circuit voltage (V oc), short-circuit current (J sc), fill factor (FF), and overall photoelectrical conversion efficiency (η), obtained from the curves, are summarized in Table I. The photoelectrical properties of the C2 and C3 with the suitable ZnO NNs amount of 1 and 2 wt% are higher than the control cells (C1). Especially, the V oc, J sc, and FF of C2 are 0.75 V, 3.72 mA/cm2, and 0.74, respectively. And C2 with the ZnO NNs amount of 1 wt% have the best photoelectrical conversion performance of 5.16%. But if the mixed ZnO NN amount increased to 2 and 5 wt%, respectively, the photoelectrical conversion efficiency decreased in proper sequence. After optimization of the ZnO NN/TiO2NP composite layer, the efficiency could be further improved.
The photocurrent density–photovoltage curves of C1, C2, C3, C4, and C5, respectively. (C1, DSSC based on the pure TiO2 NP photoelectrode; C2, DSSC based on photoelectrode with ZnO NN/TiO2 NP weight ratio of 1%; C3, DSSC based on photoelectrode with ZnO NN/TiO2 NP weight ratio of 2%; C4, DSSC based on photoelectrode with ZnO NN/TiO2NP weight ratio of 5%; C5, DSSC based on the pure ZnO NN photoelectrode.)

Solar cell parameters of C1, C2, C3, C4, and C5, respectively.
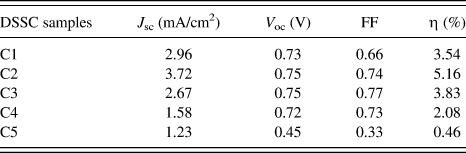
J sc, short-circuit photocurrent density; V oc, open-circuit photovoltage; FF, fill factor; η, the power conversion efficiency.
It is well known that dye adsorption and photoelectron transfer are the main parameters of the photoelectrode character, which determine the properties of DSSCs when the other components of DSSCs are the same. More dye adsorption and the faster photoelectron transfer eventually result in the high power photoelectrical conversion efficiency. In the following, the morphologies of composite photoelectrodes will be studied, which determine the dye adsorption amount. And the photoelectron transfer properties of DSSCs with composite photoelectrode are systematically studied with the EIS.
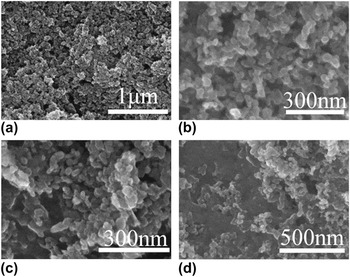
SEM images of E1, E2, E3, and E4 photoelectrodes are shown in Fig. 4. E1 (pure TiO2 NPs) is compact. Besides the void spaces between individual TiO2 NPs, there were little large void spaces [Fig. 4(a)]. After adding 1% ZnO NNs into the pure TiO2 NPs, E2 became less compact because small bundles of NNs embedded in TiO2 NPs [Fig. 4(b)]. The loose surface structure can be observed in E3 because of increased ZnO NN amount to 2 wt% [Fig. 4(c)]. Furthermore, E4 showed looser structure with large void spaces of several hundred nanometers in size due to the 5 wt% NN amount. The different surface structure of photoelectrodes results in different surface area, and the different dye adsorption amount is determined by the surface area. So, it can be speculated that the dye adsorption of N719-sensitized photoelectrode decreased with the increase of ZnO NN amount. This is also confirmed by the UV–Vis absorption spectra of desorption dye from N719-sensitized E1, E2, E3, E4, and E5, respectively. According to Beer–Lambert law, the molar concentration of dye loading from E1, E2, E3, E4, and E5 was 8.62, 8.31, 8.03, 7.75, and 2.12 × 10⁻⁶ mol/L, respectively.Reference Yanagida, Yamaguchi, Kurashige, Hara, Katoh, Sugihara and Arakawa26 More the adsorption dye, more the photoelectron can be generated, which will make higher photocurrents possible. E2 and E3 had relatively high dye adsorption, so it can generate more photoelectrons.
SEM images of (a) E1, (b) E2, (c) E3, and (d) E4, respectively. (E1, TiO2 NP photoelectrode; E2, photoelectrode with ZnO NN/TiO2 NP weight ratio of 1%; E3, photoelectrode with ZnO NN/TiO2 NP weight ratio of 2%; E4, photoelectrode with ZnO NN/TiO2NP weight ratio of 5%.)

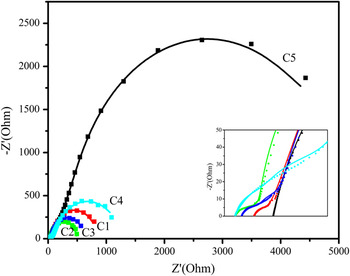
The EIS are one of the powerful methods to investigate internal resistances, which are indicators of charge transfer process of DSSCs. The wide frequency range of the EIS enables it to measure wide scale internal resistances of each electrochemical step at the same time. DSSC is a complex system composed of several interfaces. A high electron accumulation must be occurred because photogenerated electrons are not extracted at the electrode contact under illumination. Electron transport and recombination in photoelectrode, charge transfer reactions at Pt counter electrode, and the diffusion constant of I3− can all be studied by EIS.Reference Fabregat-Santiago, Bisquert, Palomares, Otero, Kuang, Zakeeruddin and Grätzel27 Usually, the impedance at low frequency (0.05–1 Hz) corresponds to the Nernst diffusion of I3−/I− within the electrolyte. The impedance at high frequency (1 K–100 K Hz) in the impedance spectra corresponds to the capacitance and charge transfer resistance at the Pt | I3−/I− electrolyte interface. The medium frequency response at 1–1 K Hz is associated with the photoelectrode–dye | I3−/I− electrolyte interface, where an accumulation of photoelectrons and redox shuttles are expected.Reference Longo, Nogueira, De Paoli and Cachet28 EIS are obtained by applying sinusoidal perturbations of 10 mV over the V oc. Figure 5 shows the Nyquist diagrams of the impedance spectra of C1, C2, C3, C4, and C5 under illumination of 10 mW/cm2. In general, the Nyquist diagram obtained under light intensity of 100 mW/cm2 exhibits three semicircles, which correspond to three frequency ranges. However, in this experiment, only the semicircles at middle and high frequencies were observed, associated with the dye-sensitized photoelectrode | I3−/I− electrolyte interface and the Pt | I3−/I−electrolyte interface resistance, respectively, The semicircle at low frequency region merges with the semicircle at the middle frequency region due to the weak light intensity.Reference Qu, Gao, Li, Jiang and Yan29
Nyquist diagrams of the impedance spectra obtained under illumination at intensity of 10 mW/cm2 for C1, C2, C3, C4, and C5, respectively. Inset is the amplified Nyquist diagrams of the impedance spectra at high frequency. Experimental data are represented by symbols and solid lines correspond to fits obtained with ZSimpWin software. (C1, DSSC based on the pure TiO2 NP photoelectrode; C2, DSSC based on photoelectrode with ZnO NN/TiO2 NP weight ratio of 1%; C3, DSSC based on photoelectrode with ZnO NN/TiO2 NP weight ratio of 2%; C4, DSSC based on photoelectrode with ZnO NN/TiO2NP weight ratio of 5%; C5, DSSC based on the pure ZnO NN photoelectrode.)

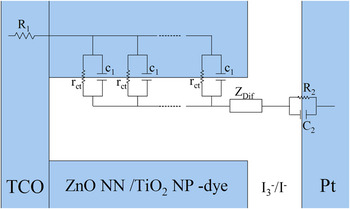
Many theoretical models are proposed to interpret the complex system of the DSSC under different conditions. The equivalent model fitting the impedance spectra of C1, C2, C3, C4, and C5 is shown in Fig. 6. The symbols R and C represent a resistance and a capacitance, respectively. R 1 is a series resistance standing for the transport resistance of the two TCO electrodes. If the thickness of the TiO2 film is L, the R ct (=r ct/L) represents the charge transfer resistance between composite film photoelectrode and I3− in electrolyte. C 1 (=c 1L) is the chemical capacitance of the composite film photoelectrode that accounts for the change of electron density as a function of the Fermi level. Z Dif represents the Warburg impedance relative to the Nernst diffusion of I3− in electrolyte. R 2 and C 2are the charge transfer resistance and double layer capacitance at the counter electrode, respectively.
Equivalent circuit used to represent interfaces in composite solar cells composed of TCO | ZnO NN/TiO2 NP–dye | I3−/I−| Pt | TCO.

The EIS data are obtained by fitting the impedance spectra of C1, C2, C3, C4, and C5 using the equivalent model of Fig. 6. The EIS data in this work are helpful for understanding all composite solar cells and also can explain well the existing interfaces in DSSCs. The R ct, representing interfacial resistance of the dye-sensitized composite photoelectrode | I3−/I−electrolyte interface, is 15.84 Ω for C1, 13.92 Ω for C2, 14.24 Ω for C3, 15.13 Ω for C4, and 161.5 Ω for C5. The less interface resistance will result in faster interfacial electron transfer, which favors the higher η. The interface resistances of C2 and C3 solar cells are lower than that of C1, so all these cells have higher interfacial electron transfer than C1. Because C2 and C3 had higher dye adsorption and less interfacial transfer resistance, higher η of these composite solar cells are achieved. Among them, C2 displays the fastest electron transfer rate and highest dye adsorption than other composite cells and, thus, the highest η. These results are in accordance with photoelectrical conversion efficiency data discussed above.
IV. CONCLUSIONS
The conversion efficiency of DSSCs was improved effectively by using ZnO NN/TiO2 NP composite photoelectrodes, which consisted of 1D ZnO NN as rapid electron transport layer and TiO2 nanoparticles as dye adsorption layer. It was demonstrated that the amount of ZnO NNs in the composite photoelectrode critically influenced the conversion efficiency of DSSCs. The cells based on the composite photoelectrodes with the ZnO NN amount of 1 wt% (C2) achieved the highest η of 5.16%, which was higher than that of C3 with ZnO NN amount of 2 wt% (3.83%) and the TiO2 NP cells (3.54%). Such an improved conversion efficiency of C2 DSSCs was ascribed to the higher dye adsorption and the fastest interfacial electron transfer (R ct= 13.92 Ω), as evidenced by the measurement of dye desorption and EIS.
ACKNOWLEDGMENTS
The National Natural Science Foundation of China (Grant No. 51072038), NECT, Outstanding Youth Foundation of Heilongjiang Province (Grant No. JC201008), Natural Science Foundation of Heilongjiang Province, China (Grant No. F200828), the Fundamental Research Fund of Harbin Engineering University (Grant No. HEUFT07056) have supported this work. We are grateful to Y. Qu and K. Pan for technical support and helpful discussion.