Introduction
A critical understanding of the thermodynamics and kinetics inherent to electrochemical reactions is necessary for scientific insights into charge transfer[Reference Kuznetsov1] as well as in applications ranging from biochemical reactions[Reference Savéant2] to charge storage in capacitors[Reference Yamada and Bandaru3, Reference Yamada and Bandaru4] and batteries.[Reference Linden and Reddy5] While the foundational attributes have almost always been reckoned in terms of one-electron-based charge transfer,[Reference Bard and Faulkner6, Reference Compton and Banks7] much of the theoretical and experimental analysis has only obliquely referred to the considerations of dimensionality. Consequently, three-dimensional (3D) electrode characteristics and classical thermodynamics have been implicitly assumed in heterogeneous electron transfer kinetics, encompassing the widely used Butler–Volmer (BV) formulations and the subsequent Marcus[Reference Marcus8, Reference Sutin9]–Hush[Reference Hush10] interpretations. In this regard, Arrhenius-based activation theory, leading to the BV approaches, has been used for over a century, and extensively documented in standard electrochemistry textbooks.[Reference Bard and Faulkner6] In the BV case, the rate constant (K BV), considering that for the forward reaction rate (K F) and for the backward reaction (K B), is
 $$\eqalign{K^{{\rm BV}} & = K_{\rm F} + K_{\rm B} \cr & = K^{\rm o}\;{\rm exp}\left[ {\displaystyle{{\alpha e\eta} \over {k_{\rm B}T}}} \right] + K^{\rm o}\;{\rm exp}\left[ { - \displaystyle{{(1 - \alpha )e\eta} \over {k_{\rm B}T}}} \right].}$$
In Eq. (1), α is the electron transfer coefficient and η refers to the overpotential (=V − V o), with V as the applied voltage and V o as the standard redox potential. The e is the elementary unit of electronic charge, k B is the Boltzmann constant, and T is the temperature. While simple to use, in principle, such an approach does not yield substantial insight into the type and involvement of the specific constituents (redox species as well as the electrode) and α is phenomenologically determined. The Marcus–Hush (MH) theory then seeks to better understand the rationale for K o and α through a more detailed consideration[Reference Henstridge, Laborda, Rees and Compton11] of the reorganization dynamics of the solvent and the redox species vis-à-vis the electrochemical reactions and the electrolyte (through the macroscopic dielectric constant).
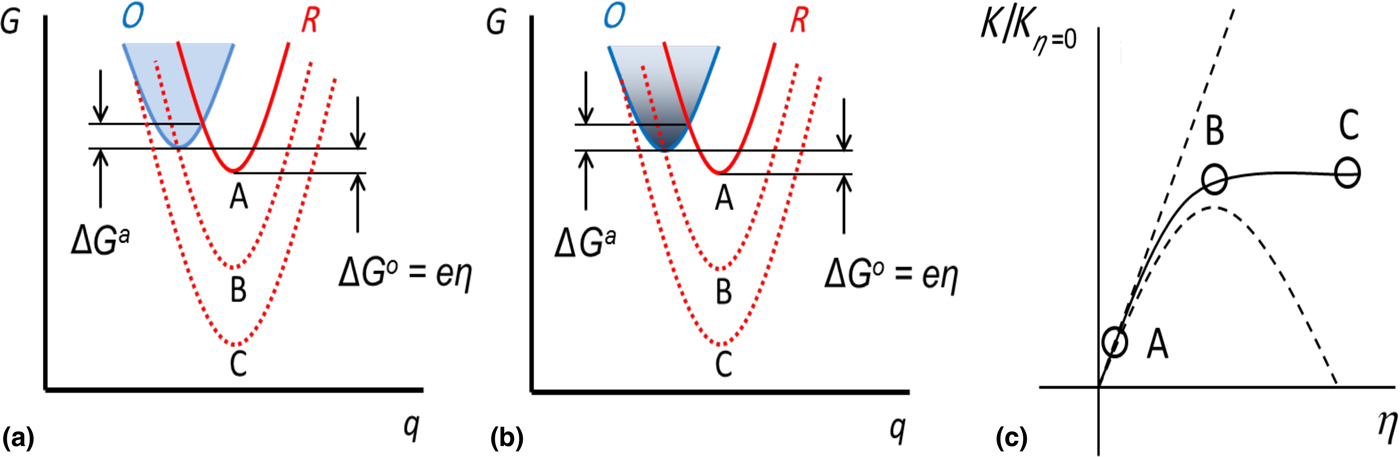
We first briefly review the salient features of the MH kinetics approach and its extension by Chidsey.[Reference Chidsey12] Consequently, we consider typical[Reference Marcus8, Reference Sutin9] free energy (G)—reaction coordinate (q) curves: Fig. 1. Typically, the reaction coordinate has been broadly interpreted, and may refer to the distance, in a multi-dimensional “extensive” variable sense (e.g., the change of bond length, electrical charge, etc.), between the oxidized (O) and reduced (R) species in an electrochemical redox reaction, of the type: O + e − ↔ R. While the progressive lowering of the minimum energy of the R parabola (e.g., through increasing the η) always decreases the free energy of reaction ΔG o, the free energy of activation ΔG a initially decreases, reaching zero when the R parabola passes through the minimum of the O parabola, and subsequently increases, due to a shift of the R free-energy curves to the left-hand side of the O parabola: Fig. 1(a). The concomitant increase and decrease of the electrochemical reaction rate constant K MH, i.e., as represented in Eq. (2), with v as the attempt frequency, reaches a maximum when ΔG a = 0.
 $$K^{{\rm MH}} = v\;{\rm exp}\left[ { - \displaystyle{{{\rm \Delta} G^{\rm a}} \over {k_{\rm B}T}}} \right] = v\;{\rm exp}\left[ { - \displaystyle{{{\left( {\lambda \mp e\eta} \right)}^2} \over {4\lambda k_{\rm B}T}}} \right]\;. $$
(a) Gibbs free energy (G)—reaction coordinate (q) curves for the oxidized (O) and reduced (R) species in an electrochemical redox reaction, of the type: O + e − H R. The free energy of reaction (ΔG o), and the free energy of activation (ΔG a) are indicated, for several applied voltages (η) and resulting R species configurations. (b) For low-dimensional structures, variation in the density of states (DOS) accessible for electron transfer, as in the lowering of the DOS for a one-dimensional system, would yield equivalent behavior. (c) The operating points corresponding to the various R curves in (i) and (ii) represented in the normalized rate constant (K/K η=0)− η plot.

Such a non-intuitive increase and subsequent decrease of the reaction rate with increasing driving force (i.e., η) constitutes the essence of the “inverted region”, particular to the MH theory. Such a notion on the maximum of a rate constant has been experimentally confirmed,[Reference Grampp13] e.g., in intramolecular reactions, concerning molecules with bridged donor–acceptor units.[Reference Miller, Calcaterra and Closs14] It may also be derived that[Reference Grampp13] ΔG a = (λ/4)(1 + (ΔG o/λ))2, with λ as the reorganization energy, which is related to the energy required for both the internal (e.g., due to the bond configuration changes) and the external (e.g., in the rearrangement of the solvation shell, surrounding electrolyte, etc.) configurational changes. Subsequently, it is evident that a zero ΔG a would imply that the peak of the K MH is at a value of λ~ − ΔG o.
However, such a theory seemed to be incompatible with the notion of long-distance interfacial electron transfer where the rate constant decreases exponentially with increased donor–acceptor separation distances[Reference Fletcher15, Reference Li and Weaver16] as considered through the seminal work of Chidsey.[Reference Chidsey12] Additionally, the experimental observation, in certain metal electrode based electrochemical ensembles, of the saturation of the electrochemical current with increasing η, prompted the consideration of a continuum of energy-level states. The consequently derived rate constant K MHC, considering energy level occupancy through the Fermi–Dirac distribution f FD, and the explicit introduction of a constant metallic electronic density of states (DOS) (=ρ), was of the form:[Reference Chidsey12]
 $$\eqalign{K^{{\rm MHC}} & = v(\rho k_{\rm B}T)\cr & \times \int_{ - \infty} ^\infty {\displaystyle{1 \over {1 + {\rm exp}(x)}}\;} {\rm exp}\left( { - \displaystyle{{k_{\rm B}T} \over {4\lambda}} {\left[ {x - \displaystyle{{\lambda \mp e\eta} \over {k_{\rm B}T}}\;} \right]}^2} \right){\rm d}x.}$$
The variable, x = (E − E F/k BT) refers to the normalized energy of a relevant participating level (E), e.g., in the electrode, relative to the Fermi energy (E F) and the negative sign is used for η > 0. The integration limits may be narrowed down to either the negative interval (−∞, 0) or the positive interval: [0, ∞], if f FD (E) can be approximated by a step function, which would be applicable when the η exceeds 26 mV (=k BT/e). The Marcus–Hush–Chidsey (MHC) relation, indicated in Eq. (3), may also be interpreted as related to the area of overlap between the f FD and an Arrhenius-based rate law. The relation seems to yield excellent agreement with the experimental observation of the rate constant, which tends to a constant value at larger electrode overpotential. It is to be noted that the rate constants, e.g., the K MHC are typically obtained through chronoamperometry (CA) experiments, through the electrical current I decay with time t (in response to a step-voltage change) of the form: I = I o exp(−K MHCt). However, even in such molecular systems, the Chidsey modification to the MH theory adopts an intrinsically continuum point of view, through assuming a constant ρ.
In this paper, through considering the DOS of the electrode to be a distribution over energy instead of a constant value, we broadly aim to extend the utility of the MHC kinetics to a larger class of materials and situations. While constant DOS can explain K − η trends for macroscale electrodes, the limited carrier density for nanoscale electrodes causes unexpected behavior for K at higher values of η. For instance, we observe in zero-dimensional (0D) or one-dimensional (1D) nanostructured electrodes, electrical current oscillations as a function of the η, corresponding to the gradual population (and de-population) of each successive sub-band. We posit that the consideration of a variable/non-constant DOS leads to a deeper appreciation of the MHC formulations and may yield tests of dimensional character and concomitant contribution to electrochemical systems. We specifically indicate the utility of our theory in explaining the electrochemical characteristics of single-layer graphene (SLG)-based electrodes—a unique prototype of a two-dimensional (2D) system.
Reinterpreting Marcus–Hush–Chidsey kinetics through a density of states perspective
First, we reinterpret the classical free energy—reaction coordinate curves depicted in Fig. 1(a) in the context of low-dimensional structures. The initial decrease in ΔG a followed by a subsequent increase, can be related by analogy to the availability and subsequent lack in the number of energy levels (related to the DOS) accessible for electron transfer. Such a modulation is apparent in the DOS of 1D nanostructures, with increasing carrier concentration and change of the E F, and may be induced through appropriate η. We have then observed that such non-constant DOS yields novel electrical current–voltage response in related electrochemical systems. Figure 1(b) indicates the correspondence for lower dimensional systems where the decreasing DOS at higher energy may be taken analogous to the increasing λ. Indeed, saturation of the electrical current/rate constant curves may be indicative of the limit of a finite DOS.
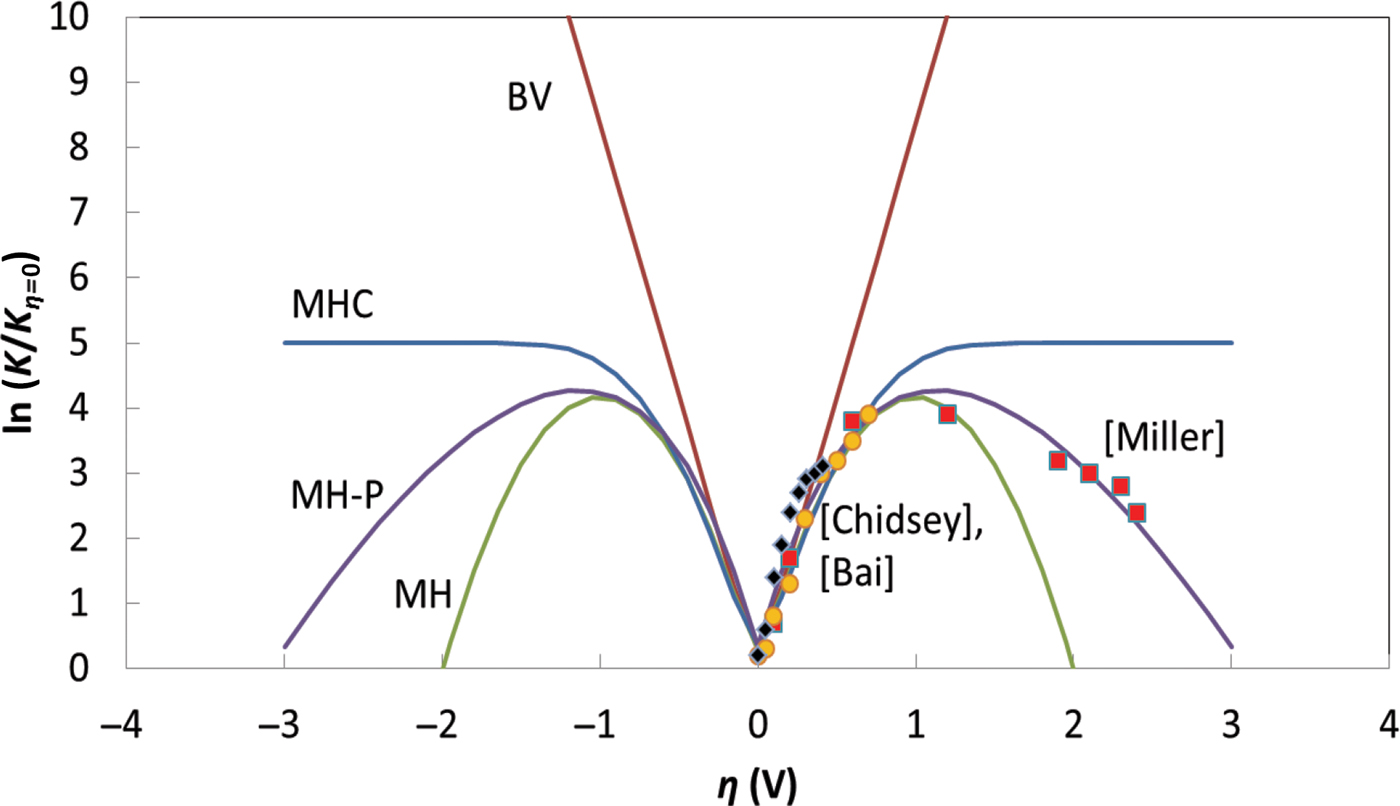
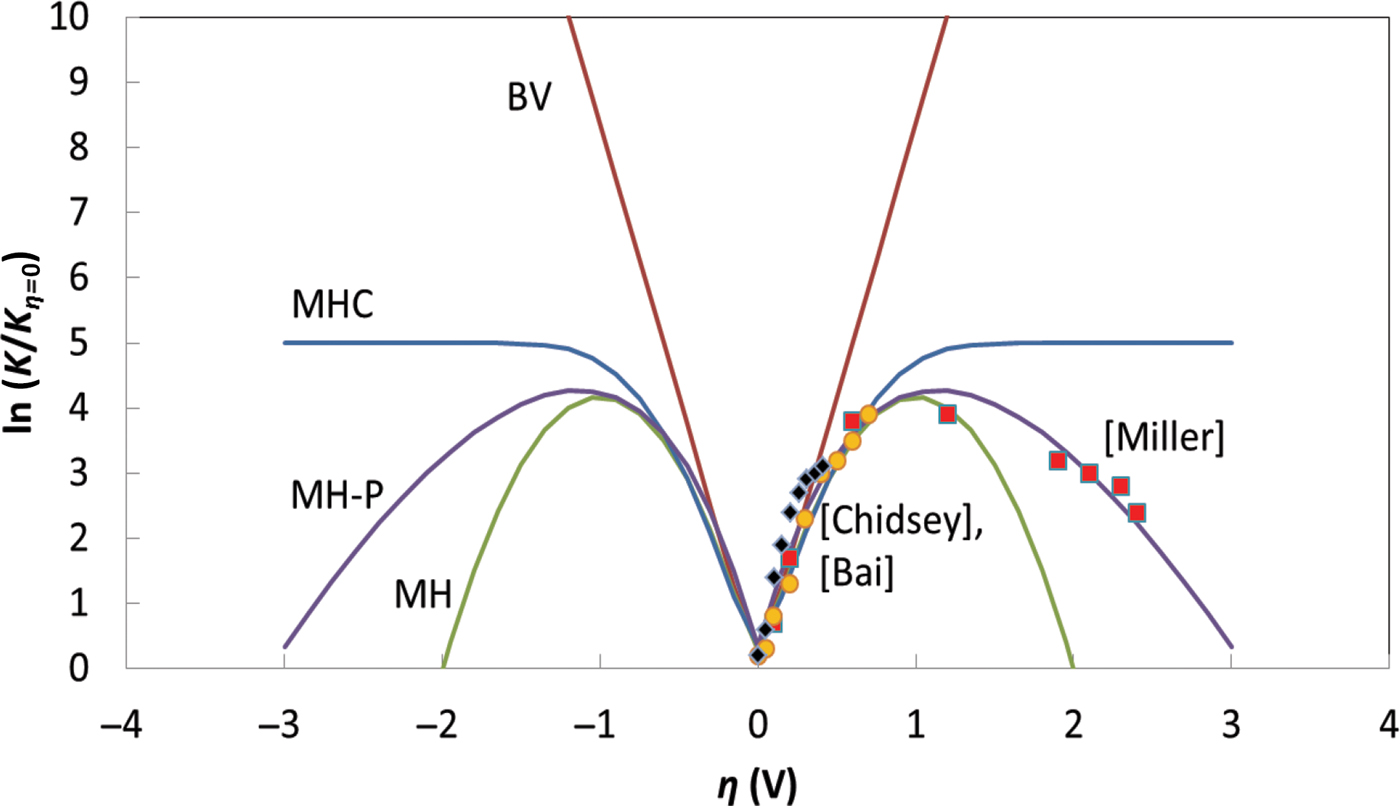
The consequent plots of the respective normalized K-value variation, through Eqs. (1)–(3), with the η (corresponding to BV, MH, or MHC kinetics) are indicated in Fig. 2. From CA-related experiments and I = I o exp (−K MHCt), such characteristics may be considered equivalent to electrical current: I − η plots. The figure also indicates a re-plotting of experimental data previously obtained, and were selected with the rationale that they represented three diverse situations, where nonlinear variation of the rate constant with η was observed, i.e., (1) an inverted region of the rate constant, per M–H kinetics: Miller et al.[Reference Miller, Calcaterra and Closs14]; (2) an initial linear variation followed by a saturation of the rate constant, marking the MHC mechanisms: Chidsey[Reference Chidsey12]; and (3) rate constant variation corresponding to electron transfer across solid–solid interfaces typical to carbon coated LixFePO4 crystals: Bai et al.[Reference Bai and Bazant17] It is to be noted that while the BV kinetics indicates a linear variation (on the semi-log plot) with η, the MH model exhibits a peak as a function of the η. It is also relevant to note that the experimental curves were also fit through employing Poisson statistics[Reference Miller, Beitz and Huddleston18] assuming homogeneous charge transfer, with a net λ (=1.2 eV) constituted from (i) an “external” solvation energy λ s = 0.75 eV, and (ii) an “internal” vibrational energy component λv = 0.45 eV. The incorporation of Poisson (cf., Gaussian distribution) statistics also yields an inversion of the K, while avoiding the steeper drop-off of the MH curve, and was considered[Reference Miller, Calcaterra and Closs14] the best fit to certain chronoamperometric data.
The variation of the normalized reaction rate constants, K, as a function of electrochemical kinetics, i.e., corresponding to Butler–Volmer: BV; Marcus–Hush: MH; Marcus–Hush-Poisson: MH-P; or Marcus–Hush–Chidsey: MHC; models—with the overpotential η. The K values have been normalized to their minimum values in each case. The experimental values were adapted from Miller et al.,[Reference Miller, Calcaterra and Closs14] Chidsey,[Reference Chidsey12] and Bai et al.[Reference Bai and Bazant17]
We now consider the influence of a variable DOS on the K variation with η. The number of electrons available for the redox reaction,  $n = \int_{E_{\rm C}}^\infty {\,f_{{\rm FD}}(E - E_{\rm F})\; {\rm DOS}\; \left( {E - E_{\rm C}} \right){\rm d}E} $, where E c is the energy at the bottom of the conduction band. We concomitantly introduce a new DOS-based reaction rate constant: K MHC–DOS, considering the influence of the energy levels, through:
 $$\eqalign{K^{{\rm MHC}{\rm - }{\rm DOS}} & = vk_{\rm B}T\mathop \int \limits_{ - \infty }^\infty \displaystyle{{DOS(\left \vert {x + (E_{\rm F} - E_{\rm C}/k_{\rm B}T)} \right \vert)} \over {1 + {\rm exp}(x)}} \cr & \quad \ {\rm exp}\left( { - \displaystyle{{k_{\rm B}T} \over {4\lambda }}{\left[ {x - \displaystyle{{\lambda \mp e\eta } \over {k_{\rm B}T}}\; } \right]}^2} \right){\rm d}x.} $$
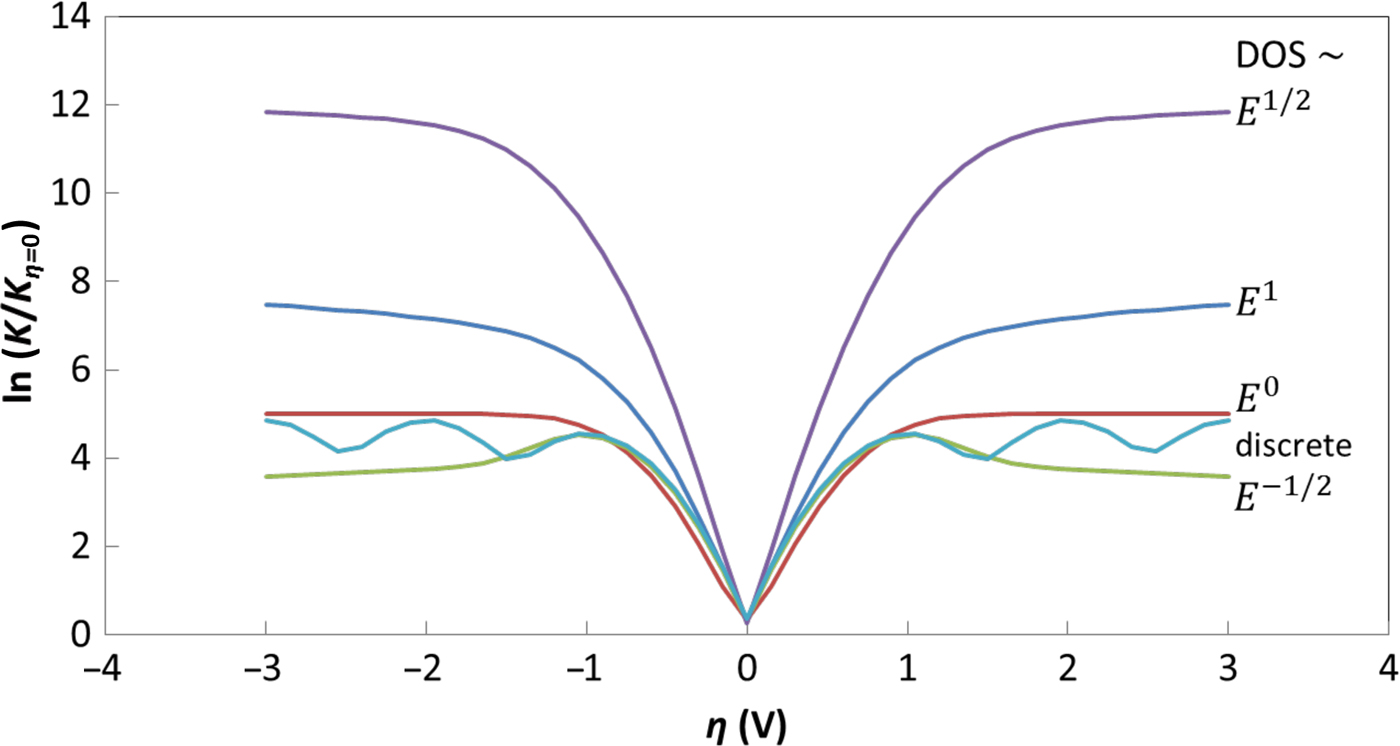
In a limiting case, corresponding to Eq. (3), the DOS would be a constant (e.g., ρ), reverting to the original Chidsey formulation.[Reference Chidsey12] In the subsequent treatment, the E c was taken as reference energy and set to zero. Such a formulation involving the energy variation of the DOS as a function of the dimensionality, D (e.g., DOS 3D ~ constant or ~E 1/2—for a semiconductor, DOS 2D ~ E 0, DOS 1D ~ E −1/2, DOS 0D ~ Dirac delta function like) also allows for a variable height of the step function, related to the product of the DOS and the f FD (E), as implicitly assumed in the Chidsey modification to the M–H theories. The resulting K MHC–DOS–η curves, as a function of the dimensionality-dependent DOS are indicated in Fig. 3. In addition to the parabolic E–k vector dispersion, we have also incorporated a linear E–k dispersion as seems to be necessary to describe the characteristics of graphene.[Reference Narayanan, Yamada, Karakaya, Podila, Rao and Bandaru19]
The variation of the normalized K MHC–DOS based reaction rate constants with η—obtained from Eq. (4), for electrodes with DOS ~ E a. The exponent a, indicated in the figure, is a function of the electrode dimensionality (i.e., a = ½ for a three-dimensional (3D) semiconductor; a = 0 or 1, for a 2D system, a = −½ for a 1D system) and is Delta-function like for 0D systems, such as quantum dots. The case of a = ½ involves a band gap, which causes the K η=0 to be smaller than that for the other cases. Generally, a reduction of the K corresponds to a decreasing DOS with energy.
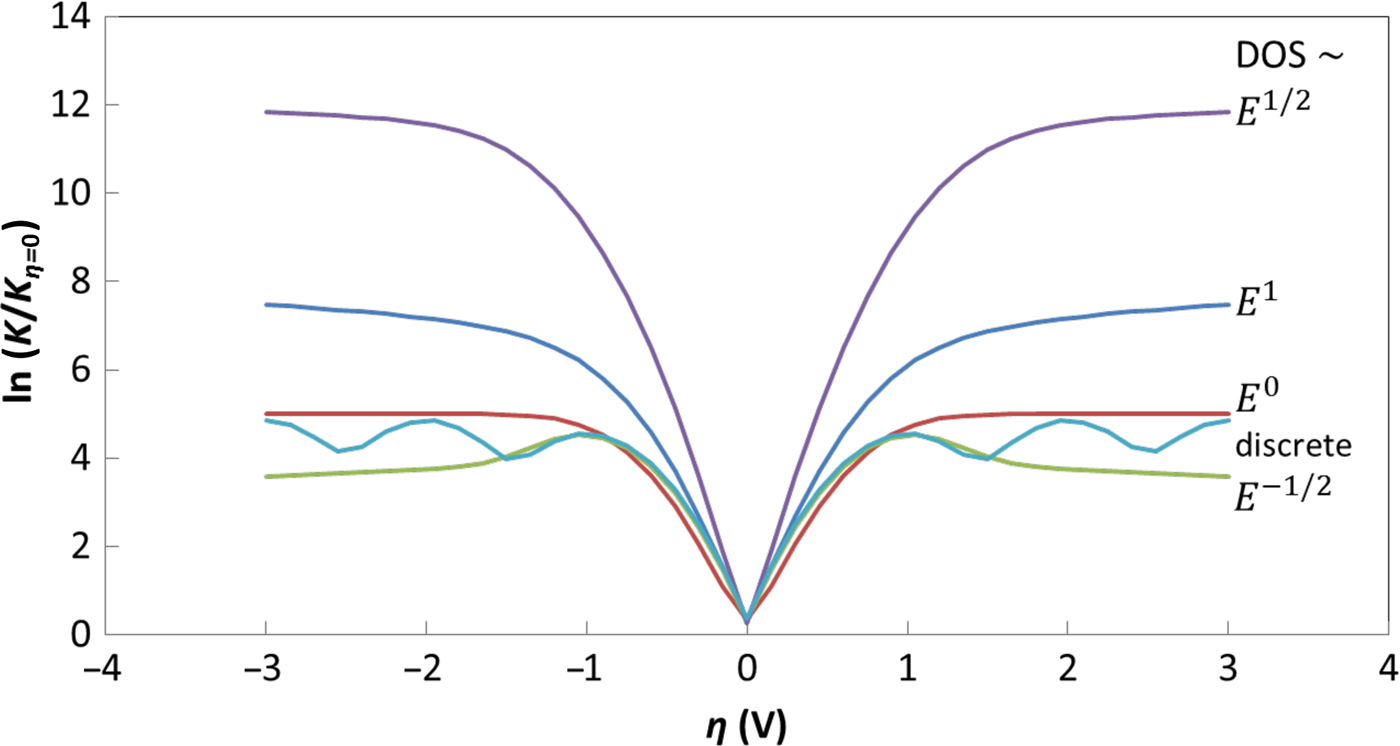
The respective influences of the dimensionality and the dispersion are clearly evident. While the traditional MHC-based formulations assumed a constant DOS, particular to bulk-like/3D metallic electrodes, the energy variation of the DOS in low-dimensional systems yields rich and involved behavior. For instance, the behavior of a 2D material with parabolic energy dispersion, e.g., involving a quantum well, is seen to differ compared with one with linear energy dispersion, e.g., graphene. In the latter case, an increasing DOS with electron kinetic energy is responsible for the observed variation. The situation for a 1D material, e.g., a carbon nanotube (CNT), constituted electrode—with parabolic energy dispersion along the long-axis and quantization along the two perpendicular directions, with a decreasing DOS vis-à-vis energy, corresponds to inversion in the K–η curves at a sufficiently large η as posited in the original MH formulations. In 1D systems, the initial increase of the DOS upon the E F reaching the band edge and the subsequent E −1/2 induced decrease yields a corresponding modulation of the K and the electrical currents.
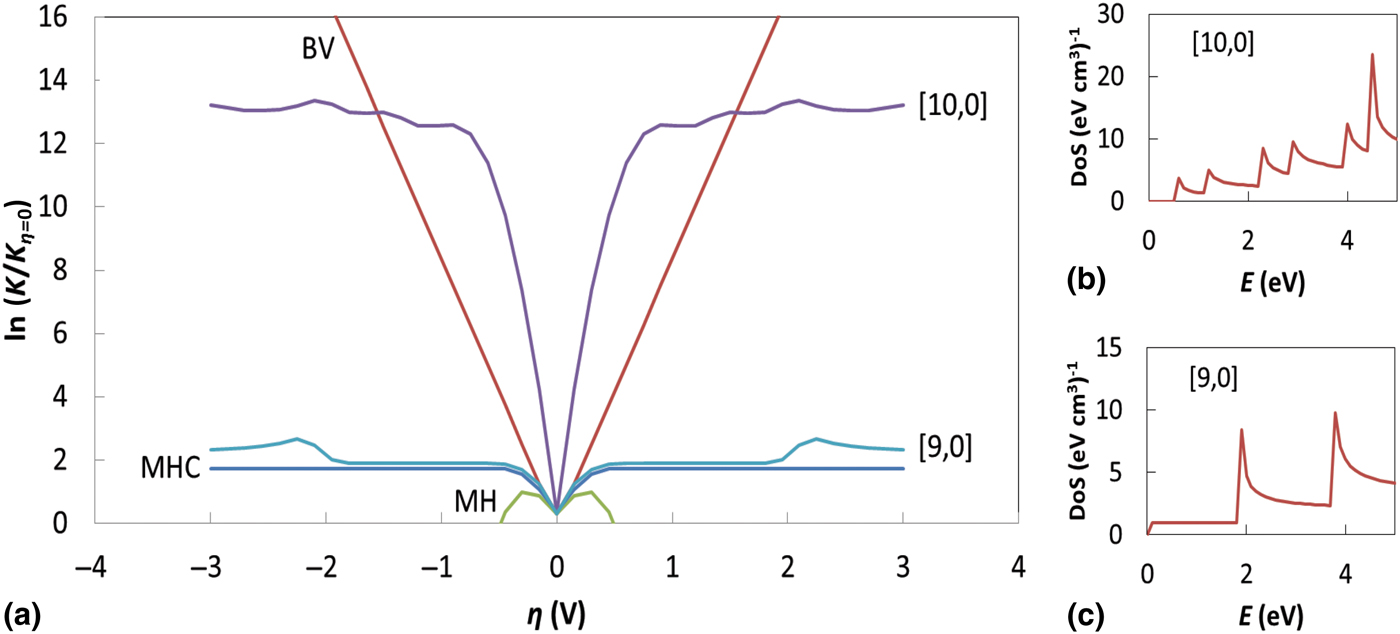
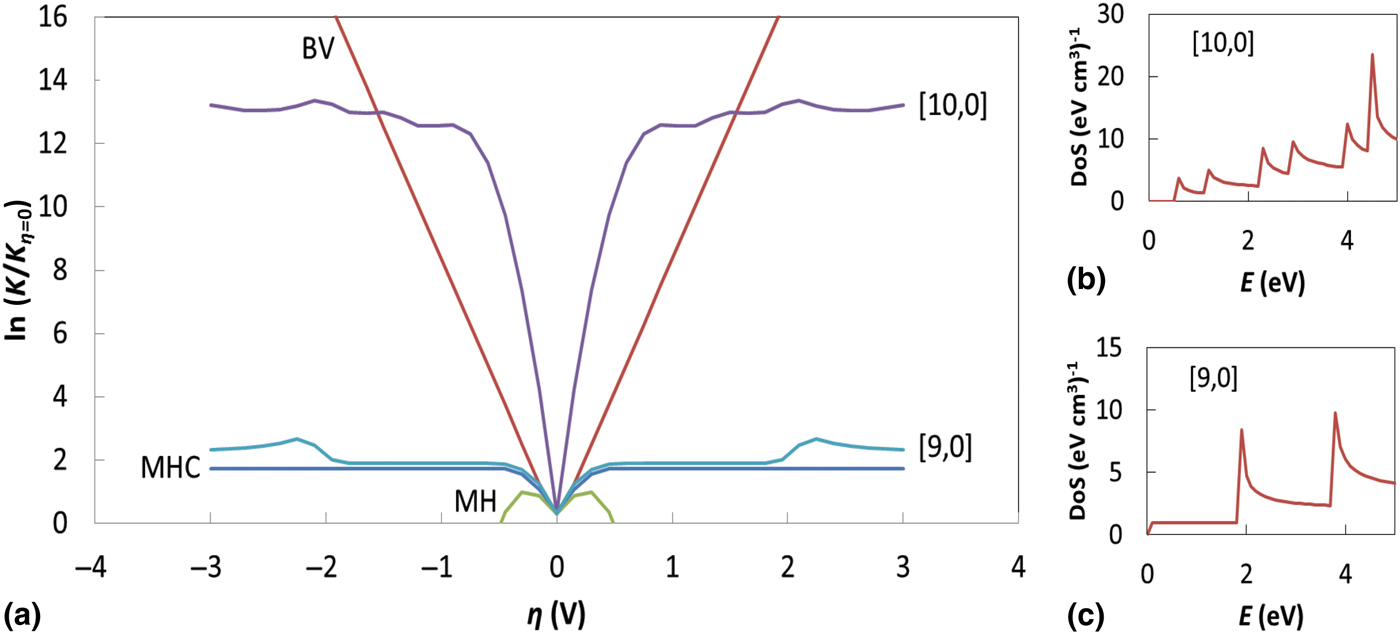
We then predict the occurrence of oscillations in the K/K η=0–η curves in 1D nanostructures as a function of chirality in Fig. 4. As is well known, the specific nature of wrapping of a constituent graphene sheet, through the chirality index [m, n], dictates whether the resulting CNT is metallic/semiconducting. We depict the corresponding DOS for a semiconducting [10,0] nanotube and a (ii) metallic [9,0] nanotube: Figs. 4(b) and 4(c), respectively. While K oscillations are particularly pronounced in the former, they are less so in the latter case. The underlying reason may be related to the smaller (/larger) separation of the energy sub-bands, respectively. Moreover, the oscillations in the semiconducting and the metallic cases occur at different voltages, corresponding to the DOS variation.
(a) The predicted variation of the reaction rate constants with η for a [10,0] and [9,0] single-wall CNT with λ = 0.25 eV. The respective DOS (E) variation, for the (b) [10,0], and (c) [9,0] single-wall CNT are indicated. The modulations in the rate constants are due to the successive population and de-population of sub-bands in the nanostructure. The E F was taken to be zero in these simulations.
It is to be noted that the width of the energy sub-bands (ΔE) in the electrode considered in the DOS (E), with respect to λ—typically electrode adjacent (e.g., electrolyte) side would be another important variable in interpretation of the K − η modulations. We further note that the net DOS relevant to the carriers participating in the electrochemical/redox reaction should be considered. Consequently, if the charge carriers from the surface states (e.g., with energy levels inside the band gap) are involved in the kinetics, then the local DOS may need to be considered. The rate constant may be increased at low η due to a sufficient number of surface states.
An experimental proof of the DOS based formulation of electrochemical kinetics
The “all-surface” characteristic of SLG offers a remarkable paradigm for the exploration of novel physical and chemical phenomena. However, many of the related observations, e.g., the half-integer quantum hall effect,[Reference Zhang, Tan, Stormer and Kim20] enhanced electrical and thermal conductivity due to reduced phase space,[Reference Das Sharma, Adam, Hwang and Rossi21] wrinkling,[Reference Zhu, Low, Perebeinos, Bol, Zhu, Yan, Tersoff and Avouris22] etc. are mostly concerned with electro-mechanical attributes, while the chemical aspects unique to graphene are less distinctive. For instance, in many cases it is unclear as to how a graphene sheet manifests clearly different electrochemical character compared to any other surface.[Reference Ambrosi, Chua, Bonanni and Pumera23] Here, we report on an electrochemical characteristic unique to the 2D nature of SLG, adding another facet to interpreting reaction rates in terms of dependence on the dimensionality of charge transport and positing the “necessity” for considering an alternate viewpoint.
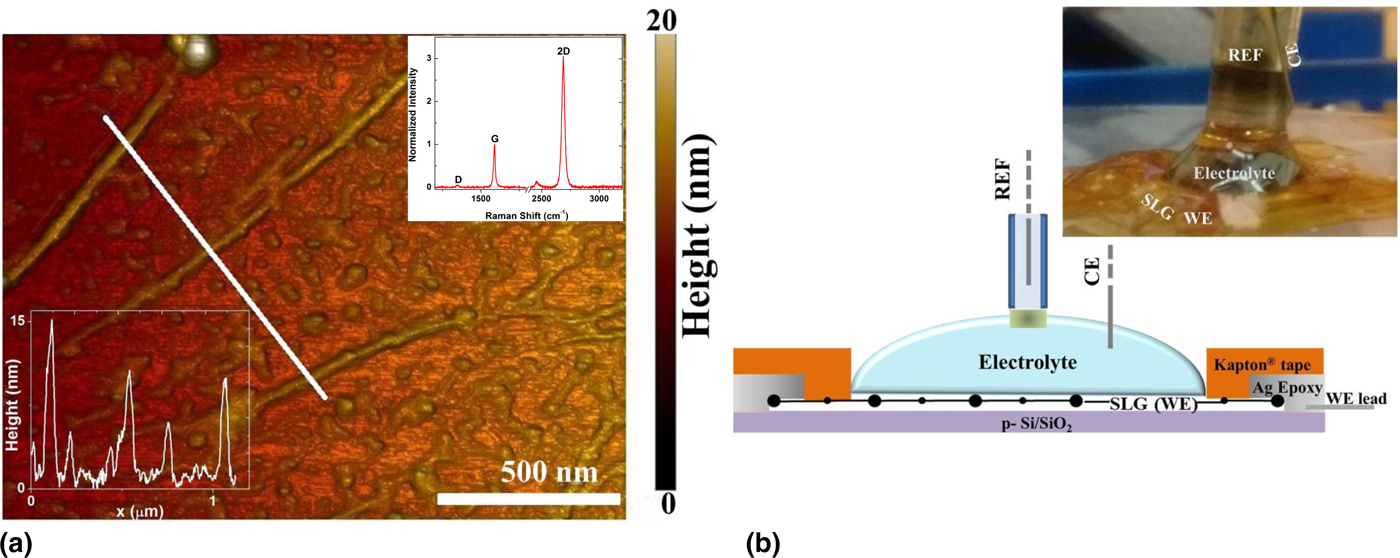
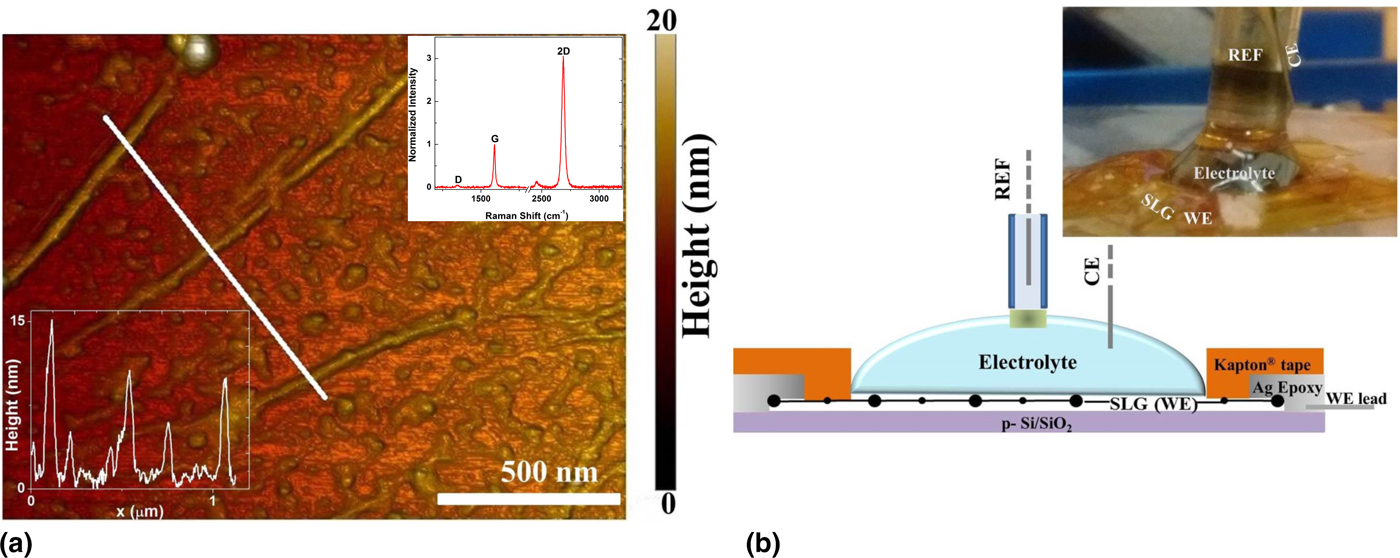
SLG was synthesized via CVD (chemical vapor deposition) on a copper foil and subsequently transferred to a SiO2/p-Si substrate. The materials preparation-related details have been previously reported.[Reference Zaretski, Moetazedi, Kong, Sawyer, Savagatrup, Valle, O'Connor, Printz and Lipomi24] The transferred SLG films were first characterized through Raman spectroscopy (inset to Fig. 5), from which the single-layer aspect was verified through the ratio of the intensities of the 2D- and the G-peak, i.e., from an I 2D/I G ratio of >2. Surface structure characterization through atomic force microscopy reveals distinct wrinkles: Fig. 5(a), that have characteristic modulations of the order of 10 nm. Electrochemical characterization of the SLG was performed using a three-electrode setup, under potentiostatic control. An annular electrical contact using silver epoxy was used to surround the SLG surface that served as the working electrode (WE), while a platinum wire and a saturated calomel electrode were used as the counter electrode (CE) and a standard calomel electrode-based reference electrode (REF), respectively: Fig. 5(b). The supporting electrolyte was an aqueous solution of 1 M KCl and was comprised a 1 mM concentration (=C) redox couple: potassium ferri-/ferro-cyanide: K3Fe(CN)63−/K4Fe(CN)64−, to study the specific reduction and oxidation reactions, respectively. A droplet (~100 µL) of electrolyte was cast onto the SLG, over the area enclosed by the annular contact (silver epoxy). The contact was covered with Kapton® to prevent exposure to electrolyte.
(a) Atomic force microscopy image of a section of the single-layer graphene (SLG) sample transferred onto a p-Si/SiO2 substrate. The “wrinkles” on the sample surface corresponding to the line scan (white line) are displayed in the lower left inset. The Raman spectrum of the transferred SLG is indicated in the top right inset. (b) Schematic representation of the three-electrode droplet electrochemical cell (actual experimental arrangement shown in the top right inset). The SLG working electrode (WE), Pt wire counter electrode (CE) and a reference (REF) saturated calomel electrode are indicated.
Electrochemical characterization
The reduction and oxidation of the electroactive moieties at the SLG electrode/electrolyte interface, considering the oxidizing species, O: K3Fe(CN)63−, and the reducing species, R: K3Fe(CN)64−, is represented through:
 $$O + e^{\rm -} \mathrel{\mathop{\kern0pt\rightleftharpoons}\limits_{k_{\rm b}}^{k_{\rm f}}} R.$$
Here k f and k b are the forward and backward heterogeneous reaction rate constants, respectively. Generally, k f (/k b) is proportional to the magnitude of the overpotential η (=V − V 0′) with the applied potential: V being negative (/positive) with respect to an equilibrium (formal) potential V 0′. Since at equilibrium, the reaction in Eq. (5) must obey the Nernst relation, we employ the relation: k f/k b = θ (=exp [F η/RT], with F (=96,487 C/mol) as the Faraday constant, R (=8.3 J/mol K), as the gas constant, at a given temperature: T). At any given V, a net reaction rate: k = k f + k b, may also be defined. At equilibrium (i.e., at potential V 0′), k f = k b = k o.
Typically, cyclic voltammetry (CV)-related Nicholson method[Reference Bard and Faulkner6, Reference Velicky, Bradley, Cooper, Hill, Kinloch, Mishchenko, Novoselov, PAtten, Toth, Valota, Worrall and Dryfe25] cannot be used to determine k f (/k b) since the current response beyond V p–r (/V p–o) (i.e., far from equilibrium) is mostly due to mass transport control. Consequently, CA (involving potential step experiments) was used to determine k f and k b at potentials far from equilibrium. The details of the arrangement and the experimental analysis are published elsewhere.[Reference Yamada and Bandaru26] The observed i(t) was parameterized[Reference Yamada and Bandaru26] as in terms of the involved rate constants: k f and k b.
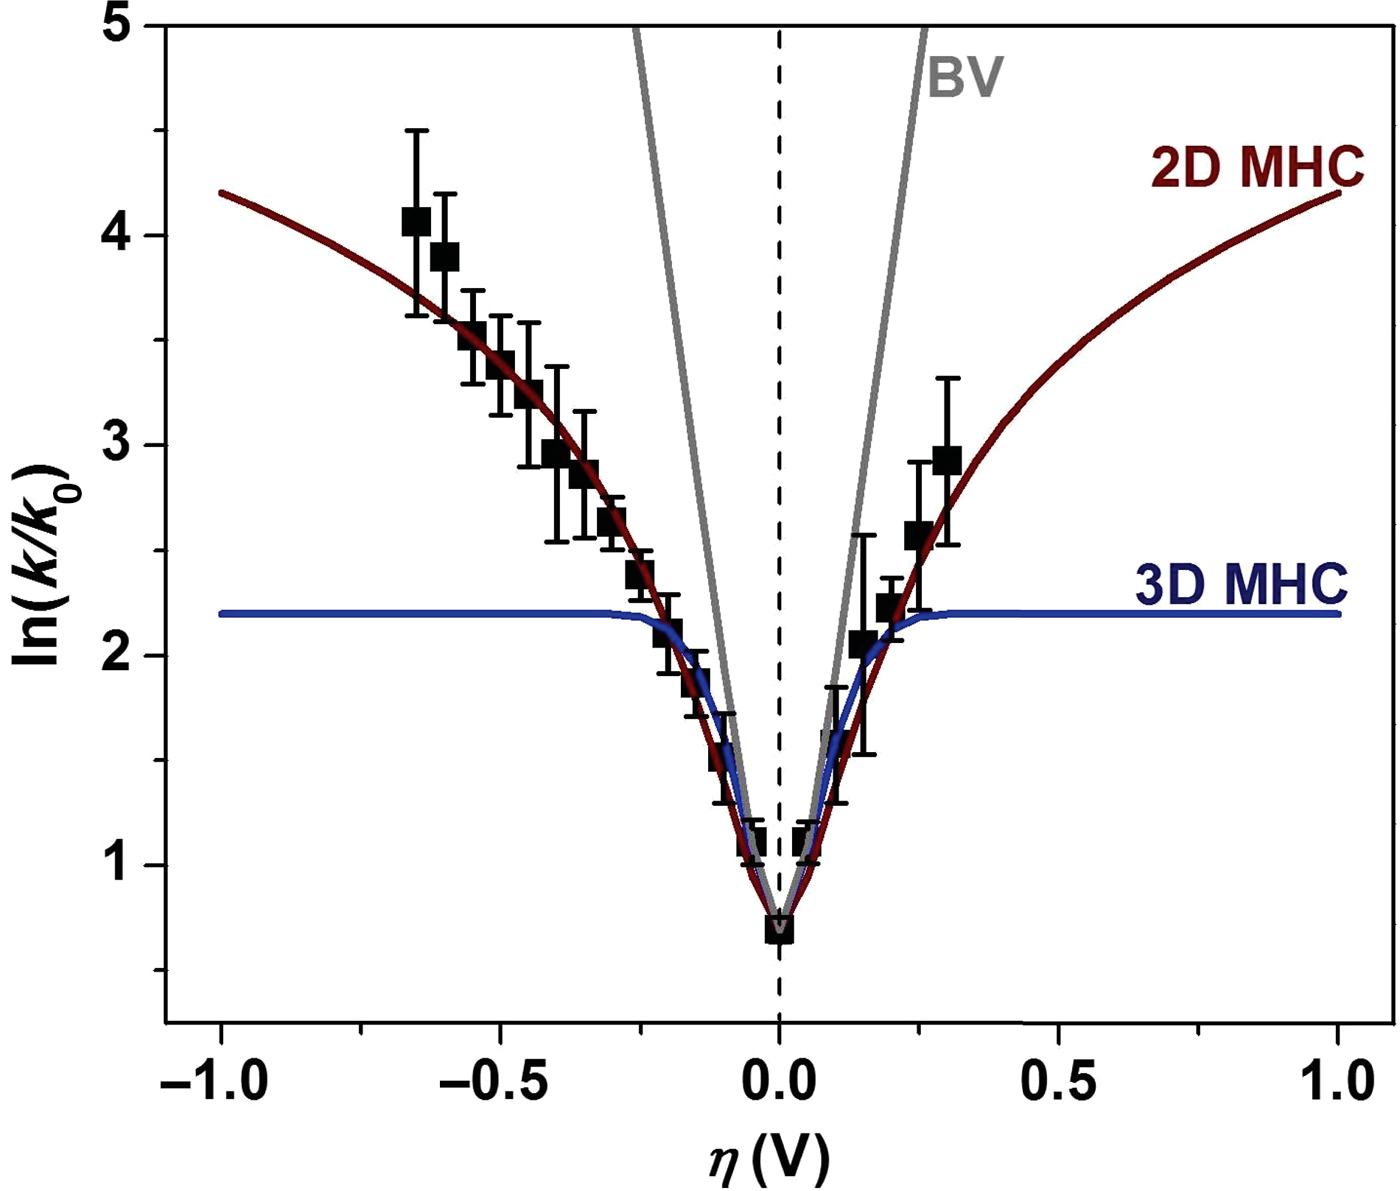
The net rate constant: k (=k f + k b) normalized to k o is plotted as a function of η in Fig. 6. It was immediately obvious that the observed ln(k/k o) − η variation differs markedly from both B–V kinetics—where a linear relationship is expected on the semi-log plot, as well as the MHC kinetics—which predicts a saturation of the rate constants with increased η. Alternatively, we observed for the SLG samples, that while the slope monotonically decreases with increasing |η| it never reaches zero within the stability limits of the electrolyte. We have also noted that the observed ln(k/k o) − η variation, cannot be fit through varying the series/film resistance.
A plot of the extracted rate constants (k = k f + k b, sum of the forward and the backward rate constants, respectively) normalized to the k η=0 V as a function of η. The experimental data is a poor fit with the theoretical fits expected from conventional Butler–Volmer (B–V) kinetics, three-dimensional Marcus–Hush–Chidsey (MHC) kinetics assuming a constant DOS, but could be modeled well through dimensionality dependent electrochemical kinetics (2D DOS model), following Eq. (3) in the text.

An understanding of charge transfer between a lower dimensional nano-electrode system and a three-dimensional liquid electrolyte
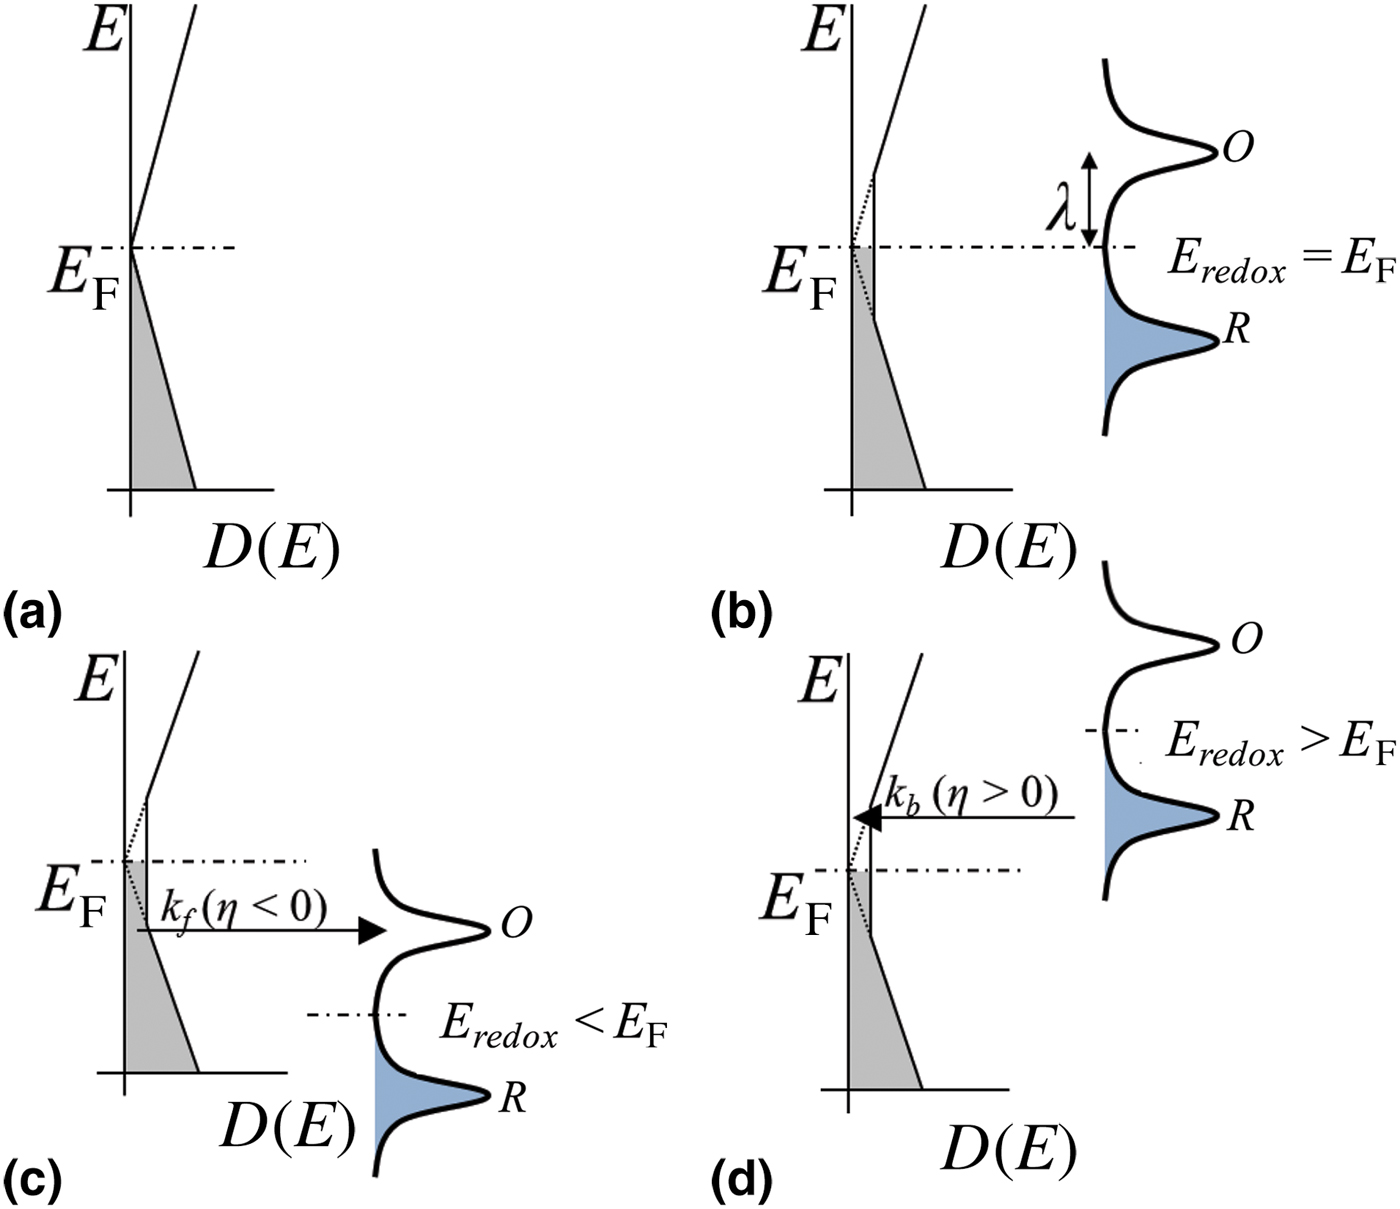
A schematic representation of the implications of Eq. (4) for (i) η = 0, (ii) η < 0, and (iii) η > 0, is indicated in Fig. 7. Electron transfer from electrode to electrolyte occurs from the filled carrier states in the electrode (following the Fermi–Dirac distribution), to the empty states in the electrolyte (which may be distributed in energy, following for instance a Gaussian distribution).[Reference Gerischer, Gellings and Bouwmeester27] With varying η, the electrolyte states effectively scan over the DOS distribution of the electrode, implying that the k/k 0 variation “mimics” the electrode DOS. For a pristine graphene sheet (e.g., defect or wrinkle free) n = 0 at the Dirac point, and it would be expected that k 0 = 0. However, a finite value of for k o, with the implication of a non-zero DOS was observed. We then fit the experimental data (depicted through the “2D DOS model” in Fig. 6) assuming a finite and constant DOS close to η = 0 and found that the energy width of such a constant DOS region could be at most 2λ. A best fit, with a width of 2λ where λ = 4k BT (~104 meV at room temperature) is indicated previously in Fig. 6. Beyond eη ~ ±λ, the linear variation of the DOS resumes yielding an increasing k/k 0 with η.
A schematic representation of (a) the energy (E) dependent density of states: DOS (E), of an “ideal” single-layer graphene (SLG) sheet. The DOS (E) for a “non-ideal” SLG (say, with wrinkles, electron and hole puddles, etc.) vis-à-vis the distribution functions of the O and R species in the redox couple, with respect to the overpotential (η), for (b) η = 0, (c) η < 0, and (d) η > 0, respectively. The E F and the E redox (=eV 0′) are the corresponding Fermi energy of the electrodes and the energy related to the formal/equilibrium potential: V 0′. The non-zero value of the DOS at the Dirac point is responsible for a finite electrochemical rate constant at η = 0: k o.
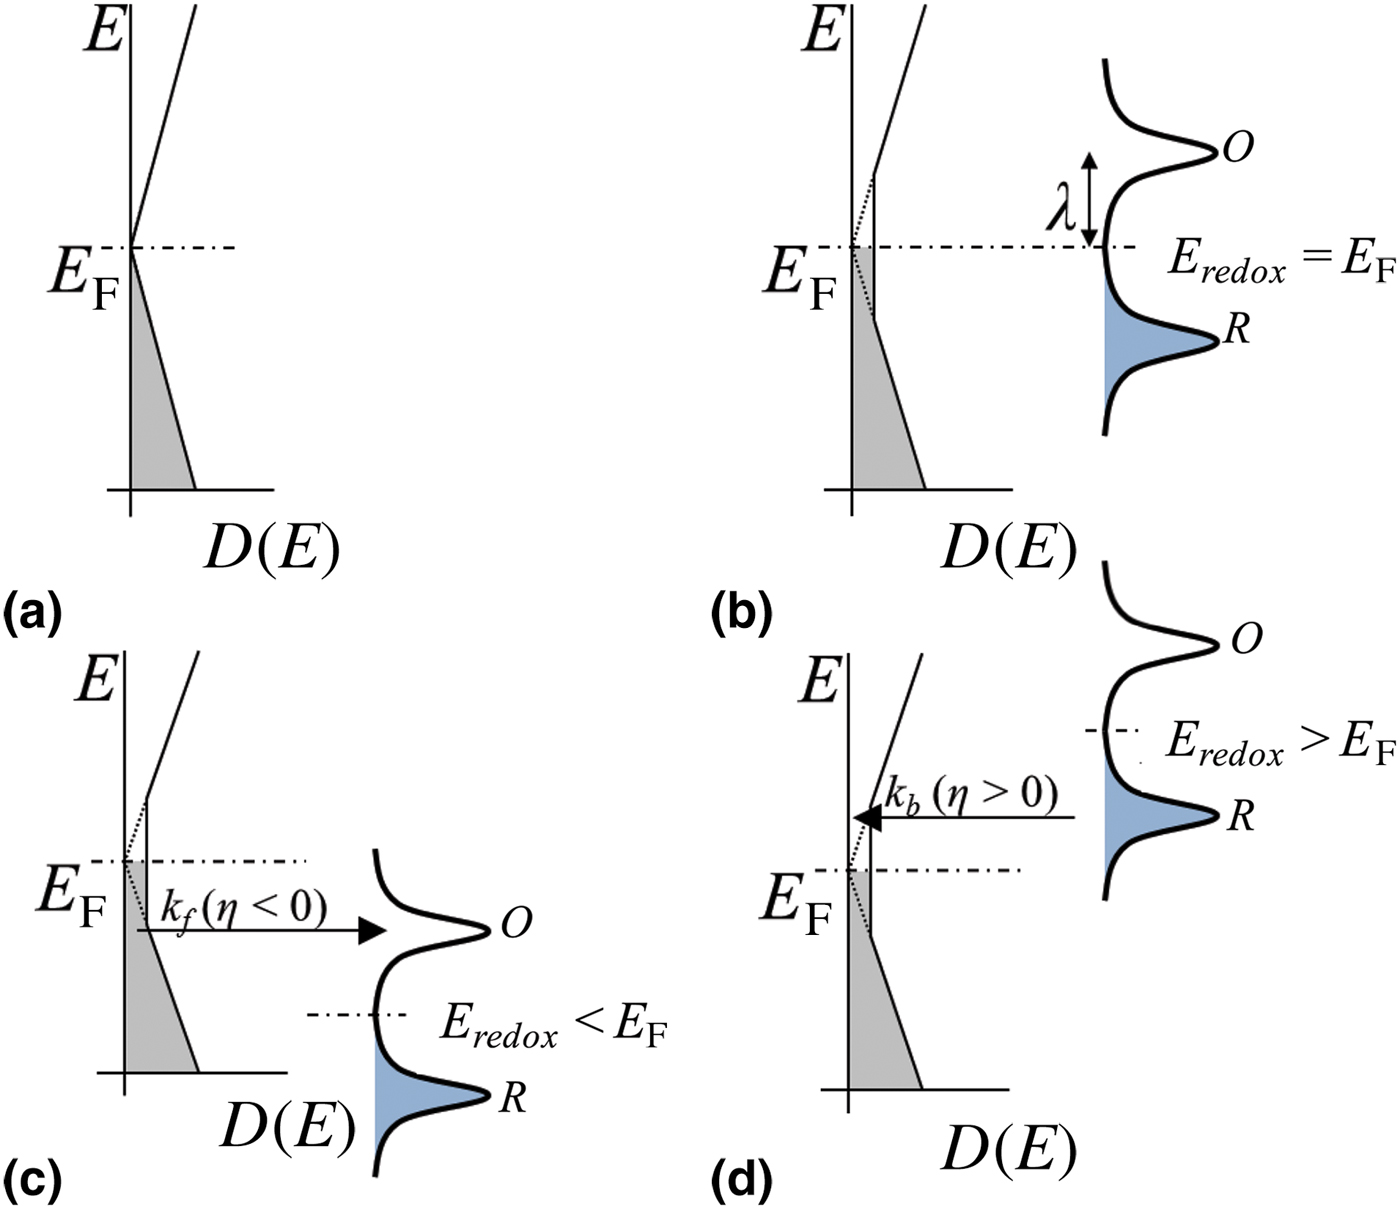
Physically, the source of this additional, non-ideal DOS variation could be due to the formation of both[Reference Martin, Akerman, Ulbricht, Lohmann, Smet, von Klitzing and Yacoby28] electron and hole puddles as well as inevitably induced wrinkles[Reference Zhu, Low, Perebeinos, Bol, Zhu, Yan, Tersoff and Avouris22]—as in Fig. 5(a). Up to a threshold |η| = 4k BT ~ 104 meV, corresponding to the constant DOS near the Dirac point, increasing (/decreasing) η would only result in reducing electron (/hole) puddle concentrations; which seem to be present in equal numbers as deduced from the symmetry of the data in Fig. 6. Only beyond a threshold |η| would the DOS increase linearly, concomitant with an increase of the carrier concentration and resulting Fermi energy. Assuming each electron/hole puddle has sufficient number of carriers to yield concomitant “quasi”-Fermi levels of ±104 meV, we estimated an intrinsic puddle carrier concentration of ~8 × 10¹¹/cm2; previous work[Reference Xia, Chen, Li and Tao29] has shown such intrinsic doping of ~1012/cm2.
Conclusions
In summary, we have shown that considering the specific nature of the DOS, as would be necessary in nanostructured materials, leads to a modification of the MHC electro-kinetics, considering graphene as a prototype example. While MHC-based models are seemingly appropriate for most macroscale metallic electrodes, they need correction[Reference Bai and Bazant17] for nanoscale electrodes. We have also predicted, most notably, the occurrence of oscillations of the rate constant and the concomitant electrical current in semiconducting nanotubes, the experimental verification of which would be a significant test of the nature of electrical conductivity as well as dimensionality. Our work then bares open intriguing aspects related to the necessity for a deeper theoretical and experimental investigation[Reference Park, Zaouk, Wang and Madou30] of dimensionality-related effects. The implications of our study extend to properly modeling the electrical current that could be obtained in electrochemical and biologic systems, with applications incorporating battery-related systems, wearable sensors, etc., where such electrical current modulations would impact energy and power delivery.
Acknowledgments
The authors are grateful for support from the Defense Advanced Research Projects Agency (DARPA: W911NF-15-2-0122) and the National Science Foundation (NSF: CBET 1606192 and CMMI 1246800). The assistance of Professor D. Lipomi and his research group as well as the discussions with Professor P. Asbeck are appreciated.