Adolescence is an age of exploration, during which most teens begin dating and exploring their sexuality. For too many adolescents, however, early romantic experiences involve sexual coercion. The Youth Risk Behavior Survey recently revealed that 7.4% of adolescents report being forced to have sexual intercourse (Eaton et al., Reference Eaton, Kann, Kinchen, Shanklin, Ross and Hawkins2010). When the definition of sexual coercion is expanded to include unwanted sexual contact due to verbal pressure, alcohol or drugs, or physical force (Koss & Gidycz, Reference Koss and Gidycz1985), as many as 43% of adolescent girls and 36% of adolescent boys report experiencing such victimization (Hickman, Jaycox, & Aronoff, Reference Hickman, Jaycox and Aronoff2004). Adolescents who become victims of peer sexual coercion experience increased externalizing and internalizing symptoms, including depression and risk for suicide (Ackard & Neumark-Sztainer, Reference Ackard and Neumark-Sztainer2002; Howard & Wang, Reference Howard and Wang2005).
Particularly troubling is the tendency for adolescents who have experienced sexual coercion to develop a pattern of continued victimization. Young and Furman (Reference Young and Furman2008) reported that, after an initial incident of sexual coercion, adolescents' risk for subsequent incidents increased more than sevenfold. Multiple or ongoing experiences of sexual coercion may have cumulative effects upon psychological adjustment and likely impact the health of future romantic relationships (Hedtke et al., Reference Hedtke, Ruggiero, Fitzgerald, Zinzow, Saunders and Resnick2008; Jones, Hughes, & Unterstaller, Reference Jones, Hughes and Unterstaller2001).
Unfortunately, the development of such patterns is not clearly understood. Although many risk factors for peer sexual coercion have been identified (see Vezina & Hebert, Reference Vezina and Hebert2007), it remains unknown whether the experience of sexual coercion itself may in turn be associated with changes in these initial risk factors that would then place victims at even higher risk for further coercion. Such a pattern would suggest the presence of a feedback loop between the experience of peer sexual coercion and the factors that increase risk for coercion and would help explain the strong increase in risk adolescents experience after such an incident. The current study describes changes that occur in known risk factors for sexual coercion after an incident has occurred. We hypothesized that behaviors or cognitions that put an adolescent at risk for coercion would intensify following such an incident.
Although it is important to emphasize that the responsibility for sexual coercion lies solely with the perpetrator, the present study focused on characteristics of victims that place them at risk for experiencing coercion. Examining changes that occur in already identified risk factors may suggest targets of intervention to interrupt the cycle of violence. In this way, better understanding of survivors' reactions to their experiences may help to promote resilience, both in terms of effectively coping with the psychological effects of their experiences as well as preventing further experiences of coercion.
Risk Factors for Peer Sexual Coercion
Internalizing and externalizing symptoms
An important factor in adolescents' risk for experiencing sexual coercion is their psychological adjustment. Adolescents with greater internalizing symptoms of distress such as low self-esteem, feelings of sadness or hopelessness, depression, and anxiety are more likely to become victims of sexual coercion (Foshee, Benefield, Ennett, Bauman, & Suchindran, Reference Foshee, Benefield, Ennett, Bauman and Suchindran2004; Vezina & Hebert, Reference Vezina and Hebert2007). In particular, adolescents who are less confident in their ability to protect themselves from sexual coercion are more likely to become victims (Walsh & Foshee, Reference Walsh and Foshee1998), and internalizing symptoms likely erode adolescents' confidence in this regard. Further, adolescents who appear depressed or anxious may be identified as potential targets for coercion, as they may be perceived as more vulnerable to pressure, less likely to fight back, or less likely to report the incident.
Similarly, adolescents who exhibit externalizing symptoms such as arguing and opposition, stealing, destruction of property, and other conduct problems are at greater risk for peer sexual coercion (Vezina & Hebert, Reference Vezina and Hebert2007). These adolescents are more likely to have friend groups who adopt attitudes that are more lenient toward sexual coercion and who model coercive behavior. Further, these adolescents are more likely to date from within their antisocial friend group (Capaldi & Crosby, Reference Capaldi and Crosby1997) and to have partners who are more likely to be aggressive within the relationship (Capaldi, Dishion, Stoolmiller, & Yoerger, Reference Capaldi, Dishion, Stoolmiller and Yoerger2001).
Of course, experiencing peer sexual coercion itself produces significant psychological distress (Dutton et al., Reference Dutton, Green, Kaltman, Roesch, Zeffiro and Krause2006), and internalizing and externalizing symptoms are likely to become exacerbated by such an experience. Adult women who experience multiple incidents of sexual aggression exhibit a cumulative effect on mental health, becoming two to four times more likely to develop clinically significant symptoms of depression, posttraumatic stress, and substance use than those who experienced only one incident (Hedtke et al., Reference Hedtke, Ruggiero, Fitzgerald, Zinzow, Saunders and Resnick2008). Likewise, children who experience psychological distress associated with family conflict (Harold, Fincham, Osborne, & Conger, Reference Harold, Fincham, Osborne and Conger1997), neighborhood violence (Margolin & Gordis, Reference Margolin and Gordis2000), or peer relational aggression (Crick et al., Reference Crick, Nelson, Morales, Cullerton-Sen, Casas, Hickman, Juvonen and Graham2001) often exhibit externalizing symptoms. Thus, we predicted that adolescents who experienced peer sexual coercion would exhibit increases in both internalizing and externalizing symptoms of psychological adjustment.
Sexual behavior
Another variable known to increase risk for sexual coercion is adolescents' sexual behavior. Adolescents who engage in higher levels of sexual behavior are at increased risk for sexual coercion (Young & Furman, Reference Young and Furman2008). Victims have been described as having an earlier age of sexual initiation as well as a greater number of sexual partners (Gidycz, Hanson, & Layman, Reference Gidycz, Hanson and Layman1995; Krahe, Reference Krahe1998). Engaging in sexual behavior with a peer places adolescents in a context in which sexual coercion could more easily occur. Often these behaviors occur in intimate settings where few other people are present and in which alcohol or drugs are often present (Buzy et al., Reference Buzy, McDonald, Jouriles, Swank, Rosenfield and Shimek2004). In these circumstances, even sexual behavior that is at first consensual may become coercive if sexual boundaries and attempts to stop are not respected. Similarly, adolescents are new to the dating domain and are still developing skills to effectively negotiate these complex social situations. Adolescents may not have developed the social skills and sexual assertiveness to resist sexual pressure and may not have developed a clear sense of what behaviors are healthy and safe.
Unfortunately, some adolescents who experience peer-initiated sexual coercion may respond by becoming more sexually active. For adolescents just learning about romantic relationships and the role of sexuality, experiencing coercion is likely to produce confusion and anxiety about dating and to interfere with the development of healthy attitudes toward sexual behavior. As discussed previously, victims of peer sexual coercion often experience heightened psychological symptoms of depression, anxiety, and posttraumatic stress (Krakow et al., Reference Krakow, Artar, Warner, Melendrez, Johnston and Hollifield2000; Shapiro & Schwartz, Reference Shapiro and Schwarz1997). Some adolescents may engage in risky sexual behavior as a means of coping with these negative emotions (Cooper, Agocha, & Sheldon, Reference Cooper, Agocha and Sheldon2000; Cooper, Shapiro, & Powers, Reference Cooper, Shapiro and Powers1998). For these reasons, we predicted that adolescents would exhibit increased sexual activity following experiences of sexual coercion from a romantic partner.
Relational styles
Other risk factors for sexual coercion include avoidant and anxious romantic relational styles (Alexander, Reference Alexander1992; Flanagan & Furman, Reference Flanagan and Furman2000; Stovall-McClough & Cloitre, Reference Stovall-McClough and Cloitre2006). Relational styles are conceptualized as representations of oneself, the partner and the relationship, and they serve to guide one's expectations and behavior within romantic relationships (Brennan, Clark, & Shaver, Reference Brennan, Clark, Shaver and Simpson1998; Furman & Wehner, Reference Furman, Wehner, Montemayor, Adams and Gullota1994). Those who are avoidant in romantic relationships are not comfortable with intimacy and prefer self-reliance; commitment to a romantic partner tends to be low. Accordingly, sexual intimacy tends to be more important than emotional intimacy in romantic relationships (Schachner & Shaver, Reference Schachner and Shaver2004). Those who are anxious regarding romantic relationships may worry about rejection and be overly dependent on others for support and esteem; a desire for closeness and acceptance tends to be high. For romantically anxious individuals, sexual behavior is viewed as a means to increase intimacy and to achieve self-validation (Davis, Shaver, & Vernon, Reference Davis, Shaver and Vernon2004).
Becoming the target of sexually aggressive or coercive behavior is likely to confirm romantically avoidant or anxious individuals' beliefs and expectations about romantic relationships (Thelen, Sherman, & Borst, Reference Thelen, Sherman and Borst1998). For example, sexual coercion is likely to confirm avoidant individuals' beliefs that intimacy is undesirable and that commitment within a romantic relationship should be avoided. For romantically anxious individuals, experiencing coercion may increase confusion about intimacy within relationships and further cast doubt upon their ability to obtain acceptance and love from a romantic partner. They may become more willing to engage in unwanted sexual behavior in order to please their partner. Thus, we predicted increases in romantically avoidant and anxious romantic styles following sexual coercion.
Substance use
Finally, substance use also has been implicated in the risk for sexual coercion (Gollinelli, Longshore, & Wenzel, Reference Gollinelli, Longshore and Wenzel2009). Greater use of alcohol, marijuana, and other drugs has been related to increased risk for unwanted sexual encounters among adolescents and emerging adults (Eaton, Davis, Barrios, Brener, & Noonan, Reference Eaton, Davis, Barrios, Brener and Noonan2007; Testa, VanZile-Tamsen, & Livingston, Reference Testa, VanZile-Tamsen and Livingston2007). This link may be partially due to the effects of psychotropic substances on adolescents' cognitive functioning. For example, use of alcohol and drugs may obscure adolescents' judgment of their peers' behavior and intentions and reduce their ability to detect risk within their immediate environment. Substance use may also inhibit adolescents' cognitive and motor abilities necessary to take defensive action in the face of potential coercion (Gold, Sinclair, & Balge, Reference Gold, Sinclair and Balge1999; Polusny & Follette, Reference Polusny and Follette1995).
Furthermore, functional impairment after experiencing peer coercion tends to be worse for individuals who also report substance use (Lee, Ju, & Lightfoot, Reference Lee, Ju and Lightfoot2010). Given greater functional impairment and distress, these adolescents may turn to more substance use as a means to cope with the emotional impact of their experiences (Brady, Tschann, Pasch, Flores, & Ozer, Reference Brady, Tschann, Pasch, Flores and Ozer2009). Consistent with findings on risky sexual behavior, motives for drinking commonly include coping with negative emotions (Cooper, Reference Cooper1994; Cooper, Frone, Russell, & Mudar, Reference Cooper, Frone, Russell and Mudar1995). Substance use has actually been linked to risky sexual behavior among adolescents experiencing psychological distress (Elkington, Bauermeister, & Zimmerman, Reference Elkington, Bauermeister and Zimmerman2010). Thus, adolescents who experience sexual coercion and who turn to substance use as a coping mechanism are likely to have more sexual encounters and a compromised ability to keep themselves safe. This pattern has received some attention among adults (Anderson, Reference Anderson2002; Testa, Livingston, & Leonard, Reference Testa, Livingston and Leonard2003) but has received less attention among adolescents.
Current Study
The incidence of peer-initiated sexual coercion among adolescents is alarmingly high (Hickman, et al., Reference Hickman, Jaycox and Aronoff2004), and, once experienced, the risk for future incidents continues to rise (Young & Furman, Reference Young and Furman2008). To date, investigators have not examined what effect the experience of sexual coercion has on factors that place adolescents at risk for sexual coercion. An increase or intensification of risk factors after being coerced would suggest the presence of a feedback loop serving to maintain this pattern.
The purpose of the current study was to examine changes that occurred in adolescents' risk factors following peer sexual coercion. Specifically, we hypothesized that adolescents would experience increased internalizing and externalizing symptoms of psychological adjustment, exhibit increased sexual activity, become more avoidant or more anxious in their romantic relationship styles, and engage in more substance use. Using an approach known as piecewise growth curve modeling, a growth curve for each risk factor was modeled prior to an incident of sexual coercion and examined for change in the intercept or slope of a risk factor after such an incident.
Method
Participants
Data for the current study were drawn from a longitudinal investigation of close relationships and psychosocial adjustment during adolescence and emerging adulthood. Participants were recruited in the 10th grade from ethnically diverse schools and neighborhoods in a large western metropolitan area. Gender was evenly represented in the sample (100 males, 100 females), and ethnicity was representative of the broader United States' population (11.5% African American, 12.5% Hispanic, 1.5% Native American, 1% Asian American, 4% Biracial, and 69.5% White, non-Hispanics). At Wave 1, participants ranged in age from 14 to 16 years (M = 15.87 years, SD = 0.49 years).
Approximately 85% of the participants had begun dating by the tenth grade and 75.5% had a romantic relationship at least 1 month in duration. At Wave 1, 94% said they were heterosexual/straight. The remaining 6% at Wave 1 said they were bisexual, gay, lesbian, or questioning their sexual orientation; this proportion increased gradually across the waves to 13% by Wave 5. Participants in this sample were of average intelligence (Weschler Intelligence Scale for Children—III vocabulary standard score: M = 9.80, SD = 2.44) and closely approximated national norms on measures of psychosocial adjustment and substance use (see Furman, Low, & Ho, Reference Furman, Low and Ho2009). Approximately 55% of participants' mothers reported that they had a college degree, as would be expected from an ethnically representative sample from this particular metropolitan area.
Procedure
Participants were recruited from a diverse range of neighborhoods and schools in a large Western metropolitan area by distributing brochures and sending letters to families residing in various zip codes and to students enrolled in various schools in ethnically diverse neighborhoods. The ascertainment rate could not be determined because we used brochures and because many families who received the letter did not have a 10th grader. As part of the recruitment strategy, families were paid $25 for a follow-up home visit to hear a description of the project. Of the families that heard the description, 85.5% enrolled in the study and completed the Wave 1 assessment.
Active consent was provided by the participants' parent and each participant also provided active assent. Participants completed interviews and provided observational and self-report questionnaire data about themselves and their close relationships. Data for the current analyses were collected over the first five waves, when the participants were in the 10th, 11th, and 12th grade; 1-year posthigh school; and 2.5 years posthigh school. Attrition over the five waves was low. All 200 adolescents participated in the first two waves of data collection, 199 in the third, 194 in the fourth, and 185 participated in the fifth wave of data collection.
The mother or custodial parental figure completed questionnaires about the participant (mother: Wave 1 N = 200; Wave 2 N = 185; Wave 3 N = 176, Wave 4 N = 173; Wave 5 N = 163.) Finally, a close friend nominated by the participant also completed questionnaires about the participant (friends: Wave 1, N = 192; Wave 2, N = 167; Wave 3, N = 154; Wave 4, N = 142; Wave 5, N = 137). Active consent and assent were obtained from each friend and his or her parent. Participants, mothers, and friends were compensated financially for completing the questionnaires. The study was approved by the University of Denver's Institutional Review Board.
Measures
Internalizing symptoms
Several measures were combined to create a single, composite variable for adolescents' internalizing symptoms The Beck Depression Inventory (BDI) was administered to assess depressive symptoms (Beck, Rush, Shaw, & Emery, Reference Beck, Rush, Shaw and Emery1979). The BDI is a broadly used 21-item self-report measure of depressive symptoms designed for individuals 13 and over (M α = 0.86). The State Trait Anxiety Inventory (STAI) was administered to assess trait anxiety (Spielberger, Reference Spielberger1983). The STAI contains 20 trait items in which participants rate how they generally feel on a 4-point Likert scale (M α = 0.91). Participants also completed the internalizing scales of the Youth Self-Report (YSR) in Waves 1–3 and the internalizing scales of the Adult Self-Report (ASR) in Waves 4–5 (Achenbach, Reference Achenbach1991). Using a 3-point scale, participants indicate how often they experience each of a series of symptoms. To make the scales comparable across waves and to allow growth over waves, we averaged the raw scores of the 26 internalizing items that were common to the YSR and ASR versions (M α = 0.87); To make the scores on the different measures comparable, the STAI, BDI, and YSR/ASR scores were standardized across waves and averaged to form a composite measure of internalizing symptoms.
Externalizing symptoms
Participants also completed the externalizing scales of the YSR in Waves 1–3 and the internalizing and scales of the ASR in Waves 4–5 (Achenbach, Reference Achenbach1991). To make the scales comparable across waves and to allow growth over waves, we averaged the raw scores of the 26 externalizing items that were common to the YSR and ASR versions (M α = 0.81). Friends and mothers completed the externalizing scale of the Child Behavior Checklist in Waves 1 to 3 and the externalizing scale of the Adult Behavior Checklist in Waves 4 and 5 (Achenbach, Reference Achenbach1991). To make the scales comparable across waves and to allow growth over waves, we averaged the raw scores of the 26 externalizing items that were common to the Child Behavior Checklist and Adult Behavior Checklist versions (mother M α = 0.88; friend M α = 0.85). To make the scores of the participants', friends', and mothers' reports comparable, we standardized each of the measures across waves, and then averaged the scores to derive a composite measure of externalizing symptoms.
Sexual coercion
The Sexual Experiences Survey (SES; Koss & Gidycz, Reference Koss and Gidycz1985) was administered at each wave of data collection. The SES consists of eight questions about the frequency of experiencing various types of unwanted sexual activity over the past year (or since the last wave of data collection). For example, one item asks, “Have you had sexual intercourse when you didn't want to because a person threatened or used some degree of physical force (twisting your arm, holding you down, etc.) to make you?” Based upon Koss and Gidycz's definition (Reference Koss and Gidycz1985), sexual coercion was considered to be any behavior involving verbal coercion, use of drugs or alcohol, or the threat or use of physical force in order to obtain an unwanted sexual contact with any part of the body. The items on the SES were used to dichotomously determine whether coercion occurred at each wave. The questions were asked specifically in regard to experiences with peers; participants were instructed not to include sexual coercion from family members or other adults.
Sexual behavior
The Sexual Attitudes and Behavior Survey (Furman & Wehner, Reference Furman and Wehner1992) is a self-report questionnaire that asks about several aspects of adolescents' sexual behavior. The current study focused upon variables related to participants' sexual intercourse, including frequency of intercourse, number of casual intercourse partners, and total number of intercourse partners. Participants reported on their behavior over the past year. The Sexual Attitudes and Behavior Survey was administered by computer-assisted self-interviewing techniques to encourage participants to respond honestly (Turner, Ku, Rogers, Lindberg, & Pleck, Reference Turner, Ku, Rogers, Lindberg and Pleck1998).
Romantic relational style
Participants' romantic styles were measured using the romantic partner version of the Behavioral Systems Questionnaire (BSQ; Furman & Wehner, Reference Furman and Wehner1999). The BSQ resembles attachment style questionnaires, but assesses intimacy and closeness with respect to caregiving, affiliation, and sexuality, as well as attachment. Participants were asked to rate their agreement (1–5 Likert scale) with each of 36 items that present statements related to each behavioral system. These items are divided into three scales that assess secure, dismissing (avoidant), or preoccupied (anxious) styles, respectively.
In the current literature on representations, two dimensions are consistently reported: anxious and avoidant (see Mikulincer & Shaver, Reference Mikulincer and Shaver2007). Thus, we expected to find evidence of these two dimensions in participants' style scores on the BSQ. A principal axes factor analysis with oblique rotation was conducted to determine the factor structure of the BSQ. A two-factor solution was found to provide the best fit theoretically, and together the two factors accounted for 40% of the variance. The two factors were (a) an avoidant style on which all the dismissing items loaded positively and all the secure items loaded negatively (eigenvalue = 9.56), and (b) an anxious style on which all the preoccupied items loaded (eigenvalue = 5.97). Three items loaded on both factors. Two relational style scores were used in all analyses, both with good internal reliability: (a) an avoidant dimension score computed by subtracting each participant's score on the secure scale from his or her score on the dismissing scale (M α = 0.93); (b) an anxious dimension score that was equal to the preoccupied scale score (M α = 0.86). These dimensions resemble the avoidance and anxiety dimensions commonly found in adult attachment research (Brennan et al., Reference Brennan, Clark, Shaver and Simpson1998; Simpson, Rholes, & Nelligan, Reference Simpson, Rholes and Nelligan1992), but incorporated perceptions of caregiving, affiliation, and sexual behavior, as well as attachment.
We averaged the items loading on each factor. This unit weighting technique closely resembles weighting items by factor loadings and can be superior in some circumstances (see Einhorn & Hogarth, Reference Einhorn and Hogarth1975; Trites & Sell, Reference Trites and Sells1955). In the current data, the average correlation of the avoidant and anxious scales within a wave was r = −.40.
Substance use
Participants' self-reported alcohol and drug use was assessed with the Drug Involvement Scale for Adolescents (Eggert, Herting & Thompson, Reference Eggert, Herting and Thompson1996), which was administered using computer-assisted self-interviewing. The Drug Involvement Scale for Adolescents assesses frequency of use over the last 30 days of tobacco, beer/wine, liquor, and 10 different drugs (e.g., marijuana, cocaine, hallucinogens, inhalants, etc.). Participants rated the frequency of their use on a 7-point scale (0 = not at all to 6 = used every day). To make the scales assessing different components of substance use comparable and permit growth across waves, the frequencies of beer/wine and liquor consumption were standardized across the waves and then the two were averaged into a scale of alcohol use. Similarly, the frequencies of drug use were averaged into a scale of drug use and standardized across waves. Participants also completed 16 items assessing negative consequences arising from substance use (M α = 0.95) and 8 items related to controlling their substance use (M α = 0.93). The negative consequences and control scores were each standardized across waves and then averaged into a scale of problem usage. For each scale, higher scores indicated more substance use.
Friends also answered four questions about the participant's substance use using Harter's (Reference Harter1988) structured alternative format. One item assessed the participant's alcohol use, one item assessed drug use, and two items assessed problems resulting from substance use (M α = 0.85).
Finally, participants' self-reports were combined with friends' report to form a single composite variable reflecting alcohol consumption, drug use, and problems associated with these behaviors. Each of the scales described above (self-reported alcohol use, self-reported drug use, self-reported problems associated with use, and friend-reported substance use) was standardized separately and then averaged into a single composite score at each wave (M α = 0.81).
Analytic strategy
Changes in the outcome variables after an initial experience of sexual coercion were assessed with a series of piecewise growth curve models, a special case of growth curve modeling (see Duncan, Duncan, Strycker, Li, & Alpert, Reference Duncan, Duncan, Strycker, Li and Alpert1999). Like other growth curve models, piecewise models describe the developmental trajectory within a variable. This trajectory includes an intercept that describes the initial level of a variable and a slope that describes the rate and direction of change. Unlike other growth curve models, however, a piecewise model allows for changes to occur in the developmental trajectory after a significant event. In the context of the current study, sexual coercion was expected to be a significant event that produced a developmental shift such that survivors exhibit a different developmental trajectory after coercion than before victimization. This shift may be characterized by a change in intercept or by a change in slope.
Practical applications of piecewise growth modeling have been illustrated elsewhere (see Leppanen, Niemi, Aunola, & Nurmi, Reference Leppanen, Niemi, Aunola and Nurmi2004; Li, Duncan, Duncan, & Hops, Reference Li, Duncan, Duncan and Hops2001), as have the technical aspects of specifying such models (see Bryk & Raudenbush, Reference Bryk and Raudenbush1992). This approach was particularly attractive in the current study due to the fact that several of the risk factors in question tend to increase naturally over time as part of normative development. For example, most adolescents experience increasing levels of sexual behavior as they progress through the teen years (Welsh, Haugen, Widman, Darling, & Grello, Reference Welsh, Haugen, Widman, Darling and Grello2005), just as experimentation with alcohol and drugs is a normative aspect of development (Shedler & Block, Reference Shedler and Block1990). For this reason, simply assessing changes from one year to the next may be misleading to the extent that these changes represent a normative developmental trajectory. Piecewise growth modeling, in contrast, provides the ability to assess for change in the developmental trajectory itself that occurs in association with a particular event (e.g., sexual victimization).
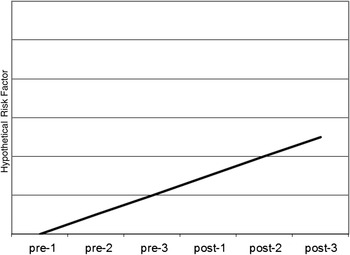
A model-fitting approach was taken to statistically evaluate the piecewise growth models. This approach began by specifying a linear growth curve that served as a baseline comparison model (no-change model). In this model, the slope for a particular variable after the initial incident of sexual coercion was constrained to be equal to the trajectory before that incident occurred. Further, the postvictimization slope was specified to be continuous with the previctimization trajectory, meaning that it begins at the level where the previctimization trajectory ends. These constraints make this piecewise model functionally equivalent to a traditional, linear growth curve model. In effect, the baseline (no-change) model hypothesizes that the trajectory of the variable does not change in slope or intercept after an individual experiences sexual coercion. An example of the no-change model is provided in Figure 1.
The baseline linear model that hypothesizes no change in risk factors following victimization. This figure is for illustration only and does not depict actual data.

This linear baseline model provided an initial estimate of model fit. In the next step, three alternative piecewise models were each compared to the baseline model and assessed for statistically significant improvement in model fit. Each of these alternative models is nested in the baseline model, allowing for a direct comparison of model fit by calculating the change in chi-square value (Kline, Reference Kline2005). If adolescents experience a change in the trajectory of a risk factor after experiencing sexual coercion, then a piecewise model that allows for this change will provide a better fit to the data than the no-change baseline model, as reflected by a significantly lower chi-square value. If the change in chi-square is not significant, then the simpler, more parsimonious no-change model is retained.
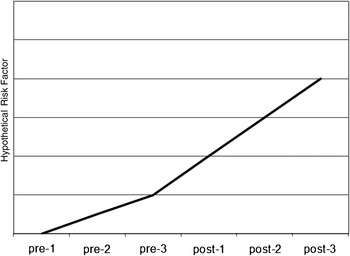
Model 2 (slope-change) hypothesizes that a change in slope occurs after experiencing coercion. For example, this model hypothesizes that the variable increases at a faster rate after experiencing coercion. This is accomplished in Model 2 by allowing the slope after coercion to be different than the slope before coercion. Model 2 does not include a change in intercept after coercion occurs, however; thus, the steeper postvictimization trajectory is continuous with the previctimization trajectory (see Figure 2).
The slope-change model that hypothesizes a change in slope following victimization. This figure is for illustration only and does not depict actual data.

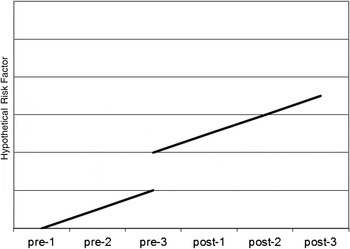
In contrast, Model 3 (intercept-change) hypothesizes that a change in intercept but not slope occurs after experiencing coercion. For example, survivors exhibit a higher level of a variable after coercion (higher intercept), but the rate of change in this variable (slope) remains the same as before coercion (see Figure 3). If either the slope-change model or the intercept-change model provides a significant improvement in chi-square relative to the baseline model, then that change model is preferred to the baseline model.
The intercept-change model that hypothesizes a change in intercept following victimization. Note that the slope remains constant. This figure is for illustration only and does not depict actual data.

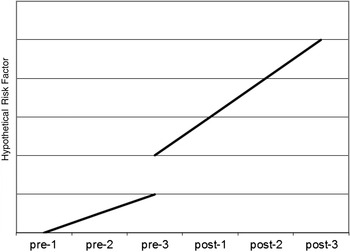
The final model is a combination of the previous two. Model 4 (dual-change) hypothesizes that a change in intercept as well as a change in slope occurs after experiencing coercion. For example, survivors exhibit higher levels of a variable after sexual coercion, and changes in this variable occur at a faster rate after coercion (see Figure 4). If either the slope-change model or the intercept-change model provides a significant improvement in fit over the baseline model, and the dual-change model also provides a significant improvement, then these models are compared. If there is a significant improvement in chi-square, the dual-change model is preferred; otherwise, the simpler, more parsimonious slope-change or intercept-change model is preferred.
The dual-change model that hypothesizes a change in intercept and in slope following victimization. This figure is for illustration only and does not depict actual data.

Each of the outcome variables for internalizing and externalizing behavior, romantic relationship style, sexual behavior, and substance use were modeled separately in this way. Each of the four models was applied to each of the outcome variables, and improvements in model fit provided a test of each hypothesis.
Results
Prior to beginning analyses, the variables in the dataset were assessed for normality of distribution and the presence of outliers. No violations of normality were noted. Outliers were identified and corrected by adjusting scores to fall 1.5 times the interquartile range below the 25th percentile or above the 75th percentile.
The average amount of missing data for all the variables across the five waves of data was 7.9%. Missing data were estimated using multiple imputation procedures. This technique provides more accurate estimates than traditional techniques of handling missing data such as pairwise or listwise deletion (Schafer & Graham, Reference Schafer and Graham2002). We created indicator variables of missingness for each participant and identified variables from the greater project that predicted missingness. When a predictor was found, it was included in the multiple imputation model, so that the creation of the variance–covariance matrix included this information. Such variables included gender, age, ethnicity, parents' marital status, academic grade point average, number of dating partners, and average length of romantic relationships. These procedures follow the recommendations made by Schafer (Reference Schafer1999; http://www.stat.psu.edu/~jls/mifaq.html#model) and Schafer and Graham (Reference Schafer and Graham2002).
Ten multiple imputation datasets were then generated using the software package NORM (Schafer, Reference Schafer1999). This procedure allowed for the imputation of missing data when individual questionnaires were incomplete as well as in the rare case when a participant was absent from an entire wave of data. Imputing and then combining results across multiple data sets also takes into account the uncertainty surrounding the missing data, a technique that is absent from other methods of missing data estimation. After imputation, analyses were conducted and results combined across datasets using the Mplus V.4.0 software (Muthén & Muthén, Reference Muthén and Muthén2006).
Of the 200 participants, 110 (53 males, 57 females) reported experiencing some form of sexual coercion by the end of Wave 5. Forty of these participants reported experiencing the first incident of coercion prior to the 10th grade. At Wave 1, 16 participants reported that the first incident occurred within the previous 12 months. Similarly, an initial incident of sexual coercion was reported by 18 participants between Waves 1 and 2; 8 initial incidents were reported between Waves 2 and 3; 19 initial incidents were reported between Waves 3 and 4; and 9 initial incidents were reported between Waves 4 and 5. Only these 110 participants who reported experiencing sexual coercion were included in the piecewise models.
Differences were examined between adolescents who experienced sexual coercion and those who did not. No differences were observed between these groups at Wave 1 in terms of gender distribution, age, or grade point average. Initial differences between these groups also were examined on the main variables of interest. Differences were found on internalizing and externalizing symptoms, wherein adolescents who experienced coercion reported higher internalizing (M coercion = 0.36, M no-coercion = 0.07), t (196) = −3.43, p = .001, and externalizing symptoms (M coercion = 0.41, M no-coercion = 0.07), t (196) = −2.88, p = .004, at Wave 1 than did adolescents who did not experience coercion. Differences also were found in sexual activity. Adolescents who experienced coercion reported greater frequency of intercourse (M coercion = 1.35, M no-coercion = 1.17), t (184) = −2.19, p = .030, and total number sex partners (M coercion = 0.67, M no-coercion = 0.36), t (187) = −2.05, p = .041, at Wave 1 than did adolescents who did not experience coercion. No differences were found at Wave 1 between groups on level of romantic anxiety, romantic avoidance, number of casual sex partners or on the combined self- and friend report of substance use.
To allow for piecewise modeling, we centered participants' data upon the wave at which they first experienced sexual coercion. For example, if a participant first reported coercion at Wave 3 (the experience having occurred between Waves 2 and 3), she would have two previctimization data points (values at Wave 1 and Wave 2) and three postvictimization data points (values at Waves 3–5). In this way, the data from these participants are aligned and can be used to estimate a previctimization and a postvictimization trajectory even though participants experienced victimization at different times. A strength of the piecewise modeling approach is the ability to utilize data from all participants who experienced victimization regardless of when the incident of coercion occurred. If coercion occurred at the first wave, participants would have no precoercion data points; similarly, if coercion occurred at the fifth wave, no postcoercion data points would be available. These participants' still contribute information to the analyses, however, because the growth trajectories are estimated at the group level. An adolescent who experienced coercion at the first wave would still contribute data to the group-level postcoercion trajectory.
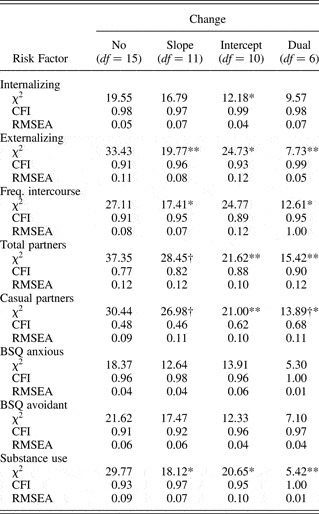
Each model was also estimated with several covariates, including age at victimization, severity of coercive experience, and gender. None of the covariates emerged as significant predictors of either the pre- or postvictimization intercept or slope, and the model that fit the best was the same regardless of whether any of the covariates were included. Thus, none of the covariates appeared to influence the observed changes in risk factors. For simplicity, we have presented the models without covariates. A summary of the model-fitting comparisons for each outcome variable is found in Table 1.
Model-fit statistics and comparison of piecewise models

Note: CFI, comparative fit index; RMSEA, root mean squre error of approximation; BSQ, Behavioral Systems Questionnaire.
†p < .06. Indicates a trend-level improvement in model fit over the no-change model.
*p < .05. Indicates an improvement in model fit over the no-change model.
**p < .01. Indicates an improvement in model fit over the no-change model.
Internalizing and externalizing symptoms
Significant changes in adolescent's externalizing symptoms were observed following an incident of sexual coercion. Both the slope-change model, Δχ2 (4, N = 110) = 13.66, p = .009, and the dual-change model, Δχ2 (9, N = 110) = 25.69, p = .002, provided a significant improvement in fit over the no-change baseline model. Comparing these two models, the dual-change model provided a significant improvement over the slope-change model, Δχ2 (5, N = 110) = 12.03, p = .034, indicating that this model provided the best fit with the data. Thus, adolescents appear to experience an increase in the number of externalizing symptoms after sexual coercion, and the number of these symptoms increased at a faster rate over time.
No significant changes were observed in adolescents' internalizing symptoms. None of the three change models provided a significant improvement in the fit over the no-change baseline model (see Table 1).
Sexual behavior
Several changes in adolescents' sexual behavior were noted following an incident of sexual coercion. For frequency of sexual intercourse, a significant improvement of fit was observed when the slope was allowed to increase following coercion: slope change, Δχ2 (4, N = 110) = 9.71, p = .046. None of the other models provided a significant improvement in fit; thus, the frequency with which adolescents engaged in sexual intercourse increased at an accelerated rate after being sexually coerced.
The number of adolescents' sexual intercourse partners also increased after experiencing coercion. Both the intercept-change model, Δχ2 (5, N = 110) = 15.74, p = .008, and the dual-change model, Δχ2 (9, N = 110) = 21.93, p = .009, provided significant improvement over the no-change baseline model. These two models provided statistically similar fit, Δχ2 (4, N = 110) = 6.19, p = .185, suggesting that the simpler, more parsimonious intercept-change model best described the data. Thus, not only did the frequency with which adolescents engaged in sexual intercourse increase after coercion, the number of different partners with whom they had intercourse also increased and continued to remain higher over time. Further, in regard to the number of casual sex partners reported by adolescents, a near significant improvement over baseline was found for the dual-change model, Δχ2 (9, N = 110) = 16.55, p = .056, suggesting that the new partners with whom adolescents had sexual intercourse included partners whom the adolescents did not know well.
Relational styles
In the case of both anxious and avoidant romantic relationship styles, the no-change baseline model provided adequate fit to the data (see Table 1). In neither case did allowing the slope or intercept to change significantly improve the model fit, suggesting that adolescents did not experience a change in developmental trajectory of their relationship styles after sexual coercion.
Substance use
Adolescents also displayed changes in their substance use and problems associated with substance use after experiencing sexual coercion. Both the slope-change model, Δχ2 (4, N = 110) = 11.65, p = .020, and the dual-change model, Δχ2 (9, N = 110) = 24.35, p = .004, provided significant improvement in fit over the no-change baseline model. In turn, the dual-change model provided significantly improved fit over the slope-change model, Δχ2 (5, N = 110) = 12.70, p = .026, suggesting that adolescents experienced changes in both the intercept and slope of their substance use after sexual coercion. An examination of the means confirmed that adolescents exhibited an increase in the amount of substance use and associated problems after sexual coercion. However, contrary to expectation, the slope for substance use after coercion was negative, indicating a decreasing trajectory. Thus, it appears that adolescents exhibited an initial increase after coercion (intercept), followed by a return to the precoercion trajectory in substance use and associated problems (slope).
Discussion
Many adolescents report experiencing sexual coercion from a peer, and the risk for future experiences rises dramatically after the first incident (Young & Furman, Reference Young and Furman2008). This pattern of increased risk suggests the persistence or even worsening of factors that put adolescents at risk for sexual coercion in the first place. To better understand this pattern, the current study examined changes that occur in known risk factors after experiencing an incident of peer sexual coercion. Specifically, we hypothesized that adolescents would exhibit increases in internalizing and externalizing symptoms, in sexual behavior, and in substance use after being sexually coerced by a peer. Together, the findings suggest the presence of a feedback loop wherein initial risk factors become exacerbated and incur yet higher risk for future victimization.
As expected, adolescents exhibited changes in externalizing symptoms of psychological adjustment. The number of symptoms endorsed by adolescents increased after victimization (intercept) and continued to increase at a faster rate than before victimization (slope). Adolescents may respond to experiencing sexual coercion with increased externalizing behavior as a bid for attention or for help in coping with their experience. These increases in externalizing symptoms are likely associated with the observed increases in substance use (discussed subsequently), which may also represent adolescents' attempts to cope with their experiences.
Consistent with expectation, several aspects of adolescents' sexual behavior increased following an incident of coercion. Specifically, adolescents' frequency of sexual intercourse increased at an accelerated rate (slope) after experiencing coercion, and they engaged in sexual intercourse with a greater number of partners. Further, a trend in the data suggested that adolescents' increasing rate of sexual activity occurs at least in part with casual partners.
The observed increases in sexual behavior may be indicative of a reaction to coerced sexual behavior similar to that seen among survivors of childhood sexual abuse (CSA). Specifically, survivors of CSA have been characterized in terms of traumatic sexualization, a process in which survivors of CSA develop inappropriate and interpersonally dysfunctional attitudes toward sexuality as a result of the abuse (Finkelhor & Browne, Reference Finkelhor and Browne1985). Further, in an effort to gain understanding and control over their experiences, survivors tend to become preoccupied with sex and engage in promiscuous and risky sexual behavior (for further discussion, see Gold et al., Reference Gold, Sinclair and Balge1999).
Although the concept of traumatic sexualization was originally developed to account for CSA, the current findings suggest that a similar process may unfold for survivors of sexual coercion that is peer-initiated or that occurs within an adolescent dating context. Adolescents are just acquiring an understanding of romantic relationships; aggressive or coercive sexual encounters at that time of learning may lead to inappropriate attitudes toward sex and the role of sexual behavior in romantic relationships. Confusion and inappropriate attitudes toward sex may lead adolescents to be less assertive or mindful of their safety in situations where coercion may be more likely to occur (e.g., with casual partners). Further, like victims of CSA, adolescents who experience peer sexual coercion report many of the same emotional sequalae, including feelings of betrayal, fear, guilt, and symptoms of posttraumatic stress (Jones et al., Reference Jones, Hughes and Unterstaller2001; Krakow et al., Reference Krakow, Artar, Warner, Melendrez, Johnston and Hollifield2000). These adolescents may also engage in risky sexual behavior as a means of coping with negative emotions resulting from coercion (Cooper et al., Reference Cooper, Shapiro and Powers1998).
In contrast to traumatic sexualization, some survivors of CSA exhibit an aversive response to sexual intimacy, including feelings of fear, impaired orgasm, dyspareunia, and vaginismus connected with consensual sexual encounters (for reviews of this literature, see Leonard & Follette, Reference Leonard and Follette2002; van Berlo & Ensink, Reference Van Berlo and Ensink2000). Although the current data do not directly support a similar response among adolescents who experienced peer sexual coercion (the intercept and slopes for the sexual behavior variables increased rather than decreased), the piecewise growth trajectories modeled in the current analyses represent group-level behavior. Thus, it is possible that a minority of individuals exhibited decreases in sexual behavior after the coercive incident. Future work should examine individual differences in response to sexual coercion, particularly whether some victims may subsequently experience sexual aversion.
Finally, changes in adolescents' substance use were observed after sexual coercion. The intercept showed an increase, suggesting greater use of alcohol and drugs as well as the problems that occur with such use after sexual coercion (intercept). Given the significant psychological turmoil experienced by survivors of sexual assault (Becker, Skinner, Abel, Axelrod, & Cichon, Reference Becker, Skinner, Abel, Axelrod and Cichon1984; Callahan, Tolman, & Sanders, Reference Callahan, Tolman and Saunders2003), increased substance use may serve as an attempt to lessen the immediate emotional and physiological impact of these experiences (Cooper, Reference Cooper1994; Cooper et al., Reference Cooper, Frone, Russell and Mudar1995, Reference Cooper, Krull, Agocha, Flanagan, Orcutt and Grabe2008). Nevertheless, it is important to note that adolescents' substance use did appear to taper off after the initial increase, possibly representing a return to the precoercion trajectory.
Contrary to expectation, changes were not observed in adolescents' anxious or avoidant romantic styles after experiencing sexual coercion. Romantic styles are theorized to be based on their experiences in current and past romantic relationships and secondarily on their experiences in other types of relationships, such as those with parents and friends (Furman & Wehner, Reference Furman, Wehner, Montemayor, Adams and Gullota1994). Thus, romantic styles reflect an extended learning history of relationship experiences, and are likely to be relatively stable constructs that may be less susceptible to change after a single experience, albeit a significant experience. In addition, approximately 30% of the victimization was perpetrated by a nonromantic peer, such as an acquaintance; such victimization may have less of an impact on romantic styles than victimization from a romantic partner. Nevertheless, styles are also theoretically open to revision with the input of new experiences. Thus, it remains possible that continued experiences of sexual coercion and the accumulation of other negative romantic experiences may produce an intensification of romantic anxiety or avoidance over time. Finally, it is possible that change may be more apparent in patterns of interactions in subsequent relationships than in romantic representations (Collibee & Furman, Reference Collibee and Furman2012). Clearly, future work should continue to focus on the potential impact victimization may have on romantic relationships and representations.
It is interesting that none of the covariates that might be expected to influence change in these risk factors significantly improved the fit of the models. Victimization that occurs at an earlier age or experiences that are more severe may be thought to produce greater change in risk factors both in terms of intercept and slope. Nevertheless, the changes observed in the current study appear to have occurred regardless of gender, age at victimization, and severity of victimization. Specifically in regard to age, previous studies have revealed an inconsistent link between women's age and the onset of experiencing dating violence (see Vezina & Hebert, Reference Vezina and Hebert2007), and the current findings further suggest that changes in risk factors after victimization are not dependent upon the age at which victimization occurs. Of course, a larger sample may facilitate better group comparisons among adolescents experiencing victimization at various ages. Similarly, a larger sample of adolescents may also capture greater variance in the severity of victimization, which may reveal a significant association not observed in the current sample. Future work should continue to explore these possibilities.
The current set of findings supports the idea that adolescents exhibit an intensification of risk factors after experiencing coercion. Although revictimization was not assessed in the current study, the intensification of risk factors suggests the presence of a feedback loop: adolescents with higher levels of risk factors at the outset are more likely to experience coercion in the first place. Then, after experiencing coercion, these adolescents exhibit increases in the behaviors that initially put them at risk. In this way, a potential cycle exists, helping to explain the dramatic increase in risk for victimization following an initial incident (Humphrey & White, Reference Humphrey and White2000; Young & Furman, Reference Young and Furman2008). Each of the risk factors examined in this study may potentially play a role in this feedback loop.
For example, increased externalizing behavior and increased substance use likely contribute hand in hand to increased risk for subsequent coercion. Engaging in such behavior is likely to place adolescents within the company of delinquent peers and potential perpetrators. Within this environment, increased substance use likely identifies adolescents as potential targets of coercion and is likely to further dampen risk detection as well as adolescents' ability to react effectively to potential threats (Gold et al., Reference Gold, Sinclair and Balge1999; Polusny & Follette, Reference Polusny and Follette1995). Similarly, more frequently engaging in sexual intercourse and with a greater number of partners (some of whom appear to be of a more casual acquaintance) likely put adolescents in compromising and risky situations with partners whom they potentially do not know well. The more frequently adolescents engage in these behaviors, the more likely they become to experience subsequent coercion.
Although we suggest the presence of a feedback loop, the current study does not address how such a cycle may have begun. Many circumstances and experiences likely converge to set in motion a pattern of repeated victimization. For example, experiencing sexual abuse at the hands of a trusted adult during childhood would be a likely precipitating event. However, CSA was not examined in the current study, nor were the origins of the risk factors that were studied; rather, we focused upon describing changes in risk factors around the time that sexual coercion also occurred. In this way, we identify a potential process by which the cycle of repeated victimization may be perpetuated through increasing risk.
Limitations and future directions
Several limitations were present in the current study. First, the data were nonexperimental, and causal inferences cannot be drawn. Experiencing peer-initiated sexual coercion may not cause the changes in developmental trajectories that were observed in this study. It is possible that the changes occurred in the risk factors before the sexual coercion. However, the sexual coercion occurred at different waves across individuals, and the changes in risk factor trajectories were centered upon this event. It is not likely that individuals would exhibit relatively simultaneous changes in three separate domains of functioning (sexual activity, substance use, and romantic style) at different time points without some sort of precipitating event such as sexual coercion.
It is possible that changes in one of the variables in this study may influence changes observed in another. For example, changes in internalizing or externalizing symptoms may influence the changes observed in relational style. Moreover, other variables such as symptoms of posttraumatic stress may play a role. Future work should examine more closely the temporal relations among changes in these risk factors and examine potential mediation or moderation.
Second, the current study only examined changes in risk factors that occurred after victimization; we did not directly examine whether these changes were in turn linked to an increase in risk for future victimization. Thus, it is possible that the observed changes in risk factors may occur without influencing future risk for victimization. Nevertheless, given that these factors have been associated with risk for initial victimization in other studies, it seems likely that changes in these behaviors would be related to changes in future risk.
Third, the incidence of CSA was unknown in the current sample. CSA may increase an individual's initial level of risk for experiencing peer sexual coercion in adolescence. The present study was not concerned with the factors that increased initial risk levels, but instead focused upon changes after sexual coercion that occurred in risk factors. However, we cannot rule out the possibility of an interaction in which adolescents who experienced CSA may respond differently to peer sexual coercion than adolescents who did not suffer CSA.
Future work is needed to empirically verify the link between the observed intensification of risk factors and subsequent coercion. Confirmation of this link would serve to clarify the process by which patterns of repeated victimization are established and would suggest targets of intervention to interrupt the cycle of violence. Although the responsibility lies solely with the perpetrator, adolescents who have experienced sexual coercion may benefit from interventions that serve to improve their understanding of romantic relationships and the role of sexuality in establishing intimacy. They may benefit from sexual assertiveness training and other skills-based training focused upon successfully negotiating romantic relationships. Further, interventions should target substance use and provide skills training for effectively assessing and managing risk in social or romantic situations. Interventions that address these risk factors stand to promote resilience among adolescents who have experienced peer-initiated sexual coercion and to interrupt the cycle of violence.