Introduction
Embreyite was described as a new mineral species in old museum collection samples from the Berezovskoe deposit, Central Urals, Russia by Williams (Reference Williams1972). [Note: Williams reports the locality as “Berezov, Siberia”. According to old museum labels, geographical maps and 18–19th century literature, the Urals was typically included in Siberia]. This deposit, discovered in 1745, is located near the city of Ekaterinburg and is currently still being mined for gold. Berezovskoe is world-famous for historical mineralogical objects because of outstanding, very rich and diverse chromate mineralization in the oxidation zone. Berezovskoe is the type locality of five Pb chromate minerals: crocoite (discovered in 1766), vauquelinite (1818), phoenicochroite (1833), embreyite (1972) and cassedanneite (1988). Crocoite was the first new mineral species described from Russia and chromium was discovered in samples of this mineral from Berezovskoe in 1797 by L.N. Vauquelin (see Pekov, Reference Pekov1998 and references therein).
The chemical composition, powder XRD and physical properties were well determined for the type material of embreyite. However, all of the crystals were too low quality for single-crystal X-ray studies. Crystals of the original embreyite were described as thin plates consisting of sub-individuals oriented differently relative to each other and, additionally, split. The idealized formula of the mineral based on chemical data obtained by different methods was reported as Pb5(CrO4)2(PO4)2·H2O. All of the analyses of the type material detected Pb2+, Cr6+, P, O and H as the main constituents. Cu2+ was also identified in the range of 1.2–2.5 (average 1.7) wt.% CuO (Williams, Reference Williams1972). Additional recent studies of embreyite from the Berezovskoe ore field (several mines) and two other Ural localities (Mt. Bertevaya near the city of Nizhniy Tagil and Mt. Sukhovyaz within the city of Verkhniy Ufaley) revealed significant chemical variations (in wt.%): PbO 68.1–77.9, CuO 0.6–6.9, ZnO 0.0–1.9, P2O5 6.4–9.7, As2O5 0.0–2.6 and CrO3 9.1–15.0 (Kleymenov et al., Reference Kleymenov, Pekov, Erokhin and Chukanov2003; Khanin et al., Reference Khanin, Pekov, Pakunova, Ekimenkova and Yapaskurt2015). It was found that embreyite forms a continuous solid-solution series with vauquelinite, despite the difference in powder XRD patterns. Many of the recently obtained electron-microprobe analyses (EMPA) of embreyite are not in good agreement with the original idealized formula of Pb5(CrO4)2(PO4)2·H2O. The following generalized formula was suggested, taking into account all of the additional studies: Pb2[Pbx, $M_y^{2 +} $,□1–x–y]Σ1(CrO4)(PO4)(OH2(x+y)–1,H2O,□)Σ1, where M 2+ = Cu or Zn, □ = vacancy and 0.5 ≤ x + y ≤ 1; simplified as Pb2(M,□)(CrO4)(PO4)X, where M = Pb, Cu or Zn and X = OH, H2O or □ (Khanin et al., Reference Khanin, Pekov, Pakunova, Ekimenkova and Yapaskurt2015). However, the latter formula could not be proven due to the lack of a single-crystal XRD study.
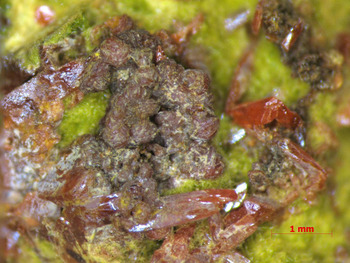
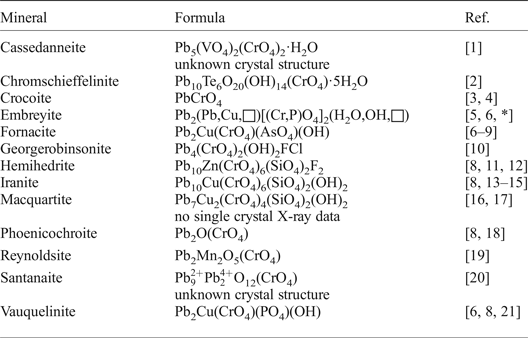
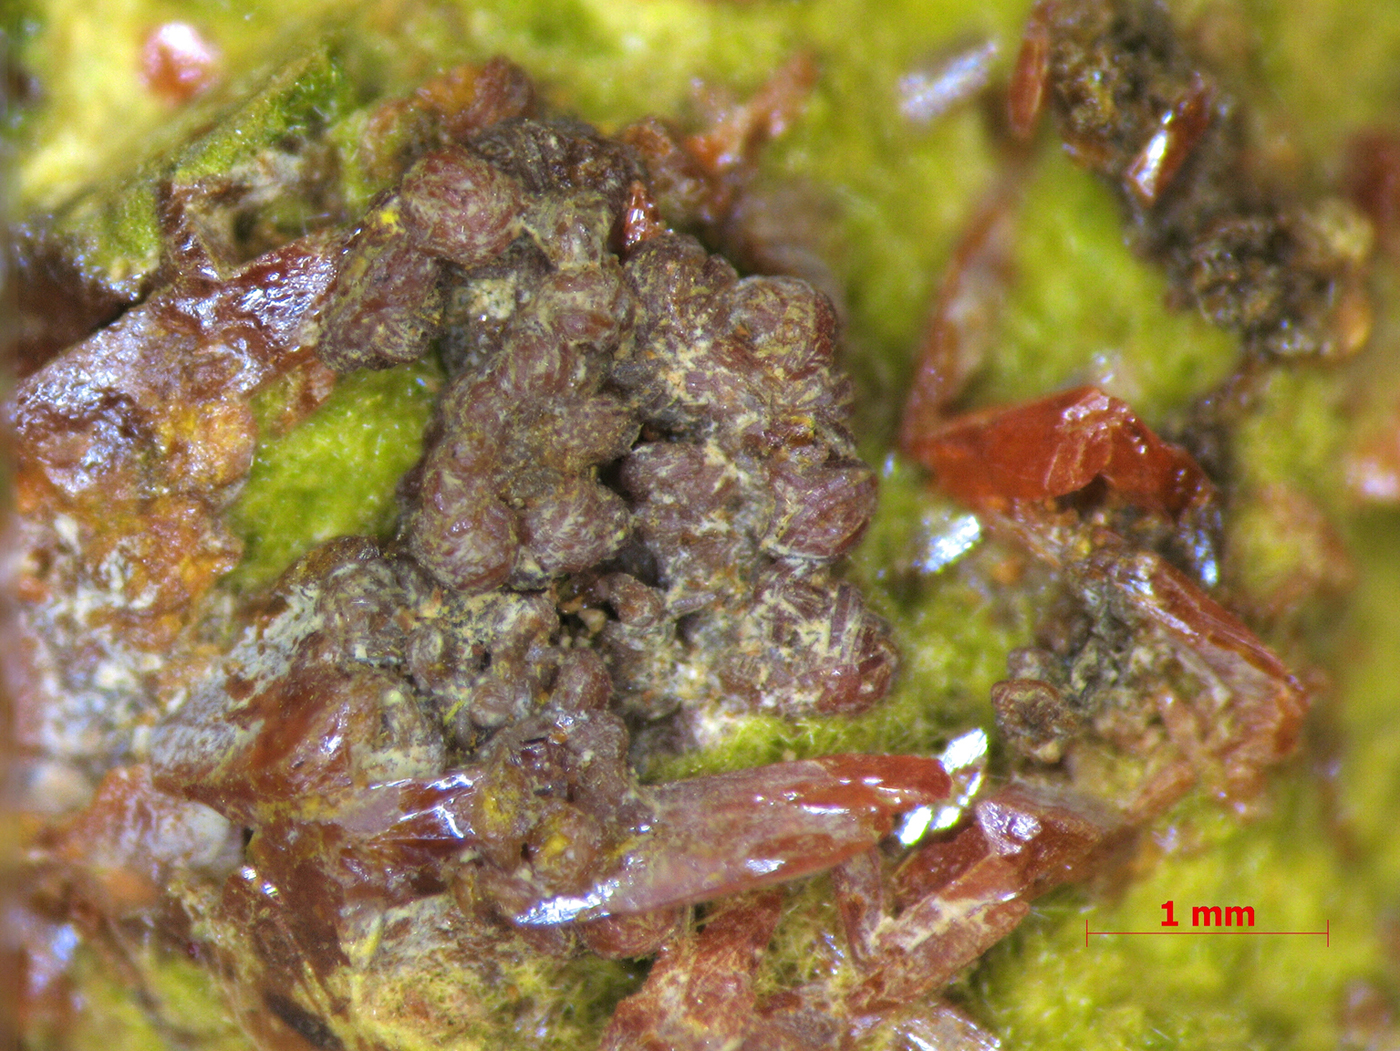
Embreyite is a member of a rather small group of lead-containing minerals with (CrO4)2– anions (Table 1). Note that Pb chromates are the richest group for chromate minerals in general. Chromium mineral diversity is on the lower limit of the common trend as a function of the crustal abundance of Cr (Christy, Reference Christy2015). A relatively small number of described chromate mineral species to date can be explained generally by the instability of the (CrO4)2– anion and the tendency of Cr6+ to reduce under conventional natural conditions. There have been several attempts to study the crystal structure of embreyite during the more than 40 years since its discovery. They were all unsuccessful due to the low quality of crystals. Crystals suitable for a structure determination were found in samples (Fig. 1) collected in 2011 at Berezovskoe by I.V.P. Herein, we report the determination of the structural features of embreyite and discuss relationships with the other Pb chromate minerals and synthetic phases.
Aggregates of brown-orange embreyite crystals (in the centre) with crocoite (bright orange prismatic crystals) and pyromorphite (yellow-green) around. Field of view: width = 5.8 mm. Photo: A.V. Kasatkin.
List of Pb chromate minerals.
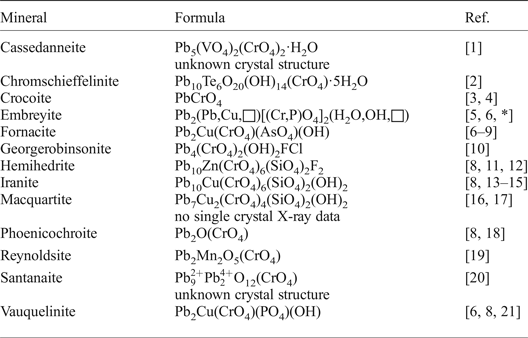
References: [1] – Cesbron et al. (Reference Cesbron, Giraud, Pillard and Poullen1988); [2] – Kampf et al. (Reference Kampf, Mills, Housley, Rumsey and Spratt2012a); [3] – Quareni and de Pieri (Reference Quareni and de Pieri1965); [4] – Effenberger and Pertlik (Reference Effenberger and Pertlik1986); [5] – Williams (Reference Williams1972); [6] – Khanin et al. (Reference Khanin, Pekov, Pakunova, Ekimenkova and Yapaskurt2015); [7] – Cocco et al. (Reference Cocco, Fanfani and Zanazzi1967); [8] – Cesbron and Williams (Reference Cesbron and Williams1980); [9] – Ksenofontov et al. (Reference Ksenofontov, Kabalov, Pekov, Zubkova, Ekimenkova and Pushcharovskii2014); [10] – Cooper et al. (Reference Cooper, Ball, Hawthorne, Paar, Roberts and Moffatt2011); [11] – Williams and Anthony (Reference Williams and Anthony1970); [12] – McLean and Anthony (Reference McLean and Anthony1970); [13] – Bariand and Herpin (Reference Bariand and Herpin1963); [14] – Adib and Ottemann (Reference Adib and Ottemann1970); [15] – Yang et al. (Reference Yang, Sano, Eichler, Downs and Costin2007); [16] –Williams and Duggan (Reference Williams and Duggan1980); [17] – Cooper and Hawthorne (Reference Cooper and Hawthorne1994); [18] – Williams et al. (Reference Williams, McLean and Anthony1970); [19] – Kampf et al. (Reference Kampf, Mills, Housley, Bottrill and Kolitsch2012b); [20] – Mücke (Reference Mücke1972); [21] – Fanfani and Zanazzi (Reference Fanfani and Zanazzi1968); * – this work.
Experimental
Sample description
The sample used in this study was found in the ‘Krokoitovyi Shurf’ (Crocoite Pit) at Mt. Uspenskaya in the area of the former Tsvetnoy Mine, the type locality of crocoite. This mine was operated from 1752 to 1802, and is situated in the central part of the Berezovskoe ore field. The richest secondary mineralization is located at a depth of ~12 m below surface. It is distributed in an area consisting mainly of partially weathered beresites and listwanites (Fettes and Desmons, Reference Fettes and Desmons2007) with numerous quartz veins containing abundant cavities. Some of the latter are formed after dissolved pyrite, galena and ‘fahlerz', as well as cavernous open-work polycomponent pseudomorphs consisting of the supergene minerals. The assemblage of secondary minerals associated intimately with embreyite examined in the course of this study includes crocoite, vauquelinite (two morphological and colour varieties: greenish-black spherical crystal clusters and olive-green fine-grained crusts and kidney-shaped aggregates), pyromorphite, goethite (limonite) and undetermined clay mineral(s). Embreyite occurs as flattened, coarse hexagonal, typically roundish, disc-like crystals up to 0.3 mm and, rarely, up to 1 mm across (Fig. 1). They are usually divergent, resembling an open book, and combined in groups or crusts up to 3 mm × 3 mm and up to 1 mm thick. The mineral is orange to yellow orange, sometimes brownish-yellow, with a strong greasy lustre. Embreyite is one of the latest minerals of this assemblage overgrowing crocoite and pyromorphite.
Chemical composition
The chemical composition was determined for the embreyite crystal used for the structure determination on a Jeol 733 electron microprobe instrument operating in energy-dispersive mode with an accelerating voltage of 20 kV, a beam current of 2 nA and a beam diameter of 5 µm. The X-ray acquisition live-time was 30 s. The following standards were used: PbTiO3 (Pb), Cu metal (Cu), chromite USNM 117075 (Cr) and LaPO4 (P). The average (four spot analyses) chemical composition (wt.%, ranges in parentheses) is: PbO 74.46 (73.79–75.04), CuO 1.38 (1.18–1.51), CrO3 13.40 (13.06–13.71) and P2O5 7.96 (7.78–8.10), total 97.20. Contents of other elements with atomic numbers higher than carbon are below detection limits. The H2O content was not determined because of paucity of the material. The empirical formula calculated on the basis of 4 O atoms per formula unit (apfu) (without taking into account the possible presence of some H2O: see below) is: Pb1.29Cu0.07Cr0.52P0.43O4.
Infrared spectroscopy
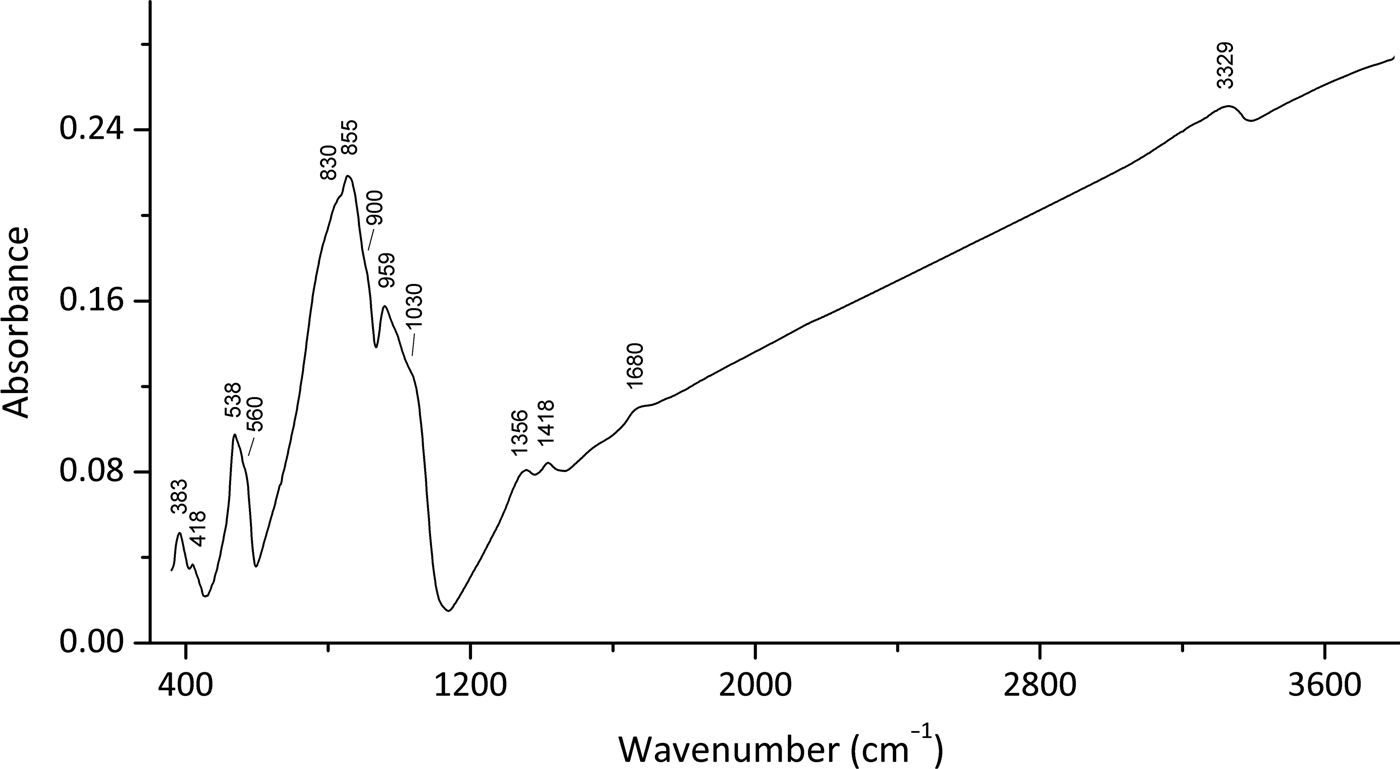
In order to obtain the infrared (IR) absorption spectrum (Fig. 2), a powdered sample of embreyite was mixed with dried KBr, pelletized and analysed using a Bruker ALPHA FTIR spectrometer with a resolution of 4 cm–1 and 16 scans. The IR spectrum of a pellet of pure KBr was used as a reference.
Infrared (FTIR) spectrum for the embreyite sample studied in this work.
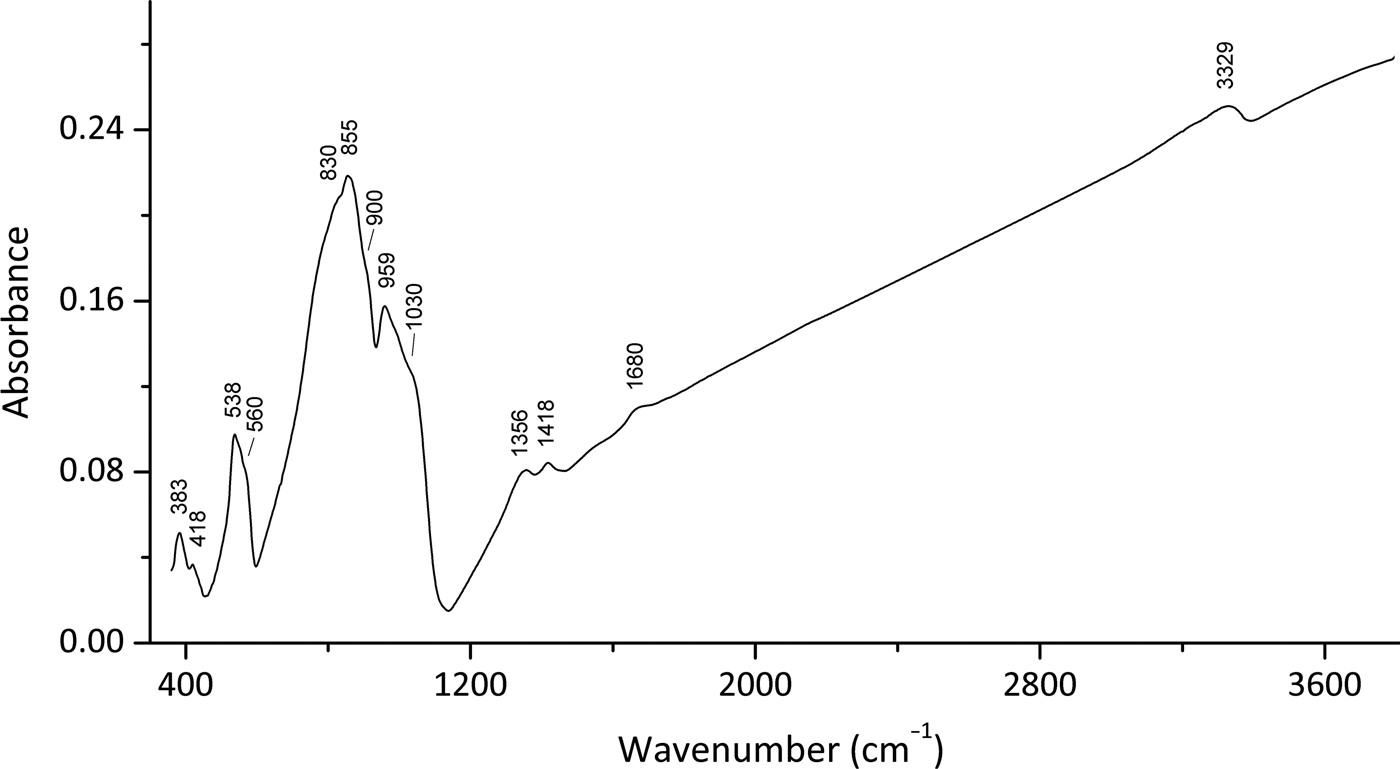
Note, most of the Pb–O vibrations are expected to be in the region below 300 cm–1 and were not registered in the region of the IR spectra studied. Absorption bands in the IR spectrum of embreyite and their assignments are (cm–1; s – strong band, sh – shoulder): 3329 and diffuse absorption between 3100 and 3300 [O–H stretching vibrations of H2O molecules], 1680w [bending vibrations of H2O molecules], 1418, 1356 [probably vibrations of H+ cations], 1030sh, 959s [ν3(F2) – asymmetric P–O stretching vibrations of  ${\rm PO}_{\rm 4}^{{\rm 3\ndash}} $ anions], 900sh [ν1(A1) – symmetric P–O stretching vibrations of
 ${\rm PO}_{\rm 4}^{{\rm 3\ndash}} $ anions], 855s, 830sh [ν3(F2) – asymmetric Cr–O stretching vibrations of
 ${\rm CrO}_{\rm 4}^{{\rm 2\ndash}} $ anions], 560sh, 538 [triply degenerate ν4(F2) O–P–O bending mode of
 ${\rm PO}_{\rm 4}^{{\rm 3\ndash}} $ anions], 418w, 383 [lattice modes involving ν2(E) O–P–O bending vibrations, possibly combined with vibration modes of H2O molecules]. The band assignments were done according to Nakamoto (Reference Nakamoto2009) and Chukanov and Chervonnyi (Reference Chukanov and Chervonnyi2016).
Powder XRD
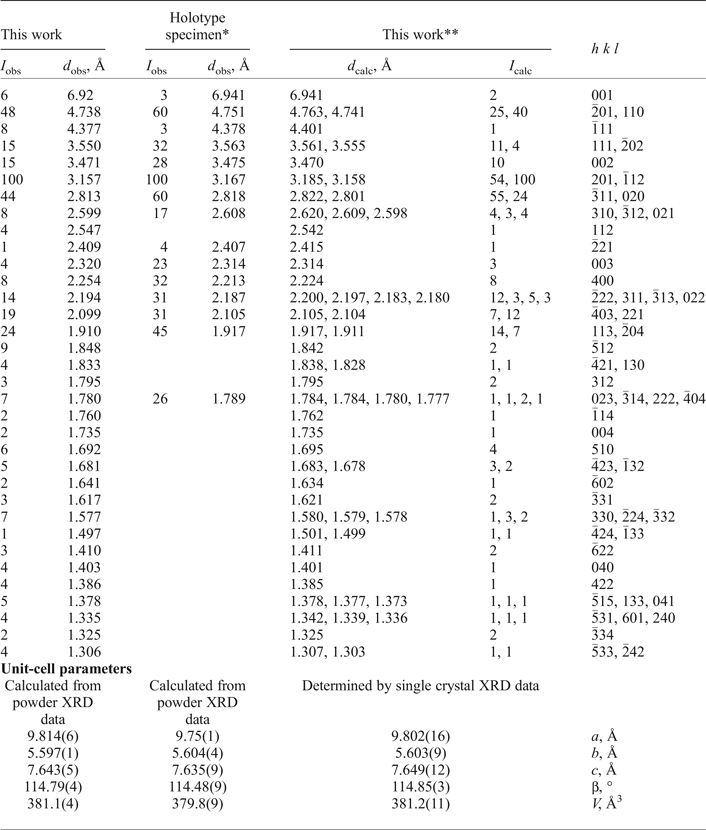
Powder XRD data of embreyite were collected with a Rigaku R-AXIS Rapid II single-crystal diffractometer equipped with cylindrical image plate detector using Debye-Scherrer geometry (d = 127.4 mm, CoKα radiation and λ = 1.7890 Å). The powder XRD pattern and unit-cell parameters refined from the powder data are given in Table 2 and compared with the data for the holotype sample reported by Williams (Reference Williams1972).
Powder XRD data and unit-cell parameters of embreyite.
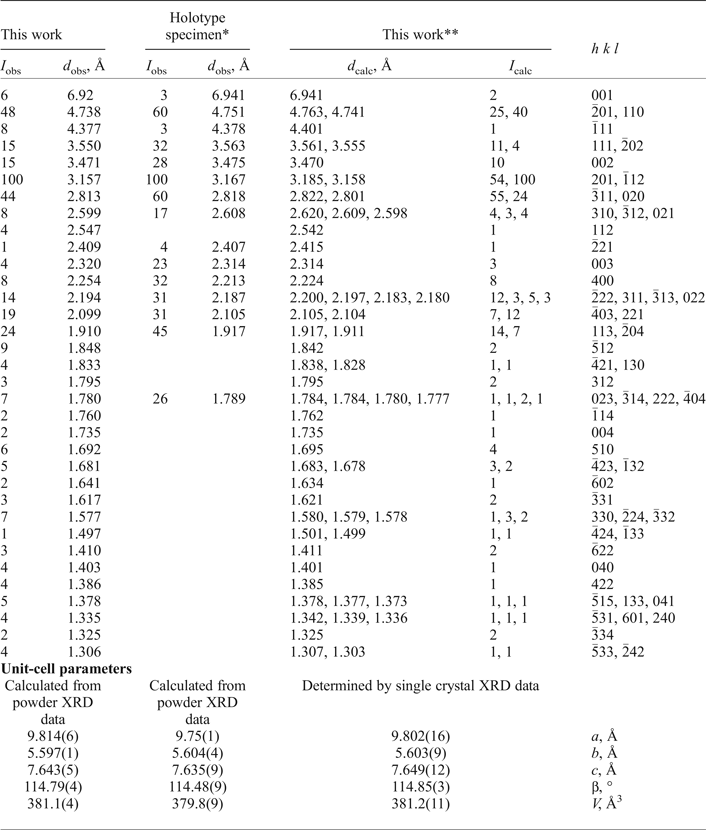
*Holotype specimen: I obs and d obs values are after Williams (Reference Williams1972) and unit-cell parameters provided in this table were refined using the hkl indices of our calculated XRD pattern (the unit-cell data reported by Williams (Reference Williams1972) are: a = 9.755(3), b = 5.636(3), c = 7.135(3) Å, β = 103.8(3)° and V = 382 Å3)
**XRD pattern calculated from our crystal-structure data.
Single-crystal XRD
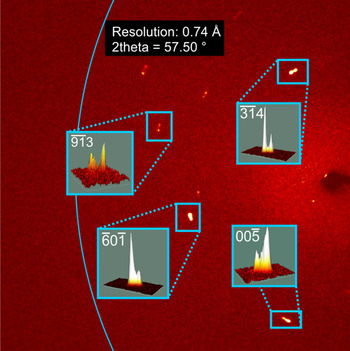
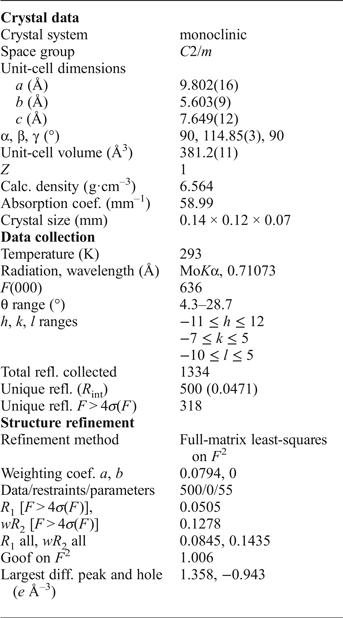
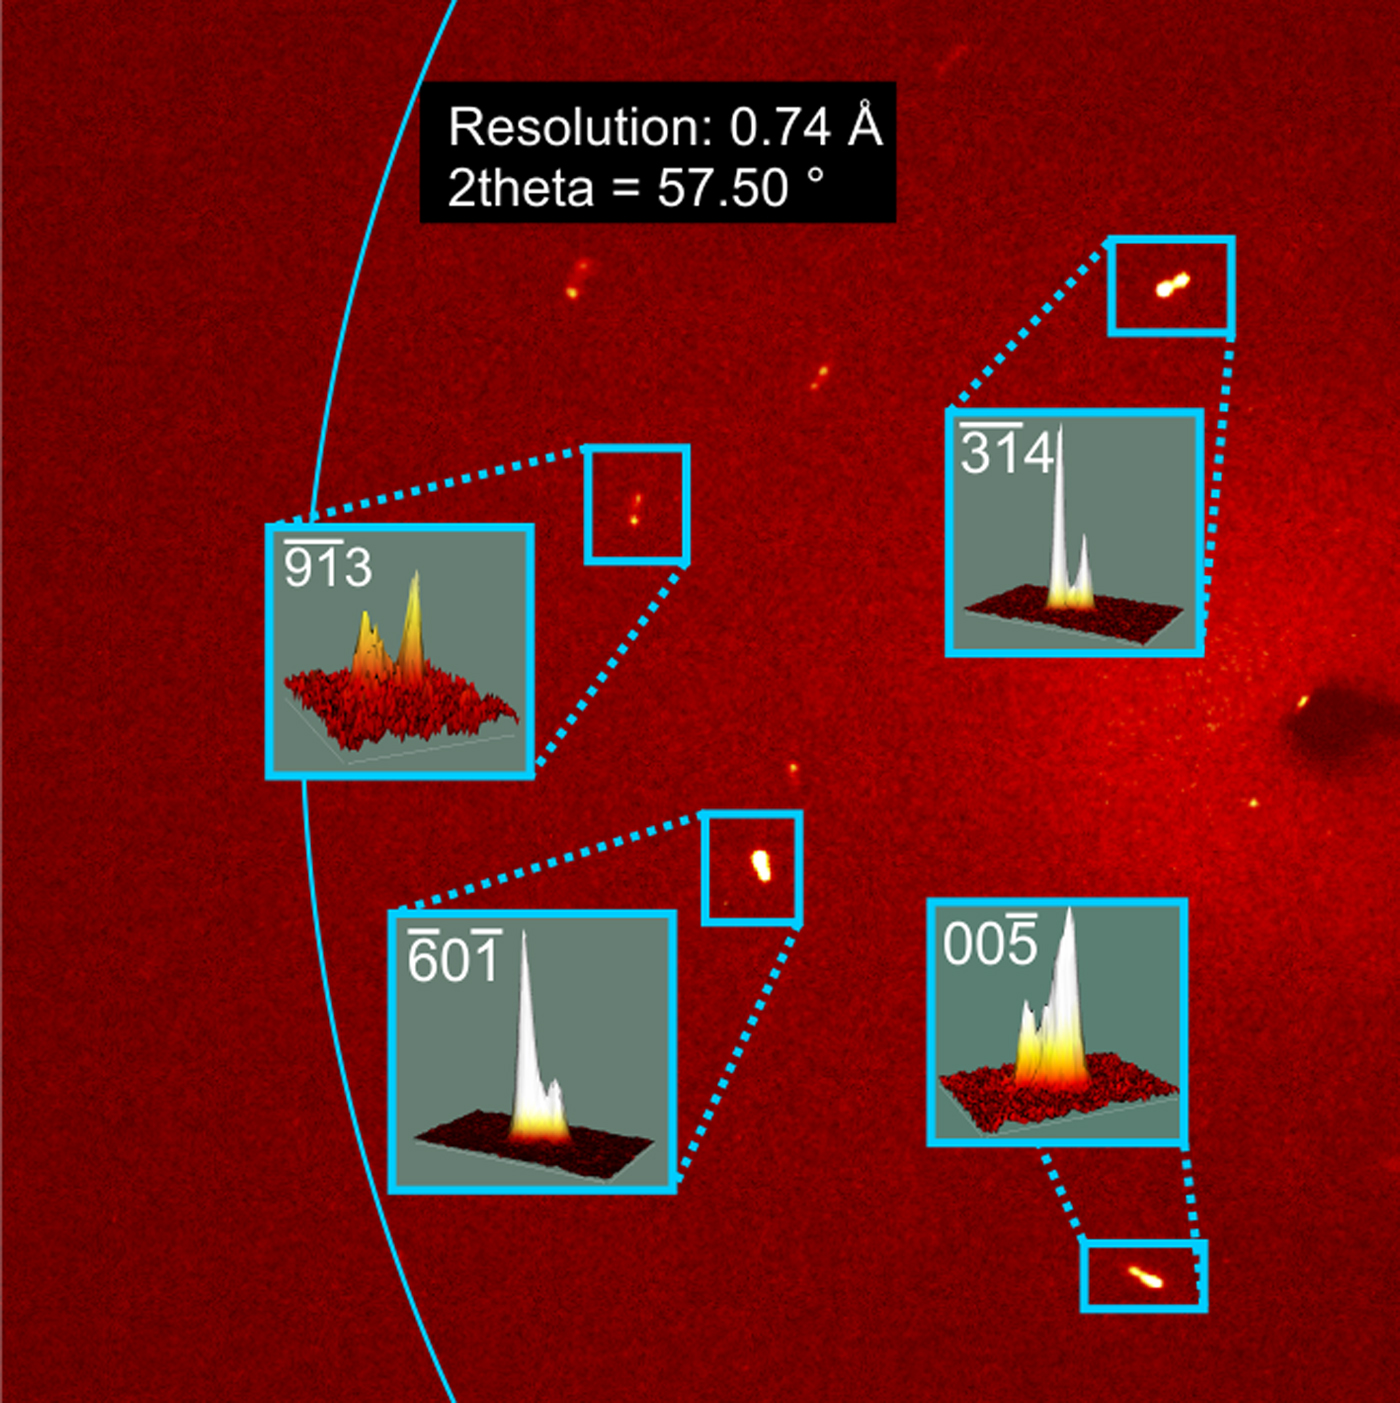
Single crystals of embreyite were examined under an optical microscope, mounted on glass fibers with epoxy and tested on a Bruker APEX DUO diffractometer equipped with a micro-focus X-ray tube operated with MoKα radiation (λ = 0.71073 Å) at 50 kV and 40 mA. An examination of XRD frames of the tested crystals cut from embreyite intergrowths revealed split reflection spots of weak intensities, even after a long exposure time. The quality of the crystals of embreyite made the solution of the crystal structure challenging. An orange translucent platy crystal, 0.14 mm × 0.12 mm × 0.07 mm demonstrating the best diffraction pattern (Fig. 3) was chosen for full XRD collection. More than a hemisphere of XRD data were collected with a frame width of 0.5° in ω and 60 s counting time for each frame. The data were integrated and corrected for absorption using a multi-scan-type model using the Bruker programs APEX and SADABS.
Typical XRD frame of embreyite collected with width = 0.5° and 60 s of exposure.
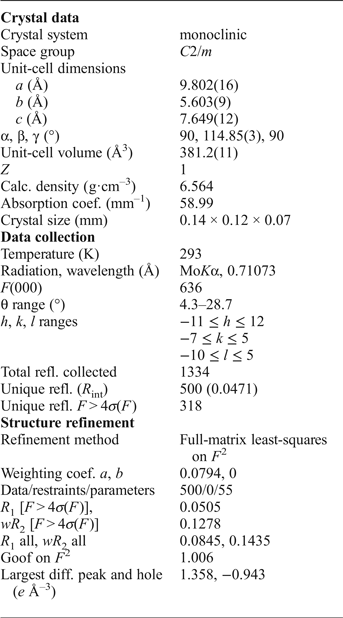
The unit-cell parameters of embreyite were determined and refined by the least-squares technique on the basis of 1334 reflections with 2θ in the range of 8.6–57.4°. The obtained unit-cell parameters (Table 2, 3) are in a good agreement with those previously reported in the P21/m space group by Williams (Reference Williams1972). The |E2–1| parameter was equal to 0.899, which indicated high probability of a centrosymmetric space group confirmed by subsequent structure solution and refinement. The crystal structure of embreyite was solved in C2/m using direct methods and refined to R 1 = 0.050 by means of the SHELX program package (Sheldrick, Reference Sheldrick2015). Crystallographic information is summarized in Table 3. Attempts to solve and refine the crystal structure in the higher symmetry space group, R  ${ \bar {\rm 3}}$m (a = 5.618(9), c = 20.80(4) Å and V = 569(2) Å3), reported for the structure of rhombohedral polymorph of Pb4(PO4)2(CrO4) (Barbier and Maxin, Reference Barbier and Maxin1995) led us to a worse agreement between the crystallographic model and the experimental XRD data (R 1 = 0.072) and in addition significant disorder in the heteropolyhedral layer (see below) not observed in C2/m. Various twin laws in both space groups were tried but none of them appeared to be successful and improved the refinement. Therefore, we provide here a description of the structure of embreyite in the monoclinic space group C2/m as it resulted in a lower R-factor, very good fit with powder XRD patterns, better displacement parameters of atoms, and physically realistic interatomic bond-distance values.
Crystallographic data for embreyite.
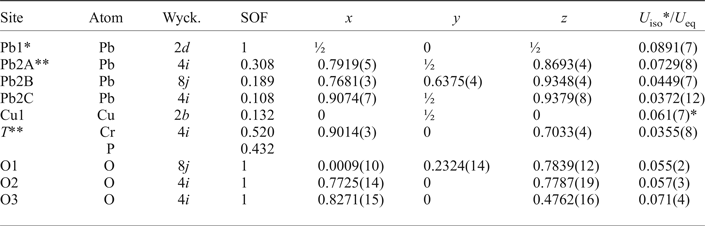
A procedure of the structure refinement of embreyite included the following steps: (1) an initial group of the atom sites was determined by direct methods; (2) missing atoms were found from the difference-Fourier maps; (3) the structural model was refined until the atomic arrangements became reasonable; and (4) site occupancies were adjusted in accordance with the chemical data. All positions except the low occupied Cu one (site-occupation factor = 0.132) were refined anisotropically. Final atom coordinates and site-occupation factors are represented in Table 4. Selected bond distance values are in Table 5.
Fractional atomic coordinates, site occupancy factors (SOF), bond-valence sums (vu) and equivalent or isotropic displacement parameters (Å2) of atoms in the structure of embreyite.
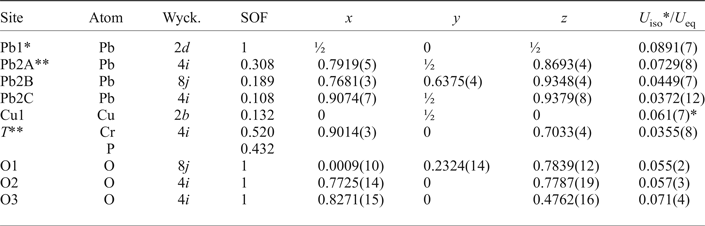
*Bond valence sum is 2.14 vu.
**Overall weighted bond-valence sums for disordered sites: Pb2 = 1.84 vu, T = 5.52 vu.
Wyck – Wyckoff positions.
Selected interatomic distances in Å in the structure of embreyite.
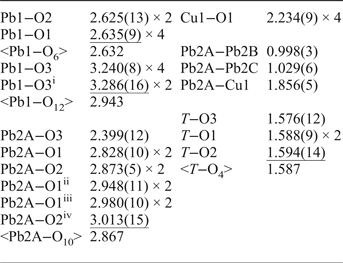
Symmetry codes: (i) −x+1, −y, −z + 1; (ii) x + ½, −y + ½, z; (iii) −x + 1, −y + 1, −z + 2; (iv) −x + 3/2, −y + ½, −z + 2.
Results
Cation coordination
There are one fully occupied Pb1 site, one tetrahedrally coordinated T site and four oxygen sites in the heteropolyhedral layer in the crystal structure of embreyite. In the disordered interlayer, there is one split Pb2 site and one low occupancy Cu1 position.
Heteropolyhedral layer
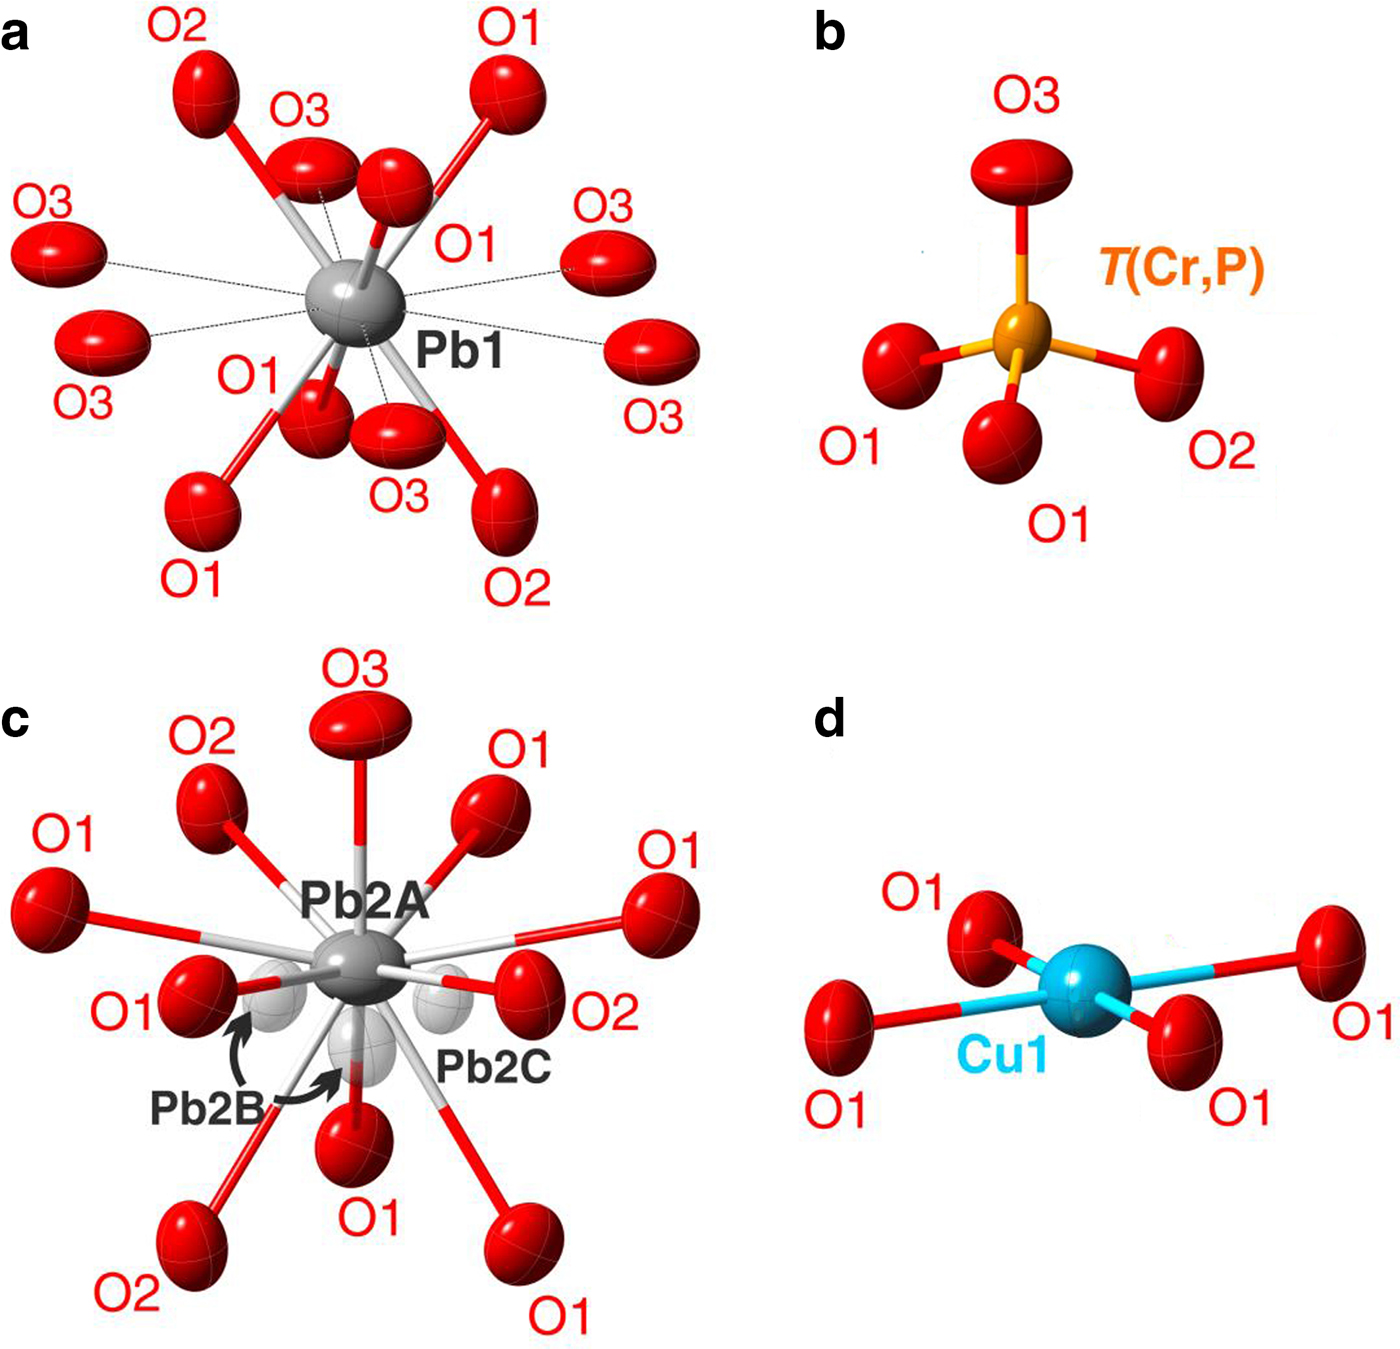
The Pb1 site adopts a 6-fold coordination in the first coordination sphere with six short and strong Pb1–O bonds with the average < Pb1–O6> bond distance of 2.63 Å (Table 5). The resultant Pb1O6 polyhedron can be described as a distorted octahedron (Fig. 4a). There are six more additional oxygen atoms located at larger distances from 3.24 to 3.29 Å thus forming distorted Pb1O12 cuboctahedron. The average < Pb1–O12> bond length of the 12-coordinated Pb1-centred polyhedron is 2.94 Å.
Geometry of the cationic sites in the crystal structure of embreyite. Displacement ellipsoids are drawn at the 50% probability level.
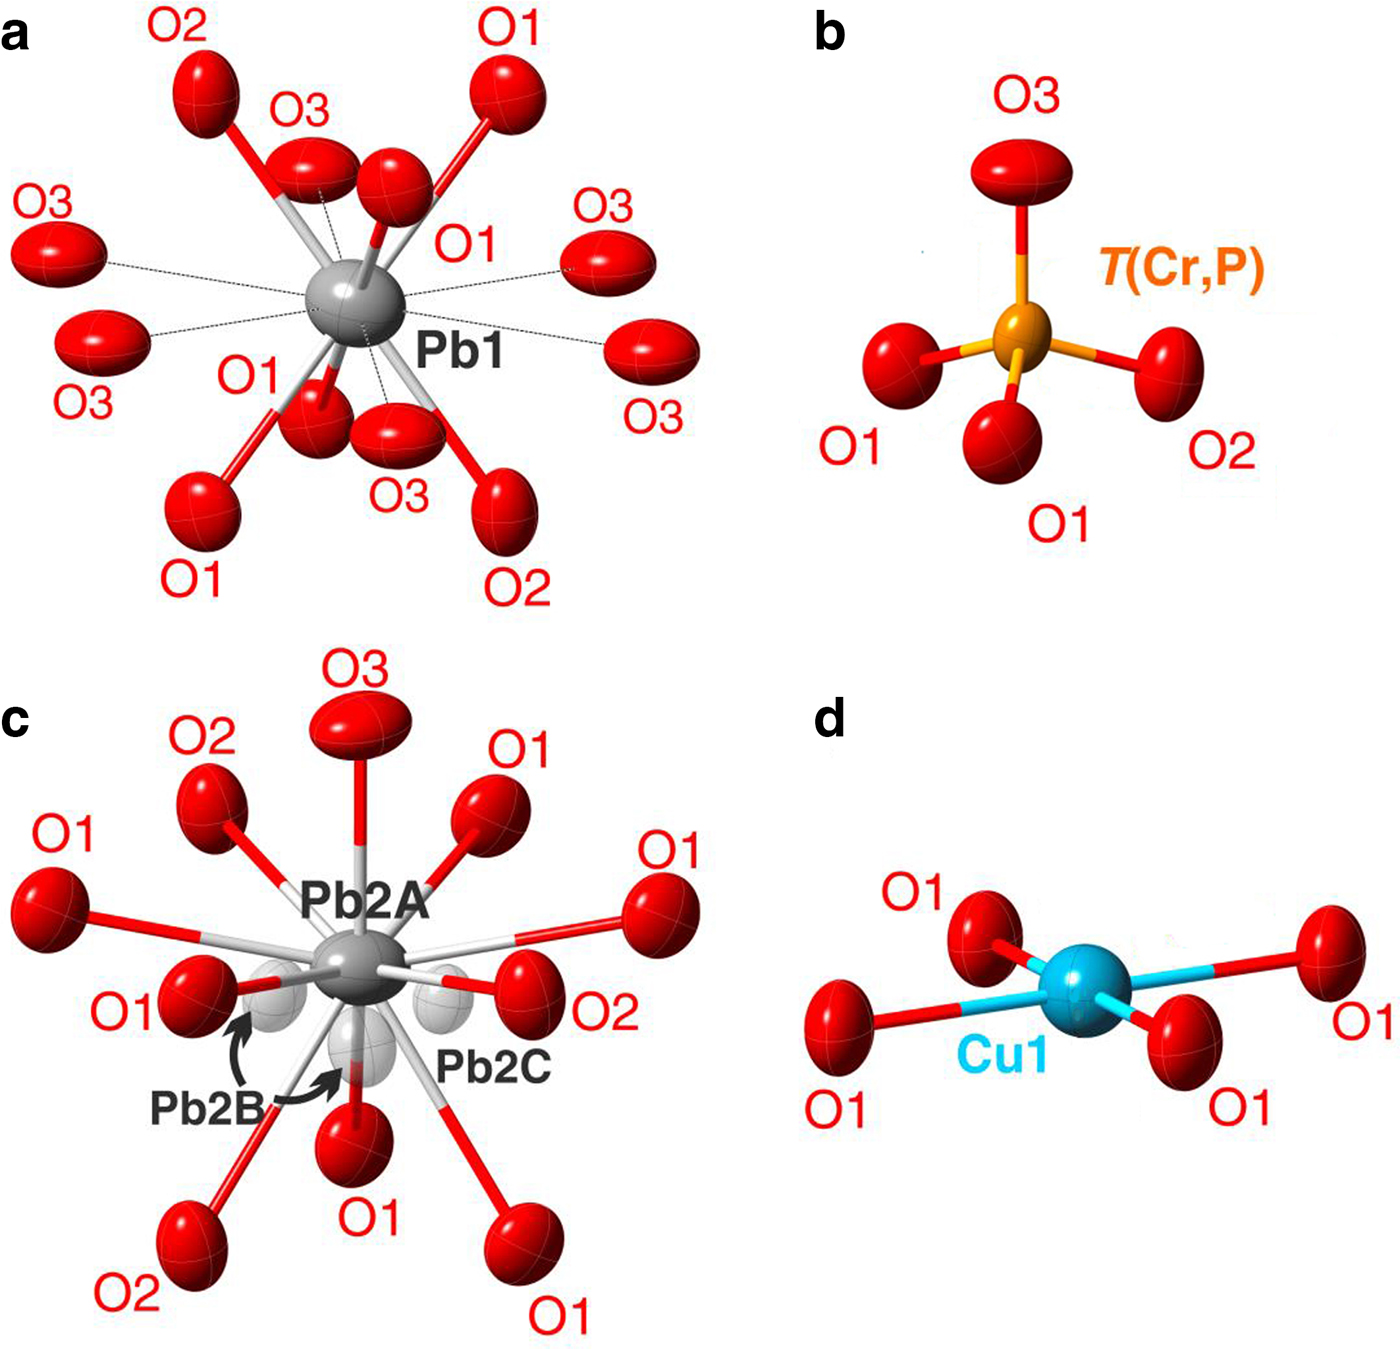
One symmetrically independent tetrahedral T site is surrounded by four O atoms (Fig. 4b). Calculations of the mineral formula on the basis of O = 4 apfu provided the sum of tetrahedral cations ( ${\rm Cr}_{0.52}^{6 +} $ and
 ${\rm P}_{0.43}^{5 +} $) is < 1. The latter prompted us to consider this site as partially occupied. Unconstrained refinement of the occupancies of the T site led to (Cr0.520P0.432□0.048). Structural models containing partially occupied tetrahedral sites were reported previously for minerals and synthetic compounds, e.g. in byzantievite, Ba5(Ca,REE,Y)22(Ti,Nb)18(SiO4)4[(PO4),(SiO4)]4(BO3)9O21[(OH),F]43(H2O)1.5 (REE = rare-earth minerals) (Sokolova et al., Reference Sokolova, Hawthorne, Pautov and Agakhanov2010) and synthetic AMo3P5.8Si2O25 (A = Rb or Tl+) (Leclaire et al., Reference Leclaire, Monier and Raveau1984), where a deficiency of P5+ is observed in PO4 groups to make the formula electroneutral. To the best of our knowledge the crystal structure of embreyite is the first observation in minerals of a mixed tetrahedral site occupied by Cr6+ and P5+. The bond-valence sum (BVS) calculations for the T site confirm a mixed 5+/6+-valence occupancy providing the weighted bond-valence sum of 5.52 valence units (vu). The average <T–O> bond length value is 1.59 Å.
Disordered interlayer
The Pb2 site is split over Pb2A, Pb2B and Pb2C positions in the crystal structure of embreyite. Disorder of Pb atoms in the interlayer is rather typical for lead oxysalt layered structures and has been reported e.g. for hydrocerussite (Martinetto et al., Reference Martinetto, Anne, Dooryhée, Walter and Tsoucaris2002), rickturnerite (Rumsey et al., Reference Rumsey, Krivovichev, Siidra, Kirk, Stanley and Spratt2012) and Pb21[Si7O22]2[Si4O13] (Siidra et al., Reference Siidra, Zenko and Krivovichev2014b). Refinement of the occupancies of the three Pb2 sites with the total occupancy of 0.605 revealed the presence of a vacancy here. Most probably, it can be filled by H2O molecules evidenced by the presence of typical absorption bands at ~3300 and ~1600 cm–1 in the IR spectrum (Fig. 2). We suggest that the disordered Pb2 sites are the only possible sites for H2O in the structure of embreyite as we were unable to find other prominent peaks on difference-Fourier maps that could be interpreted as positions of water molecules. A similar example of complicated water site localization has been reported recently for gianellaite, [(NHg2)2](SO4)(H2O)x (Cooper et al., Reference Cooper, Abdu, Hawthorne and Kampf2016) where H2O could not be localized in the latter from structural data. However, the presence of water was undoubtedly indicated by absorption bands in the IR spectra.
The most electron-dense Pb2A site is symmetrically coordinated by ten O atoms located at distances varying from 2.40 to 3.01 Å with the average < Pb2A–O10> bond distance of 2.87 Å (Fig. 4c).
The chemical analysis reveals  ${\rm Cu}_{0.07}^{2 +} $ pfu. A small amount of copper was assigned to the Cu1 site, which can be also considered as one of the Pb2 split positions. Geometrical analysis demonstrates square coordination environments for the Cu1 site (Fig. 4d) with oxygen atoms located at a distance of 2.23 Å. However, these long bond-distance values should not be considered literally due to the strong disorder. We suggest that the Cu1 site is the most favoured position for a small amount of Cu in the crystal structure of embreyite because of its typical square coordination environment and structural relation with vauquelinite, discussed below.
The final refinement of the structure of embreyite led to the structural formula of [Pb0.794Cu0.066□0.140–x]{[Pb0.500][(Cr0.520P0.432□0.048)O4)]}(H2O)n (the presence of H2O is assumed by IR data), which is in a good agreement with the electron microprobe data on the basis of 4 O atoms per formula unit, i.e. (Pb0.79(1)Cu0.07(2))Σ0.86(Pb0.50(2))Σ0.5(Cr0.52(2)P0.43(2))Σ0.95O4.
Crystal structure: description and comparison with palmierite-type compounds
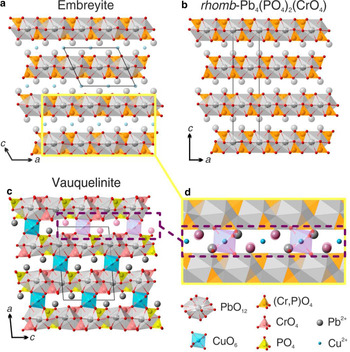
The crystal structure of embreyite is based on {Pb[(Cr,P)O4]2]} layers formed by corner-sharing mixed chromate–phosphate tetrahedra and Pb-centred polyhedra (Fig. 5a). The interlayer space is filled by disordered Pb2+ and Cu2+ cations. Generally, the crystal structure of embreyite can be referred to the structural type of palmierite, K2Pb(SO4)2 (Moore, Reference Moore1973; Tissot et al., Reference Tissot, Rodriguez, Sipola and Voigt2001) built up from stacking of layers parallel to (001) and formed by corner-sharing distorted Pb2+ polyhedra and SO4 tetrahedra with K+ cations in the interlayer. A variety of cations in different oxidation states are involved in homovalent or heterovalent substitutions observed in the large number of palmierite-type structures with different structural distortions (Lazoryak, Reference Lazoryak1996).
General views of the crystal structures of (a) embreyite, (b) synthetic rhomb-Pb4(PO4)2CrO4 and (c) vauquelinite. Projection of the interlayer block of the structure of vauquelinite on the structure of embreyite is shown in (d).
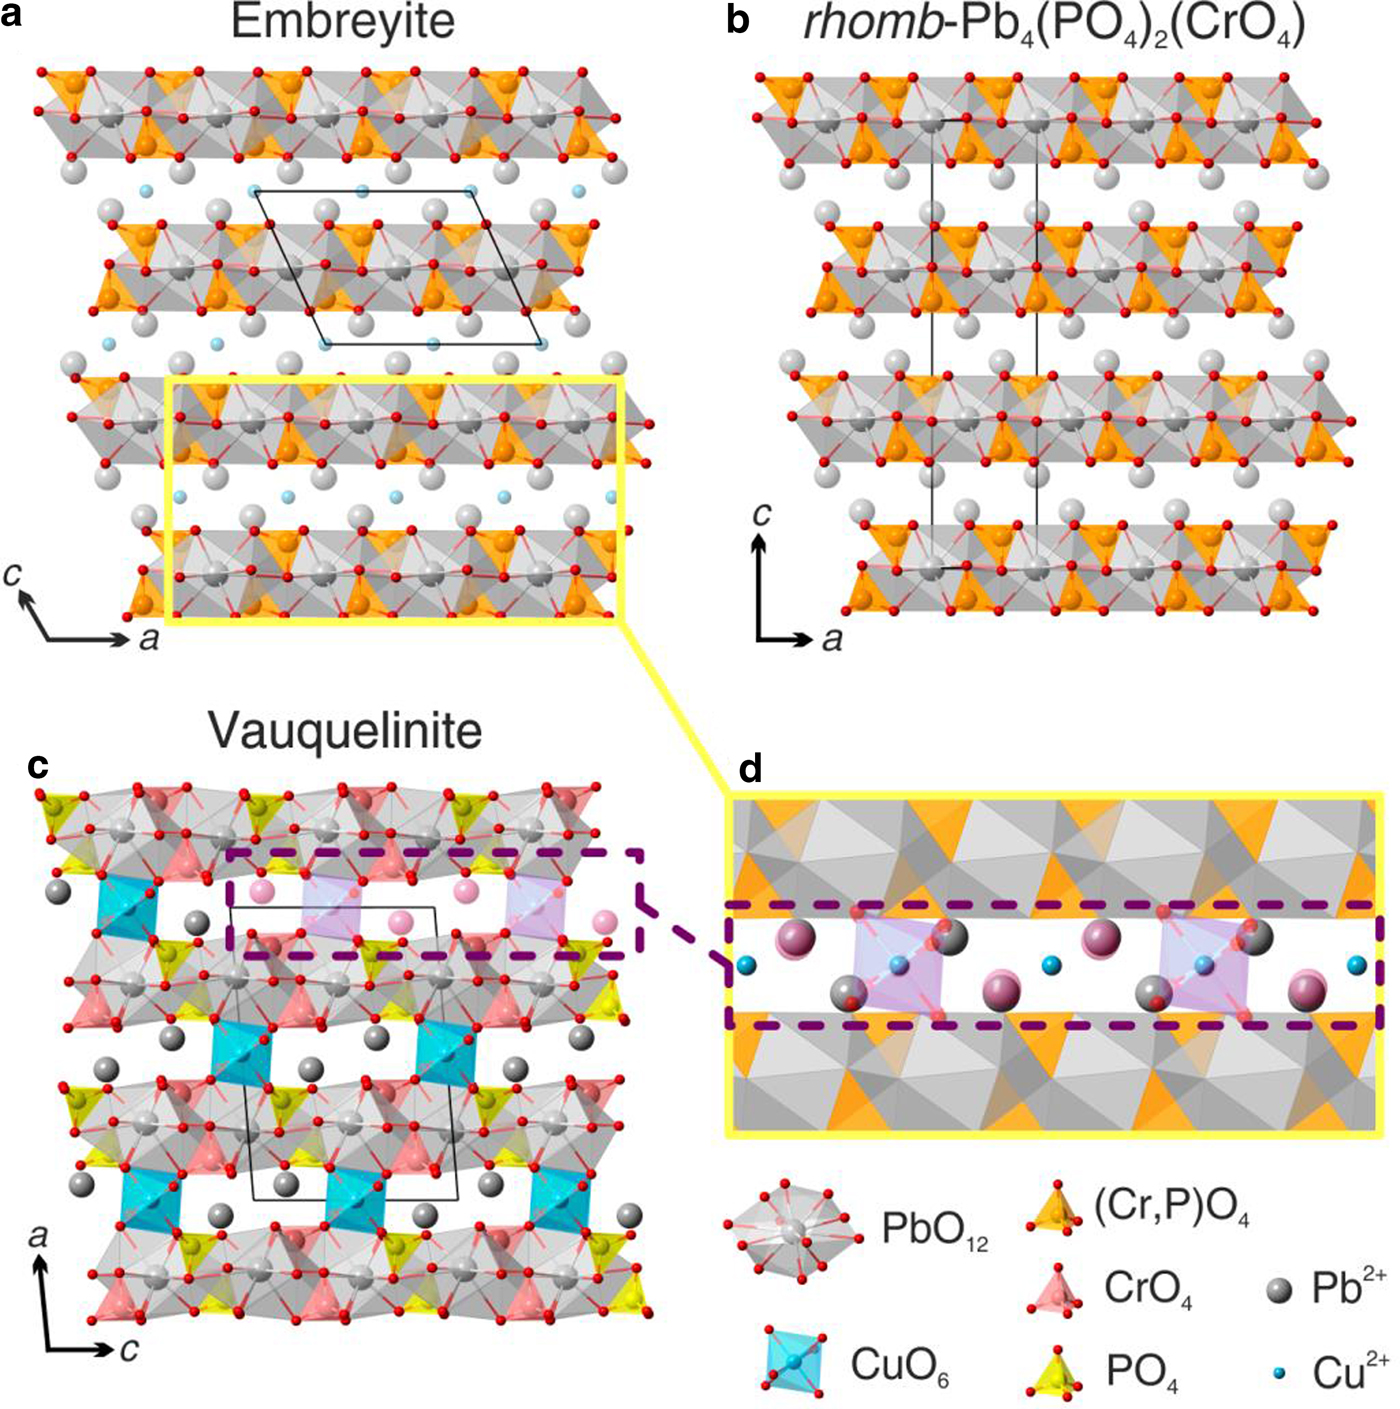
It is worth considering the low-temperature rhombohedral modification of Pb4(PO4)2(CrO4) chemically close to embreyite that has been studied by neutron powder diffraction (Barbier and Maxin, Reference Barbier and Maxin1995). The rhombohedral structure of Pb4(PO4)2(CrO4) (R  $\bar 3$m, a = 5.5403(1), c = 20.4999(4) Å and V = 544.94(1) Å3) is based upon stacking along the c axis of layers composed of (P,Cr)O4 and PbO12 polyhedra with partially occupied Pb2+ sites in the interlayer space, similar to the palmierite-type monoclinic structure of embreyite (Fig. 5b). The structural formula of the rhombohedral modification of Pb4(PO4)2(CrO4) according to the published data can be written as 2 × [Pb0.83□0.17][Pb0.5(PO4)0.67(CrO4)0.33], similar to the one determined for embreyite, [Pb0.794Cu0.066□0.140–x]{[Pb0.500][(Cr0.520P0.432□0.048)O4)]}(H2O)n. Another palmierite-type compound with disordered cation sites is Sr2.67□0.33(PO4)1.33(CrO4)0.67 (Hartl and Braungart, Reference Hartl and Braungart1978a,Reference Hartl and Braungartb). It has a large supercell with a doubling of both the a and c edges (R
 $\bar 3$m, a = 10.91 and c = 39.78 Å) which most probably results from ordering of vacancies in the crystal structure. Note that, palmierite-type (Pb,Ba)3(PO4)2 phases structurally related to embreyite were studied previously as ferroelastic materials exhibiting the R
 $\bar 3$m to C2/c ferroelastic transition around T = 180°C, and were considered as model compounds for ferroelastic distortions (Bismayer and Salje, Reference Bismayer and Salje1981; Aktas et al., Reference Aktas, Salje and Carpenter2013; Salje, Reference Salje2015).
Discussion
Lead chromate minerals
There are 13 lead chromate minerals approved by the International Mineralogical Association to date (Table 1). The crystal structures of cassedanneite Pb5(VO4)2(CrO4)2·H2O (Cesbron et al., Reference Cesbron, Giraud, Pillard and Poullen1988) (see below) and santanaite  ${\rm Pb}_9^{2 +} {\rm Pb}_2^{4 +} $O12(CrO4) (Mücke, Reference Mücke1972) remain unknown to date. Some of those studied by single-crystal XRD gave poor quality structure refinements for various different reasons: fornacite had R 1 = 0.10 (Cocco et al., Reference Cocco, Fanfani and Zanazzi1967); reynoldsite, R 1 = 0.10 (Kampf et al., Reference Kampf, Mills, Housley, Bottrill and Kolitsch2012b); and vauquelinite, R 1 = 0.09 (Fanfani and Zanazzi, Reference Fanfani and Zanazzi1968). Macquartite, Pb7Cu2(CrO4)4(SiO4)2(OH)2 (Williams and Duggan, Reference Williams and Duggan1980) was not studied by single-crystal XRD but assumed to be isostructural with wherryite, Pb7Cu2(SO4)4(SiO4)2(OH)2 (Cooper and Hawthorne, Reference Cooper and Hawthorne1994). Lead-containing minerals or synthetic compounds with bichromate (Cr2O7)2– groups are unknown. The CrO4 tetrahedra are isolated in all Pb chromate mineral crystal structures. Most of these minerals (except crocoite, georgerobinsonite and phoenicochroite) contain AO6 polyhedra with different types of connectivity modes with CrO4 tetrahedra via common oxygen atoms. CrO4 groups are monodentate with CuO6 octahedra in the structure of fornacite and vauquelinite. The structures of hemihedrite and iranite contain CrO4 groups shared with ZnO6 (hemihedrite) or CuO6 (iranite) octahedra also in monodentate mode. However, chromate groups are only shared with Pb-centred polyhedra and do not have common oxygen vertices with TeO6 and MnO6 octahedra in the structures of chromschieffelinite and reynoldsite, respectively.
Formula of embreyite
The structural formula obtained for the embreyite sample studied, [Pb0.794Cu0.066□0.140–x]{[Pb0.500][(Cr0.520P0.432□0.048)O4)]}(H2O)n, is in general agreement with that assumed earlier for this mineral on the basis of different data, Pb2[Pbx $M_y^{2 +} $□1–x–y]1(CrO4)(PO4)(OH2(x+y)–1,H2O, □)Σ1, where M 2+ = Cu, Zn and 0.5 ≤ x + y ≤ 1, or Pb2(M,□)(CrO4)(PO4)X, where M = Pb, Cu and Zn and X = OH, H2O and □ (Khanin et al., Reference Khanin, Pekov, Pakunova, Ekimenkova and Yapaskurt2015). The major discrepancy between them is in the presentation of the tetrahedrally coordinated constituents: the structure determination revealed Cr–P disorder. The results of the structure determination suggest attributing the M 2+ cations to the second disordered Pb position. Thus, the generalized formula of embreyite can be represented as (Pbx
 $M_y^{2 +} $□1–x–y)2{Pb[(Cr,P)O4]2}(H2O)n, where M 2+ = Cu, Zn and 0.5 ≤ x + y ≤ 1, or, in simplified form: (Pb,Cu,□)2{Pb[(Cr,P)O4]2}(H2O)n. Minor amounts of vacancies in the tetrahedral site are ignored in the formula for simplification. The powder XRD patterns of the holotype embreyite (Williams, Reference Williams1972) and our material are close in both d values and intensities of reflections. This observation became a reason to re-calculate unit-cell parameters for the holotype sample (due to minor differences in the unit-cell of our sample in the c dimension and β angle values) using our cell setting and corresponding hkl indices. Unit-cell parameters and volume obtained for the holotype are very close to those of the embreyite sample described in this present investigation. We recommend this unit-cell setting (with β ≈ 114–115° instead of the original β ≈ 104°) and hkl indices for the reflections from powder XRD as given in Table 2 for embreyite in general.
Comparison with yavapaiite-type minerals and synthetic compounds
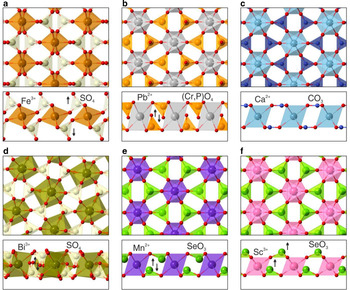
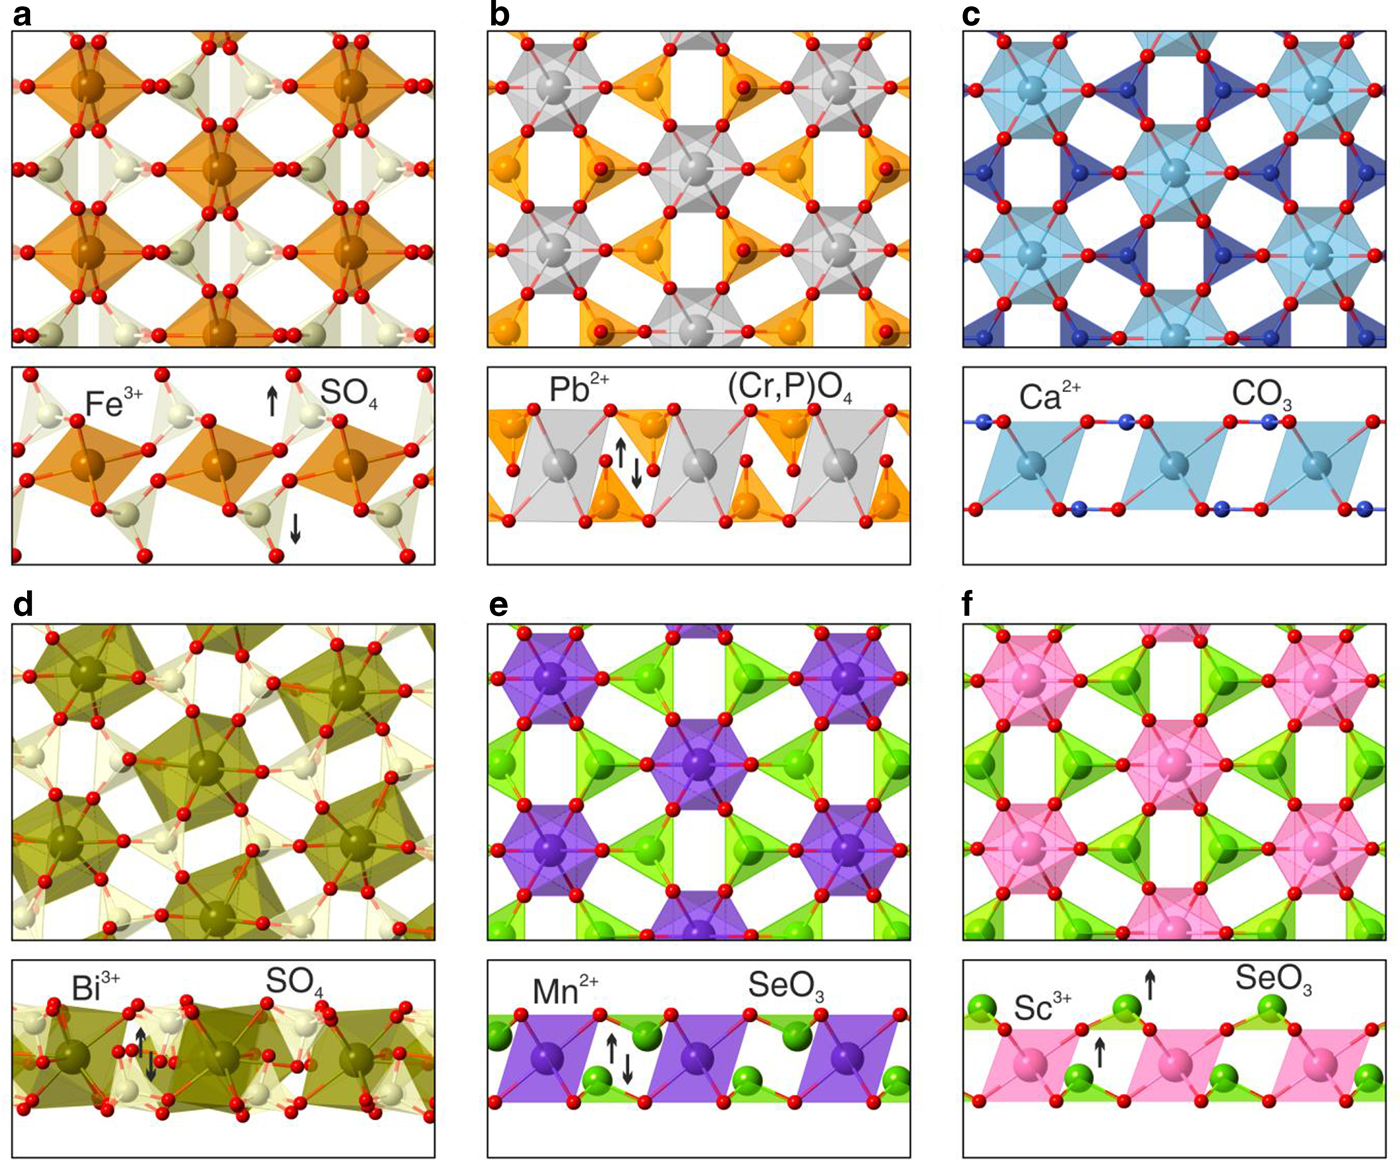
The layers of {Pb[(Cr,P)O4]2]} in embreyite are similar in topology to those in yavapaiite-type compounds, e.g. brianite Na2Ca[Mg(PO4)2] (Alkemper and Fuess, Reference Alkemper and Fuess1998) and steklite KAl(SO4)2 (Murashko et al., Reference Murashko, Pekov, Krivovichev, Chernyatyeva, Yapaskurt, Zadov and Zelensky2013). The tetrahedron acts as a tridentate-bridging ligand thus leaving its fourth vertex (Ot) as terminal or non-shared and in orientation towards the interlayer space in yavapaiite (Fig. 6a). Ot are directed into the layer (Fig. 6b) in embreyite. Ot atoms provide the linkage of heteropolyhedral layers with interlayer cations in yavapaiite. However all three O atoms of basal triangular planes of tetrahedra are involved in strong bonding with interlayer cations in embreyite. In this sense the structural architecture of heteropolyhedral layers in embreyite is similar to those of bütschliite-type compounds (Fig. 6c), e.g. K2Mg(CO3)2 (Hesse and Simons, Reference Hesse and Simons1982) and KBaY(BO3)2 (Gao et al., Reference Gao, Song, Hu and Zhang2011), where the tetrahedra are replaced by triangles of carbonate or borate groups with a similar method of bonding with interlayer species. Another type of layer related to heteropolyhedral blocks in embreyite was described previously in the structures of markhininite, TlBi(SO4)2 (Siidra et al., Reference Siidra, Vergasova, Krivovichev, Kretser, Zaitsev and Filatov2014a) and synthetic, RbEu(SO4)2 (Sarukhanyan et al., Reference Sarukhanyan, Iskhakova and Trunov1983). A 3+-centred (A = Bi or REE 3+) polyhedra share edges with adjacent SO4 tetrahedra in contrast to the other yavapaiite-type compounds with corner-sharing octahedra and tetrahedra in heteropolyhedral blocks. Such coordination of sulfate groups leads to more densely packed layered units and, consequently, orientation of the fourth oxygen vertex towards the layer (Fig. 6d). Note, there is also a group of Se-containing phases related to both yavapaiite- and bütschliite-type compounds. Apical vertices of triangular selenite Se4+O3 pyramids are oriented into the centre of the layers identically to (Cr,P)O4 groups in embreyite (Fig. 6e) in the crystal structures of K2M(SeO3)2 compounds [M 2+ = Mg (Hesse and Simons, Reference Hesse and Simons1982), Co (Wildner, Reference Wildner1992a) and Mn (Wildner, Reference Wildner1992b)], whereas the apices of the pyramids are aligned one by one in the same direction emphasizing a non-centrosymmetric character in β-PbNi(SeO3)2 (Kovrugin et al., Reference Kovrugin, Colmont, Terryn, Colis, Siidra, Krivovichev and Mentré2015) and RbSc(SeO3)2 (Song and Ok, Reference Song and Ok2015) (Fig. 6f).
Heteropolyhedral yavapaiite-related layers in minerals and synthetic compounds: (a) yavapaiite KFe(SO4)2, (b) embreyite, (c) bütschliite K2Ca(CO3)2, (d) markhininite TlBi(SO4)2, (e) K2Mn(SeO3)2 and (f) RbSc(SeO3)2. Black arrows designate the orientation of TO4 tetrahedra or SeO3 groups in a direction towards or outwards from the layer. See the text for details.
Comparison with vauquelinite
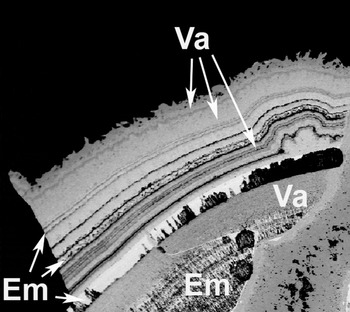
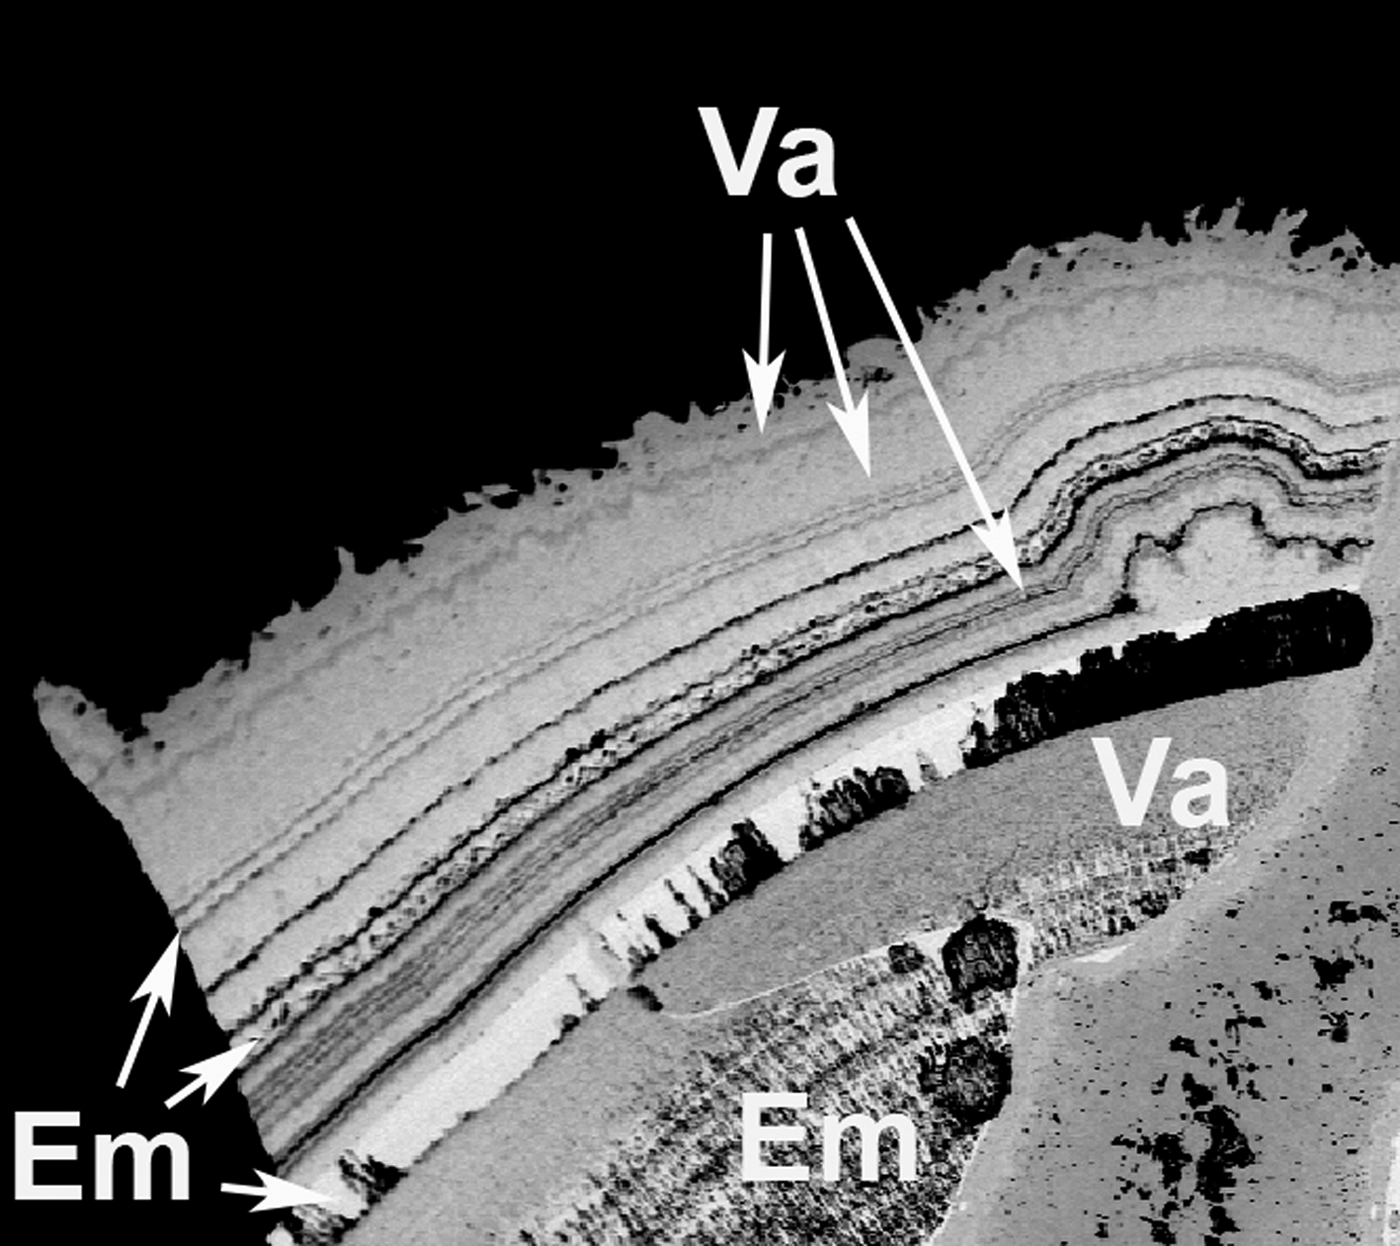
It is of interest to examine and compare the chemical features and structural architectures of embreyite with vauquelinite, ideally Pb2Cu(CrO4)(PO4)(OH) (Fanfani and Zanazzi, Reference Fanfani and Zanazzi1968; Cesbron and Williams, Reference Cesbron and Williams1980), as they form a continuous solid-solution series with the Pb:Cu ratio as the main varying value (Khanin et al., Reference Khanin, Pekov, Pakunova, Ekimenkova and Yapaskurt2015) regardless of significant structural differences. The data from EMPA and powder XRD demonstrate the existence of the margin between these phases as approximately between 0.5 and 0.6 apfu of Cu in the idealized formula of vauquelinite. The recommended simplified formula of embreyite, (Pb,Cu, □)2{Pb[(Cr,P)O4]2}(H2O)n, demonstrates definite similarity in stoichiometry with the vauquelinite formula and explains the existence of the solid-solution series. The Pb:Cu ratio in the point of nucleation of a crystal in a phosphate–chromate mineral-forming system may determine a mineral form (embreyite/vauquelinite) to be crystallized. This may explain the cause and mechanism of the formation of botryoidal aggregates and encrustations up to several mm thick composed by alternating layers of vaquelinite and embreyite (Fig. 7). Such interstratified bi-mineral aggregates are very typical for the chromate assemblages at the Berezovskoe deposit (Williams, Reference Williams1972; Kleymenov et al., Reference Kleymenov, Pekov, Erokhin and Chukanov2003; Khanin et al., Reference Khanin, Pekov, Pakunova, Ekimenkova and Yapaskurt2015). We believe that they may form as a result of oscillatory crystallization processes in the systems chemically close to the margin between the stability fields of embreyite and vauquelinite defined by the Pb:Cu ratio.
Back-scattered electron image showing rhythmically zoned crust consisting of embreyite (Em) and vauquelinite (Va) layers. Berezovskoe deposit, Urals, Russia. Sample #10393 in the systematic collection of Fersman Mineralogical Museum of the Russian Academy of Sciences, Moscow. Field of view: width = 1.9 mm.
Vauquelinite and embreyite demonstrate different, but related, structure types. The former is very close structurally to brackebuschite-group minerals with a crystal structure (Cesbron and Williams, Reference Cesbron and Williams1980) based on columns of edge-sharing CuO4(OH)2 octahedra oriented along the b axis. CrO4 and PO4 tetrahedra are shared with octahedra via monodentate bridging of one of four oxygen vertices. Pb2+ cations are located in between the columns and provide three-dimensional integrity of the structure. A closer look at the coordination environments of one of two Pb sites in vauquelinite reveals similarity with the Pb1-centred coordination polyhedron in embreyite. It can be described as a distorted cuboctahedron with six short Pb–O distances (2.40–2.94 Å) and six longer ones (3.01–3.63 Å). PbO12, PO4 and CrO4 polyhedra form heteropolyhedral layers in vauquelinite similar to those in embreyite. Additional Cu2+ and Pb2+ cations provide the linkage of these blocks (Fig. 5c) in vauquelinite. The common structural motif of vauquelinite and embreyite suggests the possible location of a small amount of Cu in the structure of the latter in the interlayer space. Embreyite can be considered as an intermediate phase between the structures of vauquelinite and rhombohedral modification of Pb4(PO4)2(CrO4) (unknown as a mineral), where the disordered interlayer species are represented by a superposition of ordered cations in two different structures related to each other by translation (Fig. 5d).
There is also a link between the lattice dimensions of these minerals (Table 6). The unit-cell parameters of embreyite are close to those of the brackebuschite-related minerals, e.g. tsumebite Pb2Cu(PO4)(SO4)(OH) and arsentsumebite Pb2Cu(AsO4)(SO4)(OH) (Fanfani and Zanazzi, Reference Fanfani and Zanazzi1968; Zubkova et al., Reference Zubkova, Pushcharovsky, Giester, Tillmanns, Pekov and Kleimenov2002). Remarkably, vauquelinite and fornacite also belong to the brackebuschite structural family and exhibit doubling of both a and c unit-cell parameters in the former, and the c parameter in the latter. Structural relationships are confirmed by the above-discussed genetic linkage between vauquelinite and embreyite.
Crystallographic parameters of vauquelinite, fornacite, tsumebite and embreyite.

References: [1] – Fanfani and Zanazzi (Reference Fanfani and Zanazzi1968); [2] – Ksenofontov et al. (Reference Ksenofontov, Kabalov, Pekov, Zubkova, Ekimenkova and Pushcharovskii2014); [3] – Nichols (Reference Nichols1966); [4] – this work.
*Unit cell was transformed with a and c axes chosen as the [101] and [10 ${\bar {\rm 1}}$] directions, respectively, in the original unit-cell reported by Fanfani and Zanazzi (Reference Fanfani and Zanazzi1968) [a = 13.754(5), b = 5.806(6), c = 9.563(3) Å, β = 94.57(17)° and V = 761.2 Å3].
Sp. gr. – space group.
Final remarks
The determination of the embreyite structure may help to suggest the crystal chemical nature of cassedanneite. This mineral has also been discovered in an old museum specimen from Berezovskoe. However, to date, no crystals suitable for a structural study are known. Cassedanneite is similar in stoichiometry and powder XRD pattern to embreyite and was considered previously to be an analogue with the  ${\rm VO}_{\rm 4}^{{\rm 3\ndash}} $ anion instead of
 ${\rm PO}_{\rm 4}^{{\rm 3\ndash}} $. The idealized formula of cassedanneite was suggested as Pb5(CrO4)2(VO4)2·H2O; the holotype of this mineral contains 0.61 wt.% CuO and 0.65 wt.% ZnO (Cesbron et al., Reference Cesbron, Giraud, Pillard and Poullen1988) not included in the simplified formula. Our recent data for another specimen of cassedanneite from the same locality show up to 3.8 wt.% CuO, concentrations that are similar to those in embreyite. We propose that the structural similarity of cassedanneite and embreyite is related to the disordered distribution of Cr and V. This character of disorder seems to be very likely taking into account the following observations: (1) the existence of the continuous solid-solution series of the brackebuschite-type minerals between vauquelinite Pb2Cu(CrO4)(PO4)(OH), bushmakinite Pb2Al(VO4)(PO4)(OH), ferribushmakinite Pb2Fe3+(VO4)(PO4)(OH) and a phase with the hypothetical end-member composition of Pb2Cu(VO4)(PO4)(H2O). The major substitution scheme is Cr6+ + Cu2+ ↔ V5+ + (Al,Fe)3+ (Khanin and Pekov, Reference Khanin and Pekov2016a,Reference Khanin and Pekovb). (2) The crystal chemical similarity between Cr6+ and V5+ metals is closer than between Cr6+ and P5+.
Our recently obtained data demonstrate that the powder XRD pattern of cassedanneite contains a distinct reflection with d = 13.9 Å, forbidden for the embreyite unit cell (see Table 2). This feature may indicate the doubling of the c unit-cell parameter of cassedanneite in comparison with embreyite, which may explain the structural differences between these two minerals.
Hexagonal relationships observed for embreyite and rhombohedral Pb4(PO4)2(CrO4) indicates the possibility of phase transitions. The behaviour of embreyite at higher temperatures may be somewhat similar to the reported leadhillite → susannite (P21/a → P3) transition at 85°C (Bindi and Menchetti, Reference Bindi and Menchetti2005; Steele et al., Reference Steele, Pluth and Livingstone1998) explained by the changes in orientation of sulfate tetrahedra and PbOn coordination polyhedra. However, the absence to date of pure embreyite material in sufficient quantities prevents additional studies.
Acknowledgements
The authors thank Joël Brugger and one anonymous reviewer for valuable comments and very helpful remarks that improved the manuscript. This study was supported by the Russian Science Foundation, grants nos. 16-17-10085 (XRD and structural studies) and 14-17-00048 (mineralogical investigations). The technical support by the SPbSU X-Ray Diffraction Resource Center is acknowledged.