1. Introduction
The Euler allocation rule (EAR) plays a unique role in financial and insurance risk management as it is the only return on risk-adjusted capital (RORAC) compatible capital allocation rule (e.g., Tasche, Reference Tasche2007; McNeil et al., Reference McNeil, Frey and Embrechts2015, and references therein). In the currently adopted regulatory frameworks, such as Basel II and III, Solvency II, and the Swiss Solvency Test (EIOPA, 2016; IAIS, 2016; BCBS, 2016, 2019), the value-at-risk (VaR) and the expected shortfall (ES) play prominent roles.
The ES-induced EAR is the tail conditional allocation (TCA), whose empirical estimation from several perspectives and under minimal conditions has recently been developed by Gribkova et al. (Reference Gribkova, Su and Zitikis2022a, b), using the therein proposed technique that hinges on compound sums of concomitants. They assume that data arise from independent and identically distributed (iid) random variables. For a much wider class of data generating process such as time series, albeit under conditions that are stronger in the iid case than those imposed in the aforementioned two papers, we refer to Asimit et al. (Reference Asimit, Peng, Wang and Yu2019), where earlier references on the topic can also be found. We shall employ certain elements of the technique of Gribkova et al. (Reference Gribkova, Su and Zitikis2022a,b), in the current paper as well, crucially supplementing it with kernel-type smoothing. Note also that the TCA is a special case of the weighted capital allocation (Furman and Zitikis Reference Furman and Zitikis2008, Reference Furman and Zitikis2009) for which an empirical estimation theory has been developed by Gribkova and Zitikis (Reference Gribkova and Zitikis2017, Reference Gribkova and Zitikis2019), where extensive references to the earlier literature can also be found.
In the present paper, we lay statistical foundations for estimating the VaR-induced EAR, which is known as the conditional mean risk sharing in peer-to-peer (P2P) insurance, a topic of much recent interest among insurance practitioners and academics. For a few references on the topic, we refer to Denuit (Reference Denuit2019) and Denuit and Robert (Reference Denuit and Robert2020), whereas Abdikerimova and Feng (Reference Abdikerimova and Feng2022) and Denuit et al. (Reference Denuit, Dhaene and Robert2022) provide a wealth of information about the P2P insurance. In particular,
using the notation of concomitants, we define a consistent empirical EAR estimator,
establish its asymptotic normality under minimal conditions,
propose a consistent empirical estimator of the standard VaR-induced EAR error.
These contributions make the herein developed theory readily applicable in practice, including constructing confidence intervals for, and testing hypotheses about, the VaR-induced EAR. We shall illustrate numerical performance of these results later in this paper.
In detail, for a given probability level
 $p\in (0,1)$
and a risk variable Y, whose cumulative distribution function (cdf) we denote by G, the VaR is given by
 \begin{equation}\textrm{VaR}_p(Y)=\inf\{y\in\mathbb{R} \,{:}\, G(y)\geq p\}.\end{equation}
In the statistical parlance,
 $\textrm{VaR}_p(Y)$
is the
 $p{\textrm{th}}$
quantile of Y, usually denoted by
 $G^{-1}(p)$
, and in the mathematical parlance, it is the left-continuous inverse of G.
Financial and insurance institutions usually have several business lines. When the total capital is calculated using VaR, the allocated capital to the business line with risk X is, according to the EAR (e.g., Tasche, Reference Tasche2007; McNeil et al., Reference McNeil, Frey and Embrechts2015), given by
 \[\textrm{EAR}_p(X\mid Y)=\mathbb{E}\big(X \mid Y=\textrm{VaR}_p(Y)\big ).\]
A clarifying note is now warranted.
Note 1.1. As an offspring of econometric and statistical problems,
 $\textrm{EAR}_p(X\mid Y)$
has appeared in the statistical literature under the name of quantile regresion function (e.g., Rao and Zhao, Reference Rao and Zhao1995; Tse, Reference Tse2009, and references therein), which stems from the fact that it is the composition
 $r_{X\mid Y}\circ G^{-1}(p)$
of the least-squares regression function
 $r_{X\mid Y}$
and the quantile function
 $G^{-1}$
. Note in this regard that
 $\textrm{EAR}_p(X\mid Y)$
, despite being called the quantile regresion function by statisticians, is only superficially connected to the research area commonly known as Quantile Regression (Koenker Reference Koenker2005).
Naturally, it is desirable to empirically estimate
 $\textrm{EAR}_p(X\mid Y)$
. For the empirical EAR estimator that we shall formally introduce in the next section, we have developed a thorough statistical inference theory under minimal conditions. Namely, in Section 2 we define the estimator and also its asymptotically equivalent version to facilitate diverse computing preferences. In the same section, we present three theorems that are the main results of this paper: consistency of the EAR estimator, its asymptotic normality, and standard error. These results are illustrated using simulated data in Section 3, and then applied on real data in Section 4. Section 5 concludes the paper. Proofs and technical lemmas are in the Online Supplement (see Section S1).
2. Estimators and their large-sample properties
We start with several basic conditions on the distribution of the pair (X, Y), whose joint cdf we denote by H. The marginal cdf’s of X and Y are denoted by F and G, respectively. We have already introduced the left-continuous inverse
 $p\mapsto \textrm{VaR}_p(Y)$
of the cdf G. The right-continuous inverse
 $p\mapsto \textrm{V@R}_p(Y)$
is defined by
 \[\textrm{V@R}_p(Y)=\sup\{y\in\mathbb{R} \,{:}\, G(y)\leq p\}.\]
Next are the first two conditions that we impose throughout the paper.
-
(C1) There exists
 $\varepsilon>0$
such that the cdf G is continuous and strictly increasing on the set
\[V_{\varepsilon}=\big(\textrm{VaR}_{p-\varepsilon}(Y),\textrm{VaR}_p(Y)\big]\cup\big[ \textrm{V@R}_p(Y), \textrm{V@R}_{p+\varepsilon}(Y)\big).\]
-
(C2) The function
$\tau\mapsto \textrm{EAR}_{\tau}(X\mid Y)=g(\textrm{VaR}_{\tau}(Y))$
is finite and continuous in a neighborhood of p, where g is the regression function
\[g(y)=\mathbb{E}\big(X \mid Y=y\big).\]


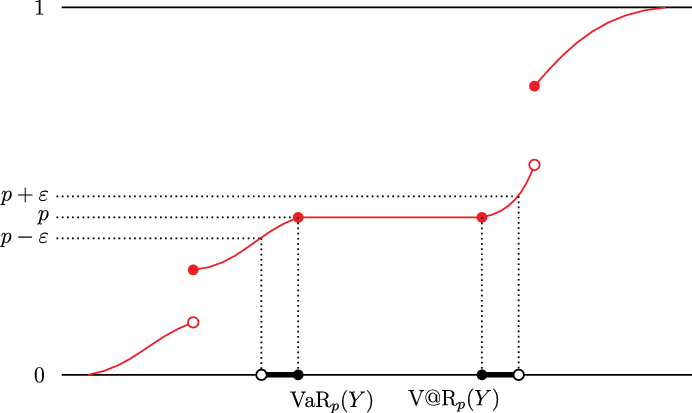
Figure 1 illustrates condition (C1). Note that the gap
 $\big (\textrm{VaR}_p(Y),\textrm{V@R}_p(Y)\big )$
between the two intervals in the definition of
 $V_{\varepsilon}$
coincides with the interval where the random variable Y does not (almost surely) place any values, and thus conditioning on such values does not make sense. Indeed, all conditional expectations are defined only almost surely.
The cdf G is continuous in a neighborhood of the interval
 $[\textrm{VaR}_p(Y),\textrm{V@R}_p(Y)]$
and strictly increasing a bit to the left of
 $\textrm{VaR}_p(Y)$
and a bit to the right of
 $\textrm{V@R}_p(Y)$
.

Note 2.1. The reason we need the continuities specified in conditions (C1) and (C2) is that
 $\textrm{EAR}_p(X\mid Y)$
is the regression function g(y) evaluated at the single point
 $y=\textrm{VaR}_p(Y)$
, and thus to gather sufficient information (that is, data) about the EAR we need to combine the information from neither too large nor too small neighborhoods of the point y, the latter being of course unknown. From this perspective, conditions (C1)–(C2) are natural and basic.
Let
 $(X_1,Y_1),(X_2,Y_2),\dots$
be a sequence of independent copies of the pair (X, Y), and let
 $G_n$
denote the empirical cdf based on
 $Y_1,\dots,Y_n$
, that is,
 \[G_n(y)={1\over n}\sum_{i=1}^n\unicode{x1D7D9}_{\{Y_i\leq y\}}={1\over n}\sum_{i=1}^n\unicode{x1D7D9}_{\{Y_{i:n}\leq y\}},\]
where
 $\unicode{x1D7D9}$
is the indicator function, and
 $Y_{1:n}\leq \cdots\leq Y_{n:n}$
are the order statistics of
 $Y_1,\dots,Y_n$
. (In the case of possible ties, the order statistics of
 $Y_1,\dots,Y_n$
are enumerated arbitrarily.) An empirical estimator for
 $\textrm{VaR}_p(Y)$
can be constructed by replacing G by
 $G_n$
in Equation (1.1). In a computationally convenient form, the obtained estimator can be written as
 \[\textrm{VaR}_{p,n}= Y_{\lceil np \rceil:n},\]
where
 $\lceil \cdot \rceil$
is the ceiling function.
Since the order statistics that we need for estimating
 $\textrm{EAR}_p(X\mid Y)$
can lie on either side of
 $\textrm{VaR}_{p,n}$
, we control their locations using two sequences of non-negative real numbers:
 $\Delta_{1,n}$
and
 $\Delta_{2,n}$
for
 $n\ge 1$
. They define neighborhoods of
 $\textrm{VaR}_{p,n}$
from which we collect the order statistics needed for the construction of an empirical EAR estimator. The two sequences need to satisfy the following conditions:
-
(D1)
$\max\!(\Delta_{1,n},\Delta_{2,n})\rightarrow 0$
as
$n\to\infty$
. -
(D2)
$\liminf_{n\to \infty } \sqrt{n}\big( \Delta_{1,n}+\Delta_{2,n}\big) >0$
.


Note 2.2. The appearance of these
 $\Delta$
’s (a.k.a. band widths) when estimating quantities that involve conditioning on events of zero probabilities (as is the case with the VaR-induced EAR) is unavoidable, theoretically speaking. In practice, however, when working with real data sets, which are concrete and of fixed sizes, the choices of
 $\Delta$
’s can be data driven, as it would be when using, for example, cross-validation (e.g., James et al., Reference James, Witten, Hastie and Tibshirani2013). We do not follow this path in the current paper, given that we have developed satisfactory intuitive understanding of what appropriate
 $\Delta$
’s could be, with details in Section 3.2 below.
Hence, according to conditions (D1)–(D2), the aforementioned neighborhoods should shrink, but not too fast. The estimator of
 $\textrm{EAR}_p(X\mid Y)$
that we shall formally define in a moment is based on averaging those X’s whose corresponding Y’s are near, as determined by the two
 $\Delta$
’s, the order statistic
 $ Y_{\lceil np \rceil:n}$
. To formalize the idea, we first recall that the induced by
 $Y_1,\dots,Y_n$
order statistics, usually called concomitants, are the first coordinates
 $X_{1,n},\dots,X_{n,n}$
when, without changing the composition of the pairs
 $(X_1,Y_1),\dots , (X_n,Y_n)$
, we order them in such a way that the second coordinates become ascending, thus arriving at the pairs
 $(X_{1,n},Y_{1:n}),\dots , (X_{n,n},Y_{n:n})$
. The empirical EAR estimator is now given by the formula
 \begin{equation}\textrm{EAR}_{p,n}=\frac{1}{N_n}\sum_{i=1}^{n} X_{i,n}\unicode{x1D7D9}_{\big(p-\Delta_{1,n},p+\Delta_{2,n}\big)}\left(\frac in\right),\end{equation}
where the indicator
 $\unicode{x1D7D9}_{(a,b)}(t)$
is equal 1 when
 $t\in (a,b)$
and 0 otherwise, and
 \[N_n=\sum_{i=1}^{n} \unicode{x1D7D9}_{\big(p-\Delta_{1,n},p+\Delta_{2,n}\big)}\left(\frac in\right).\]
A few clarifying notes are in order.
Note 2.3. In the case of possible ties, the order statistics of
 $Y_1,\dots,Y_n$
are enumerated arbitrarily. This arbitrariness does not affect the EAR estimator due to condition (C1). Indeed,
 $\textrm{EAR}_{p,n}$
is based on the Y-order statistics in shrinking neighborhoods of the point
 $\textrm{VaR}_p(Y)$
, around which the cdf G is continuous by condition (C1), and thus the Y’s that fall into the neighborhoods are (almost surely) distinct, thus giving rise to the uniquely defined concomitants that are not nullified by the indicators on the right-hand side of Equation (2.1).
Note 2.4. It would not be right for us to claim that the estimator
 $\textrm{EAR}_{p,n}$
is new, as in various guises it has appeared in research by, for example, Gourieroux et al. (Reference Gourieroux, Laurent and Scaillet2000), Tasche (Reference Tasche2007, Reference Tasche2009), Fu et al. (Reference Fu, Hong and Hu2009), Hong (Reference Hong2009), Liu and Hong (Reference Liu and Hong2009), and Jiang and Fu (Reference Jiang and Fu2015). What is new in the current formulation of the estimator is the introduction of the notion of concomitants, which open up the doors into a vast area of Statistics associated with order statistics, concomitants, ranks, and other related objects whose properties have been extensively investigated (e.g., David and Nagaraja, Reference David and Nagaraja2003). It is this knowledge coupled with methodological inventions of Borovkov (1988) that has allowed us to establish the results of the present paper under minimal conditions.
Note 2.5. Deriving statistical inference for the VaR-induced EAR is much more difficult than doing the same for the ES-induced EAR, which explains why there is always a time lag before we see results for the VaR-induced EAR in the literature. Very interestingly, we note in this regard that Asimit et al. (Reference Asimit, Peng, Wang and Yu2019) observed that under some conditions and for large values of p (that is, for those close to 1), the VaR-induced EAR and the ES-induced EAR are close to each other, thus helping to circumvent the challenges associated with the VaR-induced EAR, given that statistical inference for the ES-induced EAR is easier, and is often already available in the literature. This trick, however, comes at an expense associated with a specific choice of p, which depends on the population distribution and thus needs to be estimated. For details, we refer to Asimit et al. (Reference Asimit, Peng, Wang and Yu2019).
We are now ready to formulate our first theorem concerning
 $\textrm{EAR}_{p,n}$
.
Theorem 2.1.
When conditions (C1)–(C2) and (D1)–(D2) are satisfied, the empirical EAR estimator consistently estimates EAR
 $_p(X\mid Y)$
, that is,
 \begin{equation}\textrm{EAR}_{p,n}\stackrel{{P}}{\longrightarrow} \textrm{EAR}_p(X\mid Y)\end{equation}
when
 $n\to \infty $
.
Given the definition of
 $\textrm{EAR}_p(X\mid Y)$
, the estimator
 $\textrm{EAR}_{p,n}$
is highly intuitive and is therefore used in all the theorems of this paper, but from the computational point of view, we may find other asymptotically equivalent versions more convenient. One of them, which we shall also use in our numerical studies as well as in some proofs, is given by
 \begin{equation}\widehat{\textrm{EAR}}_{p,n}=\frac{1}{k_{2,n}-k_{1,n}+1}\sum_{i=k_{1,n}}^{k_{2,n}} X_{i,n},\end{equation}
where the integers
 $k_{1,n}$
and
 $k_{2,n}$
are defined by
 \begin{equation}k_{1,n}=[n(p-\Delta_{1,n})] \quad \textrm{and} \quad k_{2,n}=[n(p+\Delta_{2,n})]\end{equation}
with
 $[\cdot ]$
denoting the greatest integer function. Theorem 2.1 as well as the two theorems that we shall formulate later in this section hold if we replace
 $\textrm{EAR}_{p,n}$
by
 $\widehat{\textrm{EAR}}_{p,n}$
.
Note 2.6. We have achieved the minimality of conditions in all our results by crucially exploiting distributional properties of concomitants. Therefore, the estimator
 $\widehat{\textrm{EAR}}_{p,n}$
frequently turns out to be more convenient than
 $\textrm{EAR}_{p,n}$
. Nevertheless, asymptotically when the sample size n increases, the two empirical estimators are equivalent. There are, however, lines of research when
 $\textrm{EAR}_{p,n}$
becomes more convenient. For example, it allows to naturally introduce kernel-type smoothing, which in the technical language means replacing the indicator on the right-hand side of Equation (2.1) by a kernel function (e.g., Silverman, Reference Silverman1986). Although this is a very useful and interesting research, we have refrained from it in the present paper as, inevitably, conditions on the kernel function need to be imposed, and they will interact with other conditions such as those on the bandwidth and the population distribution, thus impeding our plan to develop statistical inference for EAR under minimal conditions.
Conditions (C1)–(C2) and (D1)–(D2) imposed for the first-order result (i.e., consistency) also give clues as to what would be needed for second-order results, such as asymptotic normality and standard error estimation.
-
(C3) The function
$\tau\mapsto \textrm{EAR}_{\tau}(X\mid Y)$
is finite and
$\alpha$
-Hölder continuous for some
$\alpha \in (1/2,1]$
at the point p, that is, there exists a neighborhood of the point p and also a constant
$L\in (0,\infty)$
such that the bound holds for all
\[ \big|\textrm{EAR}_{\tau}(X\mid Y)-\textrm{EAR}_p(X\mid Y)\big|\leq L|\tau -p|^{\alpha} \]
$\tau $
in the aforementioned neighborhood.
-
(C4) The function
$\tau \mapsto \mathbb{E}(X^2 \mid Y=\textrm{VaR}_{\tau}(Y))=g_2(\textrm{VaR}_{\tau}(Y))$
is finite and continuous in a neighborhood of p, where the function
$g_2$
is defined by
\[g_2(y)=\mathbb{E}\big(X^2 \mid Y=y\big).\]


Note 2.7. The verification of condition (C3) is not expected to pose serious obstacles in practice as it is satisfied when the first derivative of the function
 $\tau \mapsto \textrm{EAR}_{\tau}(X\mid Y)$
is bounded in a neighborhoood of p. This means that the function should not have a jump at the point p. Naturally, practitioners have good intuition whether this assumption is plausible, given their subject matter knowledge and, in particular, their chosen model for (X, Y).
While conditions (D1)–(D2) require the two
 $\Delta$
’s to converge to 0 due to EAR being the regression function evaluated at a single point, the convergence should not be too fast in order to enable the collection of sufficiently many data points. On the other hand, intuitively, a valid asymptotic normality result should require the two
 $\Delta $
’s to converge to 0 fast enough to avoid creating a bias. This is the reason behind the following condition:
-
(D3)
$n^{1/(2\alpha+1)}\max(\Delta_{1,n},\Delta_{2,n})\to 0$
when
$n\to \infty $
.


Note 2.8. It is condition (D3) that has forced the restriction
 $\alpha>1/2$
in condition (C3). In the special case
 $\alpha=1$
, which corresponds to the case when
 $\tau\mapsto \textrm{EAR}_{\tau}(X\mid Y)$
is a Lipschitz continuous function, condition (D3) reduces to
 $n^{1/3}\max(\Delta_{1,n},\Delta_{2,n})\to 0$
; compare it with condition (D2).
We are now ready to formulate our asymptotic normality result for the empirical EAR estimator, with
 $\mathbb{V}$
denoting the variance operator.
Theorem 2.2.
When conditions (C1)–(C4) and (D1)–(D3) are satisfied, the empirical
 $\textrm{EAR} $
estimator is asymptotically normal, that is,
 \begin{equation}\sqrt{N_n}\big(\textrm{EAR}_{p,n}-\textrm{EAR}_p(X\mid Y)\big)\stackrel{d}{\longrightarrow } \mathcal{N}\big(0,\sigma^2\big ),\end{equation}
where
 $\sigma^2$
is the asymptotic variance given by the formula
 \begin{equation}\sigma^2= \mathbb{V}\big(X \mid Y=\textrm{VaR}_p(Y)\big).\end{equation}
To give an insight into the normalizing factor
 $\sqrt{N_n}$
, which should not, of course, be confused with
 $\sqrt{n}$
, we let
 \[\Delta_{1,n}=\Delta_{2,n}\,{=\!:}\,\Delta_{n}\]
and then set
 \[\Delta_{n}=n^{-\eta }\]
with various parameter
 $\eta >0$
values to be discussed next. Conditions (D1)–(D2) are satisfied if and only if
 $\eta \in (0, 1/2]$
. In this case, we have
 $N_n \sim n^{1-\eta }$
, with the familiar in density estimation cases
 $N_n \sim n^{4/5}$
and
 $N_n \sim n^{2/3}$
when
 $\eta =1/5$
and
 $\eta =1/3$
, respectively. It is useful to note the following relationships between these values of
 $\eta $
and the parameter
 $\alpha $
in condition (D3):
if
$\eta =1/2$
, then
$\alpha >1/2$
;if
$\eta =1/3$
, then
$\alpha >1$
, which is not possible due to condition (C3);if
$\eta =1/5$
, then
$\alpha >2$
, which is not possible due to condition (C3).


According to condition (C3), we must have
 $\alpha \in (1/2,1]$
and thus the admissible range of
 $\eta $
values becomes the interval
 \[\bigg ( {1\over {1+ 2\alpha }},{1\over 2} \bigg ]\subseteq \bigg({1\over 3},{1\over 2} \bigg]\]
which reduces to the maximal interval
 $(1/3,1/2]$
when
 $\alpha =1$
, that is, when the function
 $\tau\mapsto \textrm{EAR}_{\tau}(X\mid Y)$
is 1-Hölder (i.e., Lipschitz) continuous. We shall need to keep this in mind when setting parameters in the following simulation study, and also when studying a real data set later in this paper.
Hence, in view of the above, we conclude that, within the framework of the previous paragraph, the normalizer
 $\sqrt{N_n}$
in Theorem 2.2 is, asymptotically,
 \[\sqrt{N_n}\sim n^{\eta^*}\]
with the parameter
 \[\eta^* \,{:\!=}\, {1-\eta \over 2} \in \bigg[{1\over 4}, {1\over 2+ \alpha^{-1}}\bigg)\subseteq \bigg[{1\over 4},{1\over 3} \bigg)\]
that can get arbitrarily close to
 $1/3$
from below if
 $\tau\mapsto \textrm{EAR}_{\tau}(X\mid Y)$
is 1-Hölder (i.e., Lipschitz) continuous, and it can be as low as
 $\eta^* =1/4$
when
 $\eta =1/2$
. The radius (i.e., a half of the width) of the neighborhood of p from which the data are collected is then equal to
 \[\Delta_n=n^{2\eta^*-1} ,\]
and thus the smoother the function
 $\tau\mapsto \textrm{EAR}_{\tau}(X\mid Y)$
is (i.e., smaller
 $\alpha >0 $
), the narrower the neighborhood can be chosen. Hence, the normalizer
 $\sqrt{N_n}$
in Theorem 2.2 cannot become
 $\sqrt{n}$
, a fact already noted by Gourieroux et al. (Reference Gourieroux, Laurent and Scaillet2000), Hong (Reference Hong2009), and Liu and Hong (Reference Liu and Hong2009).
For practical purposes, we need an estimator of the variance
 $\sigma^2$
. We define it in the following theorem, where we also show that the estimator is consistent. (We use
 $\,{:\!=}\,$
when wishing to emphasize that certain equations hold by definition, rather than by derivation.)
Theorem 2.3. When conditions (C1)–(C4) and (D1)–(D3) are satisfied, we have
 \begin{equation}\widehat{\sigma}^2_{p,n}\,{:\!=}\, \frac{1}{N_n}\sum_{i=1}^{n} X^2_{i,n}\unicode{x1D7D9}_{\big(p-\Delta_{1,n},p+\Delta_{2,n}\big)}\left(\frac in\right)-\big( \textrm{EAR}_{p,n} \big)^2\stackrel{\mathbb{P}}{\longrightarrow }\sigma^2.\end{equation}
With the help of classical Slutsky’s arguments, Theorems 2.2 and 2.3 immediately imply
 \begin{equation}\sqrt{N_n \over \widehat{\sigma}^2_{p,n} }~ \big(\textrm{EAR}_{p,n}-\textrm{EAR}_p(X\mid Y)\big)\stackrel{d}{\longrightarrow } \mathcal{N}(0,1),\end{equation}
which enables to construct confidence intervals for, and test hypotheses about,
 $\textrm{EAR}_p(X\mid Y)$
.
We conclude this section by reflecting upon the main results and their possible extensions, or generalizations. To begin with, recall that we have introduced and used the estimators
 $\textrm{EAR}_{p,n}$
and
 $\widehat{\textrm{EAR}}_{p,n}$
, which rely on the bandwidths
 $\Delta_{1,n}$
and
 $\Delta_{2,n}$
. They are the only parameters that require tuning. The simplicity of the VaR-induced EAR estimators has allowed us to derive their consistency and asymptotic normality under particularly weak conditions, virtually only under those that are required for the existence of the quantities involved in the formulations of Theorems 2.1–2.3. Yet, the conditions are plentiful, seven in total. Nevertheless, we can already start contemplating of extending these results in several directions.
For example, we can replace the indicators in the EAR and
 $\sigma^2$
estimators by some kernel functions, as it is done in the classical kernel-type density estimation (e.g., Silverman, Reference Silverman1986). This would of course necessitate the introduction of a set of conditions on the kernel functions, which would naturally be tied to the choices of
 $\Delta_{1,n}$
and
 $\Delta_{2,n}$
.
One may also explore other EAR estimators, such as (recall Note 1.1) the one that arises by replacing the least-squares regression function
 $r_{X\mid Y}$
and the quantile function
 $G^{-1}$
by their empirical estimators, such as the Nadaraya-Watson (or some other) estimator for the regression function
 $y\mapsto r_{X\mid Y}(y)$
and the empirical (or smoothed) estimator for the quantile function
 $G^{-1}(p)$
. Naturally, we would inevitably be facing the necessity of a set of assumptions on the kernel functions used in the construction of the Nadaraya-Watson or other kenel-type estimators. We wish to note at this point, however, that the combined set of conditions arising from such estimators and their asymptotic theories are more stringent than the conditions of Theorems 2.1–2.3. This is natural because our proofs have been designed to tackle the empirical EAR-estimators
 $\textrm{EAR}_{p,n}$
and
 $\widehat{\textrm{EAR}}_{p,n}$
as the whole and not componentwise.
3. The estimator in simulated scenarios
We shall now illustrate the performance of the empirical EAR estimator with the aid of simulated and real data. The section consists of two parts. In Section 3.1, we introduce an insurance-inspired model for simulations and use thus obtained data to evaluate the estimator. In Section 3.2, we work out intuition on bandwidth selection for practical purposes, which we later employ for analyzing a real data set in Section 4.
3.1. Simulation setup and the estimator’s performance
To facilitate a comparison between our earlier and current inference results, we adopt the same setup for simulations as in Gribkova et al. (Reference Gribkova, Su and Zitikis2022b). Namely, we hypothesize a multiple-peril insurance product that contains two coverages with their associated losses
 $L_1$
and
 $L_2$
that follow the bivariate Pareto distribution whose joint survival function is
 \begin{equation} S(l_1,l_2)=\big(1+l_1/\theta_1+l_2/\theta_2\big)^{-\gamma}, \qquad l_1>0,\ l_2>0,\end{equation}
where
 $\theta_1>0$
and
 $\theta_2>0$
are scale parameters, and
 $\gamma>0$
is a shape parameter. (Note that smaller values of
 $\gamma$
correspond to heavier tails.) Moreover, we assume that the two coverages have deductibles
 $d_1>0$
and
 $d_2>0$
, and so the insurance payments are
 \[W_i=(L_i-d_i)\times\unicode{x1D7D9}_{{\{L_i> d_i\}}}.\]
We are interested in evaluating the risk contribution of the first coverage out of the total loss using
 $\textrm{EAR}_p(X\mid Y)$
with
 $X=W_1$
and
 $Y=W_1+W_2$
. For various applications of the distribution, we refer to Alai et al. (Reference Alai, Landsman and Sherris2016), Su and Furman (Reference Su and Furman2016), Sarabia et al. (Reference Sarabia, Gómez-Déniz, Prieto and Jordá2018), and references therein.
We set the parameters of the bivariate Pareto distribution (3.1) to
 $\theta_1=100$
,
 $\theta_2=50$
, and
 $\gamma \in \{2.5, 4, 5\}$
, which are along the lines of the Pareto distribution’s parameter choices when modeling dependent portfolio risks in Su and Furman (Reference Su and Furman2016). The deductibles are assumed to be
 $d_1=18$
and
 $d_2=9$
, which are near the medians of
 $L_1$
and
 $L_2$
, respectively, when
 $\gamma=4$
. Using a formula provided by Gribkova et al. (Reference Gribkova, Su and Zitikis2022b) for computing
 $\textrm{EAR}_p(X\mid Y)$
in the case of distribution (3.1), we compute
 $\textrm{EAR}_p(X\mid Y)$
for the parameter choices
 $p=0.975$
and
 $p=0.990$
, which are motivated by the confidence levels considered in the currently adopted regulatory frameworks.
We depict
 $\textrm{EAR}_{\tau}(X\mid Y)$
as a function of
 $\tau $
with varying
 $\gamma$
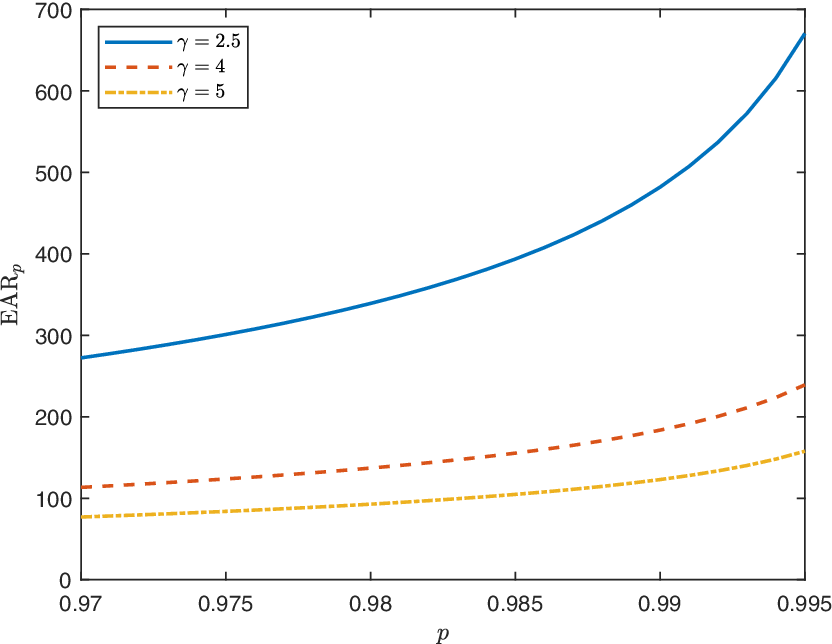
’s in Figure 2. We see from it that the derivative of
 $\tau \mapsto \textrm{EAR}_{\tau}$
is finite at any point
 $\tau \in (0.975,\, 0.990)$
. Thereby, condition (C3) holds at least when
 $\alpha=1$
. For this reason, we set the bandwidths to
 \begin{equation}\Delta_{1,n}=\Delta_{2,n}=n^{-1/2},\end{equation}
which ensures that all the conditions of our main results are satisfied.
The plot of
 $\textrm{EAR}_{\tau }(X\mid Y)$
as a function of
 $\tau \in (0.975,\, 0.990)$
for distribution (3.1) with varying values of the tail parameter
 $\gamma$
.

Next, we pretend that the population distribution is unknown, as it would be in practice, and employ
 $\widehat{\textrm{EAR}}_{p,n}$
to estimate
 $\textrm{EAR}_p(X\mid Y)$
. To demonstrate the large-sample precision of the estimator, we first consider a situation in which the user can generate data sets of any size (think, for example, of Economic Scenario Generators). For fixed sample sizes
 $n=i\times 10,000$
,
 $i\in \{1,\,3,\,10,\,30\}$
, the same simulation exercise is repeated 50,000 times in order to assess the variability of
 $\widehat{\textrm{EAR}}_{p,n}$
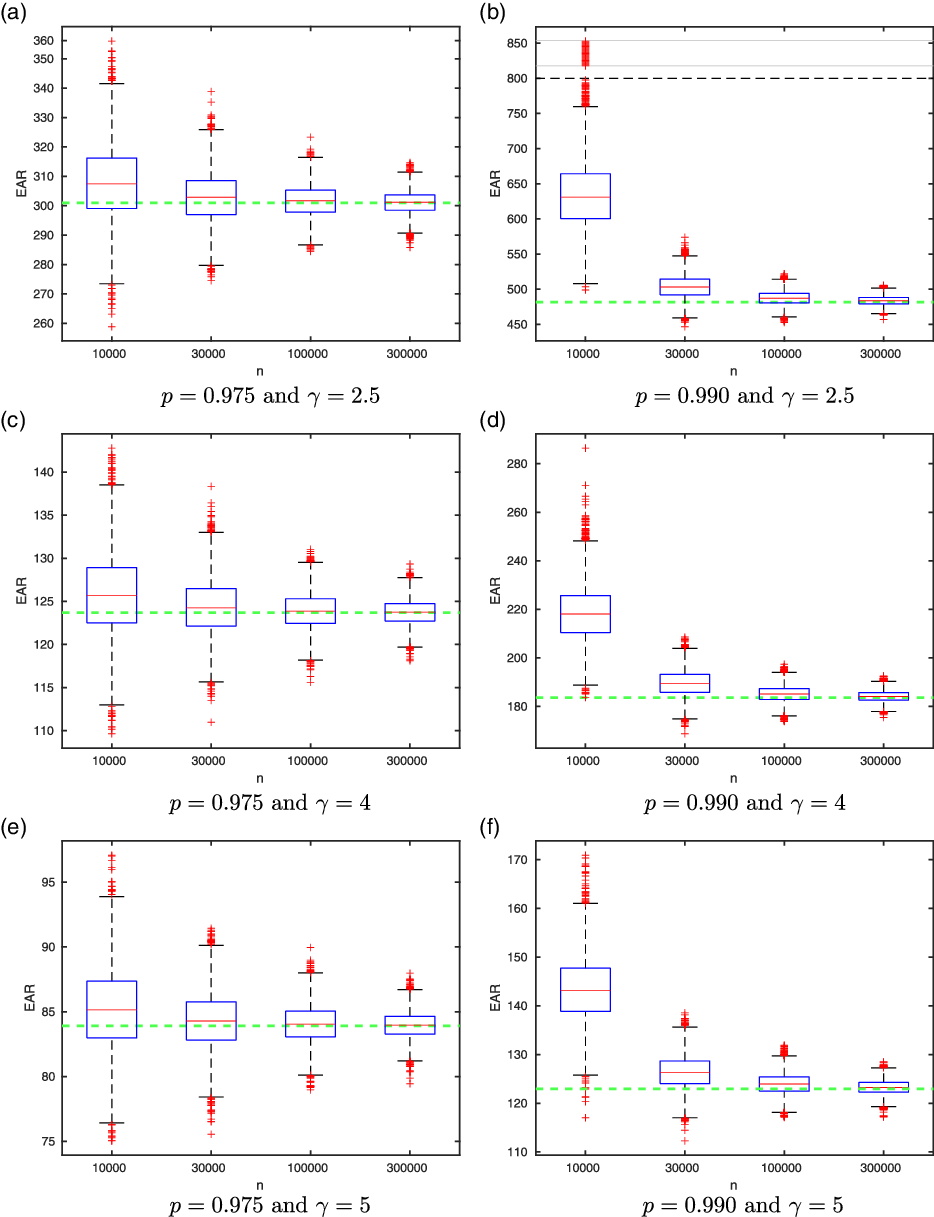
. The EAR estimates are summarized using box plots in Figure 3.
Box plots of the EAR estimates with varying values of the parameter
 $\gamma$
and the sample size n, with the true
 $\textrm{EAR}_p(X\mid Y)$
depicted as the horizontal dashed green line.

Note 3.1. The two vertical lines at the top of panel (b) in Figure 3 are due to extreme-data compression: “If any data values fall outside the limits specified by ‘DataLim’, then boxplot displays these values evenly distributed in a region just outside DataLim, retaining the relative order of the points.” (ExtremeMode, 2023)
We see from Figure 3 that among all the cases, the estimates produced by
 $\widehat{\textrm{EAR}}_{p,n}$
converge to the true value of
 $\textrm{EAR}_p(X\mid Y)$
when the sample size n grows, with the distribution of
 $\widehat{\textrm{EAR}}_{p,n}$
becoming narrower. When
 $p=0.975$
, the intervals of the box plots cover the true value of EAR for all the selected n’s, although this is not the case when
 $p=0.990$
. This indicates that larger p’s diminish the performance of
 $\widehat{\textrm{EAR}}_{p,n}$
, which is natural. On the other hand, the parameter
 $\gamma$
, which governs the tail behavior of distribution (3.1), does not significantly impact the performance of
 $\widehat{\textrm{EAR}}_{p,n}$
, although if we compare the cases
 $\gamma=2.5$
and
 $\gamma=5$
, the estimator seems to behave slightly better when
 $\gamma$
is larger.
In addition to the above discussion based on box plots, we shall now use the same simulation design to calculate coverage proportions of the parameter
 $\textrm{EAR}_p(X\mid Y)$
by the
 $100\times(1-\nu)\%$
-level confidence interval
 \begin{equation} \Big(\widehat{\textrm{EAR}}_{p,n}-z_{\nu/2}\, \widehat{\sigma}_{n,p}/\sqrt{N_n},\ \widehat{\textrm{EAR}}_{p,n}+z_{\nu/2}\,\widehat{\sigma}_{n,p}/\sqrt{N_n}\Big),\end{equation}
where
 $z_{\nu/2}$
is the z-value with
 $\nu\in(0,1)$
set to
 $0.1$
. Hence, specifically, we count the coverage proportions of the 90%-level confidence intervals based on 50,000 sets of simulated data, repeating the same procedure for the sample sizes
 $n\in \{1,\, 3,\, 10,\, 30\}\times 10,000$
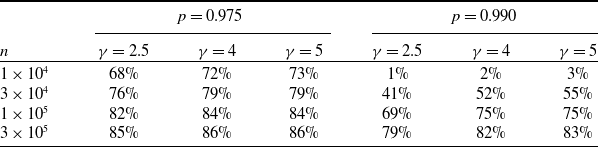
. The results are summarized in Table 1. We see from the table that when n is small, p is large, and the tail of distribution (3.1) is heavy, confidence interval (3.3) barely captures the true EAR value. We have already encountered this feature in Figure 3, which reflects the fact that the bias of
 $\widehat{\textrm{EAR}}_{p,n}$
can be large under the aforementioned challenging data-generating scenario. However, as the sample size n increases, the bias diminishes considerably, and so the coverage proportions tend to
 $0.9$
across the considered scenarios.
Coverage percentages of the 90%-level confidence interval (3.3) for
 $\textrm{EAR}_p(X\mid Y)$
based on 50,000 sets of simulated data for each sample size n.

The distribution of
 $\widehat{\textrm{EAR}}_{p,n}$
or, more precisely, the distribution of its centered counterpart
 \[\widehat{\textrm{EAR}}^*_{p,n}\,{:\!=}\,\widehat{\textrm{EAR}}_{p,n} -\textrm{Average}\big(\widehat{\textrm{EAR}}_{p,n} \big)\]
plays an important role when constructing confidence intervals for, and hypothesis tests about,
 $\textrm{EAR}_p(X\mid Y)$
. When we can simulate data sets of arbitrary size, the distribution of
 $\widehat{\textrm{EAR}}^*_{p,n}$
can be obtained via Monte Carlo, but in most practical cases, we only have one data set. In such cases, Theorem 2.2 says that we can approximate the distribution of
 $\widehat{\textrm{EAR}}^*_{p,n}$
by
 $\mathcal{N}(0,\widehat{\sigma}_{p,n}^2/N_n)$
, where
 $\widehat{\sigma}_{p,n}^2$
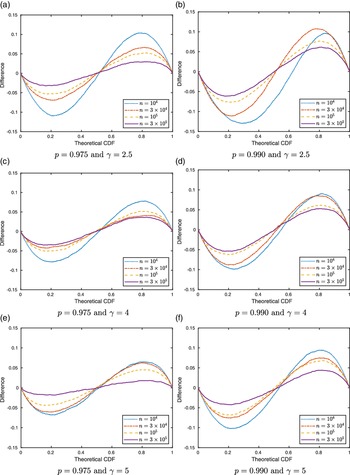
comes from Theorem 2.3. The plots in Figure 4 compare the cdf of
 $\widehat{\textrm{EAR}}^*_{p,n}$
obtained via Monte Carlo with the cdf of
 $\mathcal{N}(0,\widehat{\sigma}_{p,n}^2/N_n)$
, where
 $\widehat{\sigma}_{p,n}^2$
is computed from a single data set. The similarities between the two calculations are easily recognizable, thus implying that the asymptotic normality method yields satisfactory proxies of the distribution of
 $\widehat{\textrm{EAR}}^*_{p,n}$
.
The difference between the cdf of
 $\widehat{\textrm{EAR}}^*_{p,n}$
and its asymptotic normality proxy based on Theorem 2.2 under various parameter and sample-size choices.

3.2. Bandwidth selection sensitivity analysis
In the above simulation study, we used bandwidths (3.2). This is certainly not the only choice that satisfies conditions (D1)–(D3). Hence, we next investigate the impact of different bandwidths on the performance of
 $\widehat{\textrm{EAR}}_{p,n}$
. Specifically, we set
 \begin{equation}\Delta_{1,n}=\Delta_{2,n}=a\, n^{-b/6},\end{equation}
and then vary the parameters
 $a\in \{ 0.4,\, 0.7,\, 1.0,\, 1.3,\, 1.6\}$
and
 $b\in \{2.1,\, 2.4,\, 2.7,\, 3.0 \}$
around the benchmark cases
 $a=1$
and
 $b=3$
, which give
 $n^{-1/2}$
. In view of Note 2.8, condition (D3) holds when
 $b/6\in (1/3, 1/2]$
, which justifies the choices of b.
We assess the performance of
 $\widehat{\textrm{EAR}}_{p,n}$
based on the bias, standard deviation (SD), and mean absolute error (MAE) when compared with the true value of
 $\textrm{EAR}_p(X\mid Y)$
. Tables 2 and 3 summarize the results of our sensitivity analysis when the sample size n is moderately small (
 $n=10,000$
) and large (
 $n=300,000$
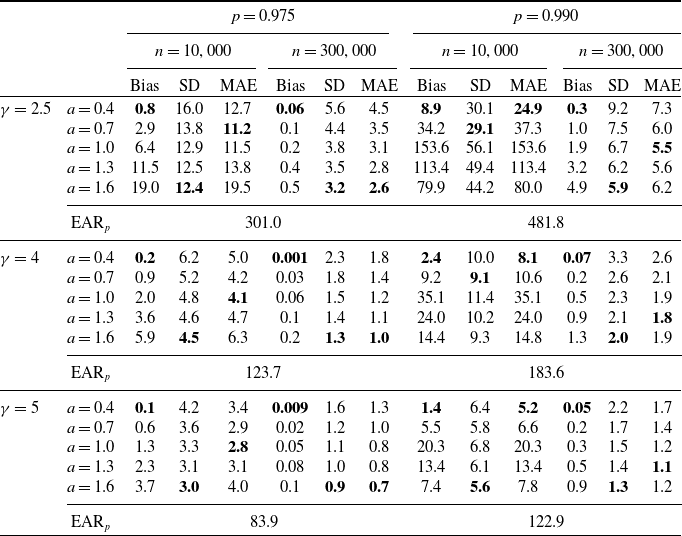
). We observe from Table 2 that among all the considered scenarios, a smaller value of a leads to a better performance of
 $\widehat{\textrm{EAR}}_{p,n}$
in terms of smaller bias. However, this is at the expense of increasing uncertainty measured in terms of the SD, except in the cases of the small sample (
 $n=10,000$
), heavy tailed distribution (
 $\gamma=2.5$
and 4), and high confidence probability (
 $p=0.990$
). These slightly inconsistent patterns have likely been caused by the simulation noise. The MAE, which depends on the interplay between the bias and the uncertainty of the estimator, supports smaller (resp. larger) values of a when the sample size n is relatively small (resp. large).
 $\widehat{\textrm{EAR}}_{p,n}$
performance as measured by the absolute value of bias, SD, and MAE, with varying a and fixed
 $b=3$
in the assumed form
 $a\, n^{-b/6}$
of the bandwidth.

 $\widehat{\textrm{EAR}}_{p,n}$
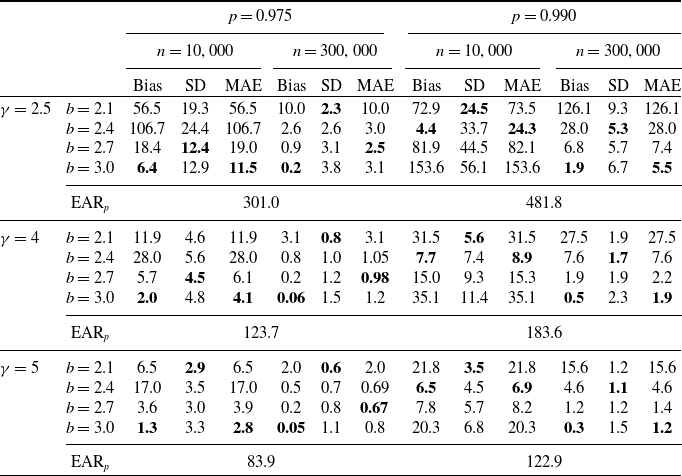
performance as measured by the absolute value of bias, SD, and MAE, with fixed
 $a=1$
and varying b in the assumed form
 $a\, n^{-b/6}$
of the bandwidth.

Table 3 shows that the impact of the power coefficient b on
 $\widehat{\textrm{EAR}}_{p,n}$
is more pronounced than that of the multiplicative coefficient a. As the value of b decreases or, equivalently, as
 $\Delta_{1,n}$
and
 $\Delta_{2,n}$
become larger, the bias of the estimator increases, yet the SD decreases. When both n and p are relatively small (i.e.,
 $n=10,000$
and
 $p=0.975$
), or when both are large (i.e.,
 $n=300,000$
and
 $p=0.990$
), the MAE is in favor of the benchmark choice
 $b=3.0$
, thus suggesting bandwidths (3.2). Otherwise, the MAE is in favor of smaller values of b.
Overall, we have found that the performance of
 $\widehat{\textrm{EAR}}_{p,n}$
in response to varying multiplicative coefficient a is more predictable than changing the power coefficient b. Therefore, we suggest the user of our method to set
 $b=3$
and tune the multiplicative coefficient a. Further, our sensitivity study has shown that the bandwidths influence the trade-off between the bias and the uncertainty associated with the estimator. A smaller value of a should be considered when bias is the major concern and a moderately large value of a when controlling the estimator’s uncertainty. For balancing the bias and the uncertainty, bandwidths (3.2) seem to be a good choice. Finally, the impact of bandwidth parameters on the EAR estimator seems to be rather intricate and nonlinear. It would be interesting and important to develop a more rigorous way for identifying optimal choices of a and b.
4. An analysis of real data
Having thus developed our understanding how the estimator works on (simulated) data, and in particular how to choose bandwidth parameters, we now study the allocated loss adjustment expenses (ALAE) considered in Frees and Valdez (Reference Frees and Valdez1998), which have been widely used in the insurance literature for studying multivariate risk modeling and measurement. The data contain 1500 records of liability claims provided by the Insurance Service Office Inc. Each entry of the data contains the indemnity payment, denoted by
 $L_1$
in our following consideration, and also the associated ALAE costs that include the adjuster expenses, legal fees, investigation costs, etc., which we collectively denote by
 $L_2$
. Intuitively, the larger the loss amount, the higher the ALAE cost, and so there is a positive dependence between
 $L_1$
and
 $L_2$
. We are interested in estimating the risk contribution of the ALAE cost to the total claim cost among the tail risk scenarios via
 $\textrm{EAR}_p(X\mid Y)$
with
 $X=L_2$
and
 $Y=L_1+L_2$
.
Due to the presence of indemnity limit, some indemnity payments are censored, and hence the distribution of
 $L_1$
is not continuous everywhere. However, there is no indemnity limit applied on the ALAE costs, and so the distribution of
 $L_2$
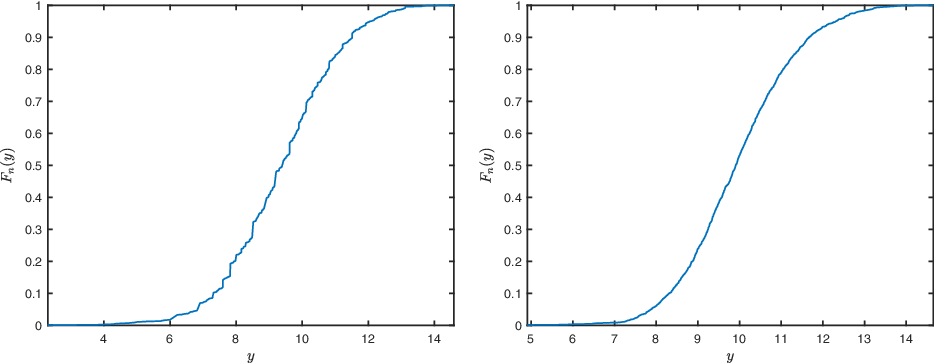
is continuous. For illustrative purposes, Figure 5 displays the empirical cdf’s of the logarithmically transformed indemnity-payments and total-cost amounts. The empirical cdf associated with
 $L_1$
has uneven jump sizes, whereas we do not see jumps of significantly different sizes in the empirical cdf of Y. This confirms our statement that the population distribution of Y is continuous, and thus we safely conclude that condition (C1) should be met. Moreover, the presence of indemnity limit also makes us to naturally accept the finite moment conditions (C2) and (C4). These conditions readily ensure the asymptotic precision of
 ${\textrm{EAR}}_{p,n}$
according to Theorem 2.1. To utilize the asymptotic normality result established in Theorem 2.2 for constructing confidence intervals for
 $\textrm{EAR}_p(X\mid Y)$
, we find it appropriate to assume a model satisfying condition (C3) with
 $\alpha=1$
.
The empirical cdf associated with
 $\log(L_1)$
in the left-hand panel, and that with
 $\log(Y)$
where
 $Y=L_1+L_2$
in the right-hand panel.

Of course, our proposed estimator can be used on data of any size and at any confidence level
 $p\in (0,1)$
. Since the ALAE data under investigation have a relatively small sample size, we choose to work with smaller probability levels
 $p=0.8$
and
 $p=0.9$
so that our derived conclusions would have higher credibility. In practice, of course, insurance companies possess much larger data, or the EAR is estimated based on synthetic data (e.g., Gabrielli and Wüthrich, 2018; Millossovich et al., Reference Millossovich, Tsanakas and Wang2021). In the latter case,z the sample sizes can be arbitrarily large, and thus the application of
 $\widehat{\textrm{EAR}}_{p,n}$
would yield EAR estimates at any probability level and at any desired precision.
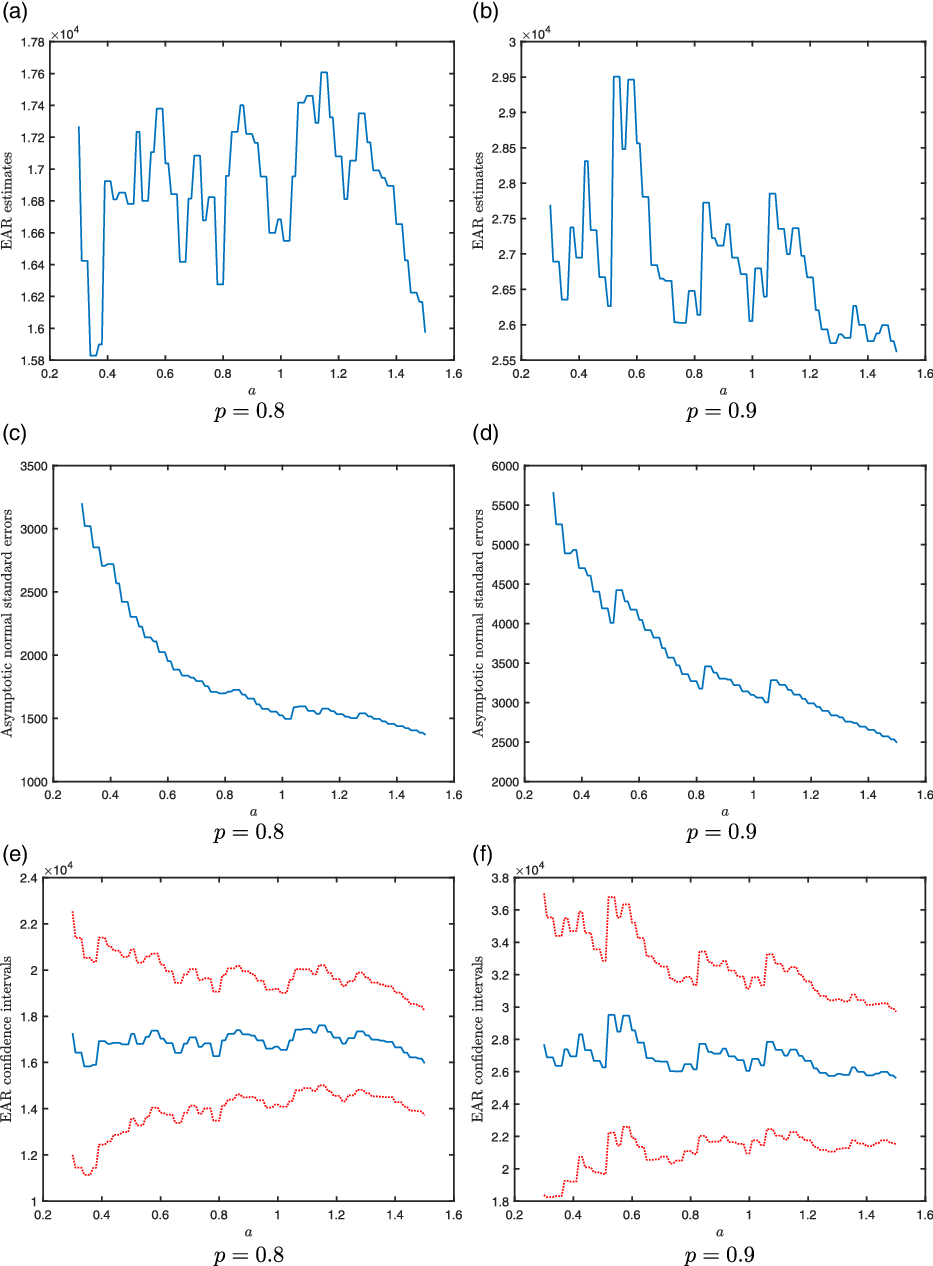
Motivated by the sensitivity analysis of Section 3.2, we estimate
 $\textrm{EAR}_p(X\mid Y)$
by applying
 $\widehat{\textrm{EAR}}_{p,n}$
with varying multiplicative coefficients a. Our estimation results are summarized in Figure 6, which includes EAR estimates, estimation uncertainty as assessed by
 $\widehat{\sigma}_{p,n}$
of Theorem 2.3, and 90% confidence intervals for
 $\textrm{EAR}_p(X\mid Y)$
. In response to varying choices of a, the EAR estimates fluctuate from around
 $1.6\times 10^4$
to
 $1.8\times 10^4$
when
 $p=0.8$
, and from around
 $2.6\times 10^4$
to
 $2.8\times 10^4$
when
 $p=0.9$
. Note that as a decreases (equivalently, the estimation bandwidth becomes smaller), the standard error of
 $\widehat{\textrm{EAR}}_{p,n}$
increases. Consequently, the confidence intervals for
 $\textrm{EAR}_p$
become wider.
The ALAE data’s EAR estimates (top panels), asymptotic normal standard errors (middle panels), and the associated 90% EAR confidence intervals with lower and upper bounds depicted as dotted-red lines (bottom panels).

The developed EAR estimation can immediately be appreciated by risk analysts. To illustrate, recall that
 $\textrm{EAR}_p(X\mid Y)$
is the Euler allocation when the aggregate risk is measured by
 $\textrm{VaR}_p(Y)$
. Define the corresponding allocation ratio
 \[r^{\textrm{EAP}}_{p}(X\mid Y)=\frac{\textrm{EAR}_p(X\mid Y)}{\textrm{VaR}_p(Y)}.\]
Based on the ALAE data, we find that
 $\textrm{VaR}_{0.8}(Y)=6.26\times 10^4$
and
 $\textrm{VaR}_{0.9}(Y)=1.17\times 10^5$
. For instance, if
 $a=1.0$
, then
 $\widehat{\textrm{EAR}}_{p,n}$
is equal to
 $1.67\times 10^4$
when
 $p=0.8$
, and to
 $2.61 \times 10^4$
when
 $p=0.9$
, which implies that the ALAE cost accounts for
 \[r^{\textrm{EAP}}_{0.8}(X\mid Y)=26.68\%\]
and
 \[r^{\textrm{EAP}}_{0.9}(X\mid Y)=22.31\%\]
of the aggregation risk.
The confidence intervals of
 $\textrm{EAR}_p(X\mid Y)$
can be used by risk analysts to understand the uncertainty associated with the EAR estimates. These intervals can also help to assess the adequacy of risk allocation that is determined by another method. For example, Chen et al. (Reference Chen, Song and Suin press) applied the mixed gamma distribution to estimate the TCA of the ALAE cost
 \[\textrm{TCA}_p(X\mid Y)=\mathbb{E}(X\mid Y>\textrm{VaR}_p(Y))\]
and the associated TCA-based allocation percentage
 \[r^{\textrm{TCA}}_{p}(X\mid Y)=\frac{\textrm{TCA}_p(X\mid Y)}{\mathbb{E}(Y\mid Y>\textrm{VaR}_p(Y))}.\]
The authors concluded that the risk contribution of the ALAE cost is
 \[r^{\textrm{TCA}}_{0.8}(X\mid Y)=19.56\%\]
and
 \[r^{\textrm{TCA}}_{0.9}(X\mid Y)=17.86\%.\]
We can therefore conclude that the risk contribution portion determined by aforementioned TCA method is not adequate in the context of EAR allocation because the corresponding risk allocations
 \[\textrm{VaR}_{0.8}(Y)\times r^{\textrm{TCA}}_{0.8}(X\mid Y)= 6.26\times 10^4\times 0.1956=1.22\times 10^4\]
and
 \[\textrm{VaR}_{0.9}(Y)\times r^{\textrm{TCA}}_{0.9}(X\mid Y)= 1.17\times 10^5\times 0.1786=2.09\times 10^4\]
are outside of the confidence intervals of
 $\textrm{EAR}_p(X\mid Y)$
when
 $p=0.8$
and
 $p=0.9$
, respectively, at least when
 $a=1$
.
5. Conclusion
Using the notation of concomitants, in this paper, we have defined a consistent empirical estimator of the VaR-induced EAR, established its asymptotic normality, and also proposed a consistent empirical estimator of the standard deviation. The performance of theoretical results has been illustrated using simulated and real data sets. These results facilitate statistical inference in a number of finance and insurance related contexts, such as risk-adjusted capital allocations in financial management and risk sharing in peer-to-peer insurance.
Naturally, the obtained results have generated a number of thoughts for future research, and we have already mentioned some of them. Additionally, an interesting research direction would be to develop statistical inference for the VaR-induced EAR in scenarios under dependent-data generating processes, such as time series, whose importance is seen from the study of, for example, Asimit et al. (Reference Asimit, Peng, Wang and Yu2019). For this, in addition to classical methods of time series (e.g., Brockwell and Davis, Reference Brockwell and Davis1991), the techniques developed by Sun et al. (Reference Sun, Yang and Zitikis2022), although in a different context, could facilitate the development of an appropriate statistical inference theory.
Supplementary material
To view supplementary material for this article, please visit https://doi.org/10.1017/asb.2023.17.