


INTRODUCTION
Network integration and linguistic conservatism
Integration in a local community network appears to promote speakers' retention of local linguistic variants in the context of pressure from external or standard dialects. For example, Milroy (Reference Milroy1980) finds significant correlations between some linguistic variables and speakers' integration in local social networks in working class Belfast neighborhoods. Among older Belfast women in Milroy's sample, higher scores on a scale indexing local network embeddedness correspond to higher frequency of backed /a/. Similarly, in Grossdorf, Austria, maintenance of the conservative [ɔ] variant of /a/ is greatest among speakers who are well integrated into the local community, especially through work or other voluntary activities (Lippi-Green Reference Lippi-Green1989). In an impoverished Detroit neighborhood, W. Edwards (Reference Edwards1992) finds positive correlations between local network integration and linguistic variables associated with African American English, especially /ai/ monophthongization, coda /r/ absence, and copula absence. In Grossdorf, and for some Belfast variables, the ongoing attrition of local linguistic variants results in large part from increasing contact with other neighborhoods or cities; in Detroit, an additional dimension is contact with White speakers.
One mechanism by which neighborhood-based, dense social networks preserve local linguistic norms is peer evaluation: in small, tightly woven communities, one's actions are subject to constant scrutiny. Adopting an innovation from outside the community makes a speaker vulnerable to critique inside the community. Another mechanism has to do with exposure. A person who is well integrated in a dense local network likely has little contact with people from outside the local community, and thus limited access to external linguistic variants. Granovetter's (Reference Granovetter1973) concept of the ‘strength of weak ties'—that is, information travels between groups primarily through ties between acquaintances, or friends of friends, rather than close friends—underlies this idea. For example, in Belfast, backed variants of /a/ are diffusing from east to west and are more frequent among men, probably because they are perceived as nonstandard. In the Clonard, a west Belfast neighborhood, however, the young women unexpectedly have the highest rates of the vernacular back /a/, higher than young males and higher than older females. This innovative linguistic behavior is attributed to the fact that all of the young women in the sample work in a centrally located store serving both protestant and catholic customers. This puts them in continual, casual contact with people from all over the city, including people from East Belfast where backed variants of /a/ are more frequent. Thus the backed /a/ variants travel across ‘weak ties’ to the young Clonard women (Milroy Reference Milroy1980; Milroy & Milroy Reference Milroy and Milroy1985, Reference Milroy and Milroy1992).
Network effects—both the homogenizing effect of dense local networks and the role of weak ties in transmitting linguistic innovations—are often cited as causes of linguistic differences across socioeconomic groups in large urban speech communities. Trudgill (Reference Trudgill1974:104) suggests that the (middle) working class lead in the centralization of (e) before /l/ results from the fact that the lower working class is relatively ‘isolated from innovative tendencies’. Eckert (Reference Eckert2000:25) argues similarly that ‘[t]he lower class is excluded from engagement in popular culture, and the true upper class excludes itself’. In both cases, the linguistic uniqueness of speakers at the socioeconomic poles is argued to result from their social isolation. Conversely, Labov concludes that, among Philadelphia females, the leaders of new linguistic changes are speakers in middle socioeconomic classes with ‘expanded [network] centrality’, possessing both high numbers of contacts on the block and a high proportion of friends off the block (2001:364). In general, middle-class social networks are less dense, multiplex, and locally based than working-class networks, and less dense than elite upper-class elite networks; therefore, middle-class speakers are believed to be more likely to lead linguistic changes (J. Milroy & L. Milroy Reference Milroy and Milroy1985:363; L. Milroy & J. Milroy Reference Milroy and Milroy1992:15–17).
With respect to dialect contact—the catalyst of linguistic change in Raleigh, North Carolina, this paper's topic—plenty of evidence suggests that the density of network ties between speakers of the different dialects affects linguistic outcomes. The convergence over time of dialects in contact is commonly believed to result from linguistic accommodation during repeated face-to-face contact (Giles Reference Giles1973; Giles & Smith Reference Giles, Smith, Giles and St. Clair1979; Trudgill Reference Trudgill1986; Auer & Hinskens Reference Auer, Hinskens, Auer, Hinskens and Kerswill2005; Gallois, Ogay, & Giles Reference Gallois, Ogay, Giles and Gudykunst2005). Accordingly, linguistic leveling (the reduction in the number of variants for a given variable) and focusing (the emergence of stable norms) may take longer or remain incomplete in sparsely populated regions without regular contact among speakers, especially in settings without schools to bring children together (Britain Reference Britain1997; Mæhlum Reference Mæhlum1997; Omdal Reference Omdal1977; Trudgill Reference Trudgill and Jahr1998; Trudgill, Gordon, Lewis, & Maclagan Reference Trudgill, Gordon, Lewis and Maclagan2000; Kerswill Reference Kerswill, Chambers, Trudgill and Schilling-Estes2002; Kerswill & Williams Reference Kerswill and Williams2000; Kerswill & Trudgill Reference Kerswill, Trudgill, Auer, Hinskens and Kerswill2005). When children have more regular interaction, focusing can be quicker. For example, in the English ‘new town’ of Milton Keynes, children of the first native-born generation were able to establish a relatively focused set of phonological norms because they had regular contact at school (Kerswill & Williams Reference Kerswill and Williams2000).
Representing network in sociolinguistics
Sociolinguists have often represented network information via indices or categories built from speakers' answers to questions about their social contacts or interactional practices (Labov Reference Labov1972; Bortoni-Ricardo Reference Bortoni-Ricardo1985; Ash & Myhill Reference Ash, Myhill and Sankoff1986; V. Edwards Reference Edwards1986; Labov & Harris Reference Labov, Harris and Sankoff1986; Lippi-Green Reference Lippi-Green1989; W. Edwards Reference Edwards1992; Fridland Reference Fridland2003; Cheshire, Fox, Kerswill, & Torgersen Reference Cheshire, Fox, Kerswill and Torgersen2008; Hoffman & Walker Reference Hoffman and Walker2010; Sharma Reference Sharma2011). For example, Ash & Myhill (Reference Ash, Myhill and Sankoff1986) construct an index of interethnic contact on the basis of the ethnic composition of the speaker's neighborhood and high school, number of friends in a different ethnic group, and number of spouses/lovers in a different ethnic group. Network indices of this type are useful in accounting for linguistic differences because they model aspects of speakers' interactional lives or attitudes that relate to their linguistic exposure and their communicative and symbolic needs. Further, the information is easy to elicit from speakers.
Nevertheless, typical sociolinguistic network indices have some drawbacks. Self-reported friendship ties are useful in studying linguistic variation, but interactions with friends are only a fraction of the face-to-face encounters through which linguistic variables can be transmitted, and self-reported ties are known to be incomplete, biased, or imprecise (Marsden Reference Marsden1990). In addition, assuming that speakers acquire their native dialects primarily during childhood and adolescence, adults' social networks are less immediately relevant to many sociolinguistic questions than their childhood networks would be; yet adults cannot be expected to accurately report their networks from years earlier. Further, typical sociolinguistic network indices represent network data as a speaker-centric metric, rather than constructing a holistic representation of the community's network structure (a partial exception being Bortoni-Ricardo Reference Bortoni-Ricardo1985). Finally, using a network index as an independent variable in regression, as is common (and often useful) in sociolinguistics, does not directly test whether linguistic similarity between speakers corresponds to their network similarity or to their network positions. Therefore, it does not directly address whether, and in what ways, linguistic variables diffuse through networks.
We propose that network methods developed in related disciplines can profitably apply to sociolinguistics, thereby facilitating not only more precise quantitative analysis but also new questions about the relational nature of linguistic variables. We demonstrate this with respect to the generalization that integration into a dense local network promotes the use of local linguistic variants. Specifically, we address the network effects involved in the contact-induced retreat from the Southern Vowel Shift in Raleigh, North Carolina.
The following section discusses the Southern Vowel Shift and its status in Raleigh with respect to age, generation, sex, and occupation. We next describe our network approach, which hinges on the concepts of cohesive blocking and network depth, and steps through two distinct network analyses of the Raleigh data. The first uses multilevel regression, and the second is a relational analysis of the same data using a statistical method called the Quadratic Assignment Procedure (QAP). The final section assesses the value of the current approach for variationist sociolinguistics.
THE RETREAT FROM THE SOUTHERN VOWEL SHIFT IN RALEIGH, NORTH CAROLINA
The Southern Vowel Shift (Labov Reference Labov1991; Fridland Reference Fridland2001; Labov, Ash, & Boberg Reference Labov, Ash and Boberg2006) affected most of the southeastern United States. The shift may have begun during the mid to late nineteenth century (Bailey Reference Bailey and Schneider1997; Thomas Reference Thomas1997:310–11). While southeastern US vowel systems differ from other regional systems in several ways, the Southern Vowel Shift (hereafter SVS) refers to the monophthongization of /aɪ/ (possibly the triggering event for the SVS; Labov et al. Reference Labov, Ash and Boberg2006), the backing and lowering of the nuclei of the front tense vowels /i/ and /e/, the raising and fronting of the nuclei of the front lax vowels /ɪ/ and /ε/, and often the raising and fronting of /æ/. The result can be described as an inversion of the front tense and lax pairs, insofar as the /e/ nucleus may be lower and backer than the /ε/ nucleus, and (less commonly) the /i/ nucleus may be lower and backer than the /ɪ/ nucleus. Because the SVS was mainly confined to the first half of each vowel's trajectory, the lax vowels are variably diphthongal. Raleigh, North Carolina lies in a region characterized by an inversion of the mid front vowels but less dramatic shifting on the part of the high front vowels, as determined by the current data as well as by Labov and colleagues (2006). In fact, the current study omits /i/ because it southern-shifted only slightly in Raleigh (Dodsworth & Kohn Reference Dodsworth and Kohn2012). We also leave aside the extremely iconic variable of /aɪ/ monophthongization. The internal constraints on this variable are quite complex in Raleigh (cf. Dinkin & Dodsworth Reference Dinkin and Dodsworth2017), and their interaction with the network data is beyond the scope of this article.
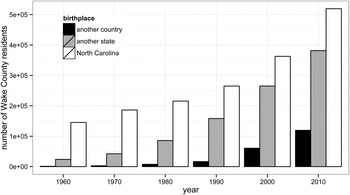
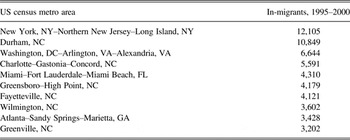
Following World War II, heavy migration from other US regions to the South caused many southern urban areas to shift away from the SVS system toward a regionally unmarked system (Thomas Reference Thomas1997). The front tense vowel nuclei are becoming higher and fronter, and the front lax vowel nuclei are becoming lower and backer. Monophthongal /aɪ/ is giving way to diphthongal variants. In Raleigh, the retreat from the SVS was quickened by the development of Research Triangle Park, a technology industry hub that has recruited thousands of professionals from northern US cities since the early 1960s (Rohe Reference Rohe2011). In 1960, most residents of Wake County (of which Raleigh is the largest city) were born in North Carolina, but by 2010 they were equally likely to be born elsewhere (Figure 1). During the 1990s, migrants to Raleigh came from northern cities but also southern cities including Charlotte and Durham (Table 1). The contact setting in Raleigh has produced the ongoing elimination of Southern variants. Young Raleigh natives tend to have few distinctive regional vocalic features (Dodsworth & Kohn Reference Dodsworth and Kohn2012; Dodsworth Reference Dodsworth2013, Reference Dodsworth2014, Reference Dodsworth2018).
Wake County population by birthplace, 1960–2010 (Sources: US Bureau of the |Census 1963, 1973, 1983, 1992; US Census 2000 ; US Census 2010 ).

Top ten metropolitan areas of origin for migrants to Raleigh-Cary metropolitan area, 1995–2000 (Source: US Census BureauFootnote 1 ).

The Raleigh corpus consists of conversational interviews, recorded (at a sampling rate of 44.1 kHz) between 2008 and the present, with about 300 White and African American Raleigh natives. Most interviews are recorded in speakers' homes. While the interviews are largely unstructured, all speakers are asked about their past and present occupations, schools attended, home neighborhoods, parents' geographic origins and occupations, and their views on Raleigh's ongoing social and economic changes.
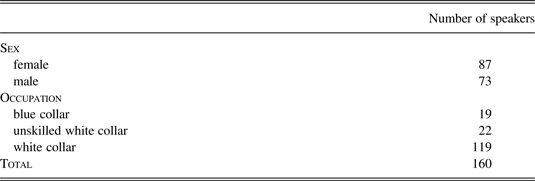
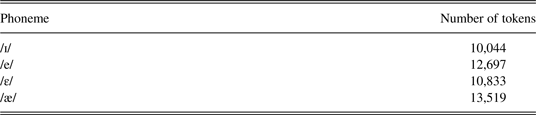
The current analysis, which addresses language change in Raleigh via an apparent time approach, uses acoustic data from 160 of the interviews with White speakers (Table 2). Speakers in this subset were born between 1923 and 1993 (mean = 1960). In the present sample, 138 interviews were transcribed and aligned to the sound file using the Penn Phonetics Lab Forced Aligner (Yuan & Liberman Reference Yuan and Liberman2008). For each vowel token in the aligned interviews, F1, F2, and F3 were measured automatically in Praat at 25%, 50%, and 75% of the vowel's duration, then hand-corrected where necessary. Vowel tokens with duration under 60 ms or adjacent to a vowel, liquid, or glide were excluded. For twenty-two additional speakers, vowel tokens were identified by hand in the conversational interviews. Approximately twenty closed-syllable tokens per speaker of each of the five front vowels were measured, as well as twenty tokens of /ɑ/ (the ‘cot’ vowel, which remains distinct from the ‘caught’ class for many Raleigh speakers) to supplement normalization. F1 and F2 measurements were normalized using a modified Lobanov (Reference Lobanov1971) procedure. Additional back vowels (other than /ɑ/) were excluded from the normalization procedure in view of the variable occurrence of back-vowel fronting in Southern dialects. Token counts appear in Table 3.
Summary of speakers in the current sample of the Raleigh corpus.

Token counts per phoneme in the current sample.

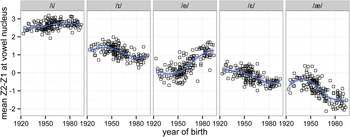
The dependent variable in all subsequent quantitative analysis is the normalized F2 minus the normalized F1 (Z2–Z1) at 25% of the vowel's duration. Higher values indicate higher, fronter vowel nuclei (Labov, Rosenfelder, & Fruehwald Reference Labov, Rosenfelder and Fruehwald2013). Figure 2 shows the trajectories of change across apparent time using each speaker's mean value, and LOESS curves fitted to the mean values. The high front vowel /i/ is included for reference. The nuclei of the mid vowels were generally not distinct for speakers born before 1950, but among speakers born thereafter, all vowels began to shift away from their Southern positions.
Change across apparent time in Raleigh's front vowel system. Each circle represents one speaker's mean Z2–Z1 at the vowel nucleus. All vowels are shifting away from their Southern positions. The lines are LOESS curves fitted to the mean values.

In the present analysis, speakers are divided into three generations. Generation 1 (thirty-nine speakers) includes everyone born before 1950 (roughly, those who grew up prior to the beginning of contact-induced change). Generation 2 (sixty-nine speakers) includes speakers born between 1950 and 1966, a period of rapid linguistic change in Raleigh. Generation 3 (fifty-two speakers) includes all speakers born between 1967 and 1993, a period of continued retreat from the SVS with some leveling off among the youngest speakers. The cutoff point between Generations 2 and 3 corresponds to the beginning of the ‘magnet’ program at Enloe High School, which lies in a largely working class area of East Raleigh. Magnet programs allow students with certain talents or interests to attend the school even if they live in another school's district. This had the effect of bringing students from other, more affluent neighborhoods to Enloe. All Generation 2 speakers began high school prior to the magnet program's first year. In fact, the primary motivation for modeling apparent time via three generations is the need to handle school-based network data in a growing, diversifying school system (cf. Lippi-Green's Reference Lippi-Green1989 account of changing network structures, and the changing relationship between language and network, across generations). This is discussed in greater detail below.
Recent work on the Raleigh data (Forrest & Dodsworth Reference Forrest and Dodsworth2016; Dodsworth Reference Dodsworth2018) finds that, when year of birth is modeled as a single continuous distribution, professional white-collar speakers significantly lead the retreat from the SVS relative to both blue-collar speakers and what we have termed ‘unskilled white-collar’ speakers such as secretaries and office managers. The professional white-collar lead is predictable for two reasons. First, during the mid and late twentieth century, the incoming migrants settled primarily in affluent central and North Raleigh areas, in part for their geographic proximity to Research Triangle Park. Working-class speakers in East Raleigh and in areas to the south of town, including Garner, were relatively insulated from the migrants and their non-Southern dialects (though suburban development to the southeast has recently accelerated). Second, the SVS encounters stigma both nationally and within the South; Southern dialects are associated with friendly but uneducated and unintelligent people (Niedzielksi & Preston Reference Niedzielski and Preston2003; Preston Reference Preston, Picone and Davies2015). Speakers in many white-collar professions thus have motivation to avoid Southern linguistic variants, especially if they interact with non-Southerners at work.
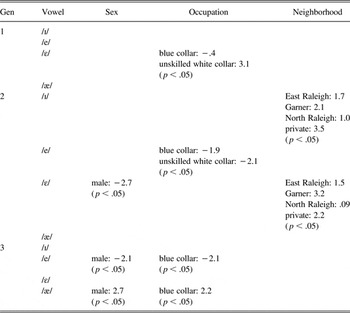
In the present analysis, we set the stage for network analysis by assessing social effects across the three discrete generations. We first ask whether the occupational effects observed in recent work are present at each of the three generations. Linear mixed-effects models for each of the four vowels include fixed effects for place of articulation of the preceding and following consonants, log-transformed vowel duration, and year of birth. Each model also includes random intercepts for speakers, random intercepts for words, and within-speaker random slopes for log-transformed duration. Table 4 reports the significant effects. The column labeled ‘sex’ reports the significant main effects of sex, where significance was determined by comparing, via ANOVA, models with and without this term. The column labeled ‘occupation’ lists the significant main effects of the three-category occupation variable in models that also include sex, where significance is again determined via model comparison. In Generation 3, the occupation variable has only two levels, white collar and blue collar, because the lone unskilled white-collar speaker at this generation was merged with the white-collar group.
Significant effects of sex, occupation, and neighborhood in multilevel regression models at each of three generations of Raleigh speakers.

The significant professional white-collar lead in the retreat from the SVS shows up in the three-generation view, but not consistently across vowels or across generations. In Generation 1, unskilled white-collar speakers retain Southern /ε/ to a greater extent than both blue-collar and professional white-collar speakers. (This is also the case in Generation 2 when sex is left out of the model; sex and occupation are, as usual, not independent in the sample.) In Generation 2, professional white-collar speakers are the least Southern with respect to /e/. In Generation 3, blue-collar speakers and males retain Southern /e/ and /æ/ relative to white-collar speakers and females, respectively. The fact that the effects of occupation and sex vary from one generation to the next likely results from several factors, including the fact that Raleigh's population grows and changes over time, and that the overall occurrence of Southern variants diminishes.
Given Raleigh's asymmetric geographic expansion resulting from the migration of professional workers from outside the South, we can also ask whether the elements of the SVS differ across Raleigh neighborhoods at each generation. We are interested specifically in the neighborhoods where speakers grew up, not where they live now, given the importance of childhood and adolescence in dialect acquisition. Specifically, we take as a point of departure the assumption that, in a contact setting, face-to-face interaction between the children of migrants and the children of natives drives the formation of a new, stable dialect (Trudgill Reference Trudgill1986; Britain Reference Britain1997; Kerswill & Williams Reference Kerswill and Williams2000). We further assume that an adult's dialect is very similar to his/her dialect during adolescence, especially when the adult speaker lives in the city where he/she grew up, as all of the speakers in the Raleigh sample do. Although a speaker's vernacular may change (Sankoff & Blondeau Reference Sankoff and Blondeau2007; Kohn Reference Kohn2013), sustained exposure to another dialect during adulthood does not usually result in full acquisition of the new dialect (Chambers Reference Chambers1992; Siegel Reference Siegel2010; Johnson & Nycz Reference Johnson and Nycz2015; Nycz Reference Nycz2015). Speakers who grew up in areas south of the city that have seen less suburban development may not only have fewer connections to other areas of the city but also less exposure to the incoming non-Southern dialects. By contrast, young speakers growing up in far North Raleigh, many of them children of white-collar migrants from the North, may have had little contact with groups of speakers with the indigenous Southern vowel system.
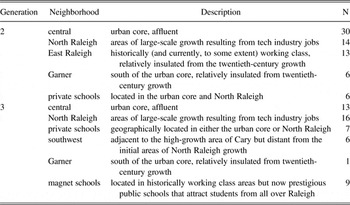
Using high schools as proxy for neighborhood, we distinguish neighborhoods vis-à-vis their relationship to the industry-motivated population growth of the twentieth century (Table 5). The occupation models (Table 4) were repeated, this time with the addition of neighborhood as a fixed effect. The column in Table 4 labeled ‘neighborhood’ reports this variable's significant effects. In Generation 2, the addition of neighborhood to the models containing sex and occupation significantly improves the model fit for the vowels /ɪ/ and /ε/. Speakers who attended private schools or Garner schools are the most Southern, and speakers who attended North Raleigh or central schools are the least Southern. For /e/ and /æ/, neighborhood does not improve the model. In Generation 3, the addition of neighborhood does not improve any vowel's model fit. We surmise that two of the variables were sensitive to peer network during the earliest stage of change, when face-to-face interaction between non-Southern migrants and native Raleigh speakers in schools led to long-term linguistic accommodation. Later, linguistic differences between neighborhoods disappeared as a relatively focused dialect emerged among adolescents.
Neighborhoods defined by schools: Generations 2 and 3.

The neighborhood variable, while it yields some effects in the expected direction, represents a problematic approach to the question of adolescent dialect exposure in two respects. First, although the neighborhoods were determined straightforwardly on the basis of broad geographic location and school type (public/private/magnet), there are many more reasonable groupings of the schools based on sociogeographic data. For example, the North Raleigh high schools are not a unified group by some criteria, including their distance from Raleigh's core and from Research Triangle Park. The uncertainty involved in constructing the neighborhood variable impedes replicability and generalizability. Second, the neighborhood approach does not directly address the way(s) in which networks shape dialect shift in a contact setting. The network studies cited in the Introduction are useful precisely because they offer claims about the relationship between linguistic variables and social networks, specifically: (i) belonging to a dense local network promotes linguistic conservatism, and (ii) linguistic innovations travel along weak ties. If we expect retention of Southern vowels to correspond to membership in a dense area of the network, then we should endeavor to test that hypothesis directly.
Accordingly, we now turn to an alternative approach in the study of the retreat from the SVS in Raleigh, with the goal of building a methodology that can be replicated in other sociolinguistic studies and that directly tests a hypothesis about the role of networks in contact-induced dialect shift.
TWO-MODE NETWORKS, COHESIVE BLOCKING, AND DEPTH
Two-mode networks
We represent Raleigh's network structure via a two-mode or bipartite network. Two-mode networks differ from traditional networks in having two distinct classes of nodes representing different social entities. Ties occur only between nodes of different types. Bipartite networks are commonly used to represent network ties between individuals and the places or events where they come into contact, such as social events, board meetings, and clubs. In the perennial study of a bipartite network, Davis, Gardner, & Gardner (Reference Davis, Gardner and Gardner1941) inferred the social structure of society women in a small southern community by recording the social events each woman attended. Although the researchers were unable to observe whether the women directly interacted during the event, co-attendance at numerous events provided an important indicator of social proximity and helped formalize the relational structure of the community.
Bipartite network representations have been widely used in sociology and related disciplines to empirically characterize the relational structure of individuals and social groups, even when a direct face-to-face tie cannot be assumed. Moreover, because most organizations are more durable than an individual's membership, joint memberships in organizations can link individuals across time. At the same time, an individual's group affiliations define his or her points of reference (Breiger Reference Breiger1974). The bipartite approach also incorporates the idea that social interaction and network evolution occur within institutional, organizational, and temporal social foci (Feld Reference Feld1981). Thus, a two-mode network representation can indicate social proximity between people via their shared participation in an event or membership in an organization, even if those people do not come into direct contact (Davis, Gardner, & Gardner Reference Davis, Gardner and Gardner1941; Latapy, Magnien, & Del Vecchio Reference Latapy, Magnien and Del Vecchio2008; Opsahl Reference Opsahl2013).
In the Raleigh network, the institutions are elementary, middle, and high schools. Shared school attendance does not, of course, guarantee that two people talked to one another, but it does suggest repeated exposure to many of the same people and sociolinguistic norms during childhood and adolescence. As a result, we anticipate that proximity in this network predicts linguistic similarity, particularly when this proximity is bracketed by temporal distance.
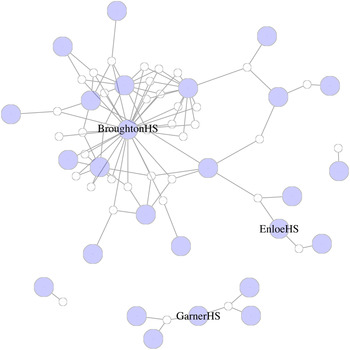
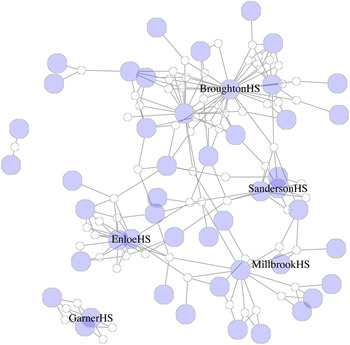
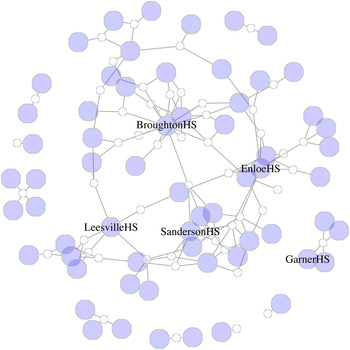
For each of the three generations in the Raleigh corpus, a two-mode network was constructed by representing individual speakers with one set of nodes and schools (elementary, middle, and high schools) with the other set of nodes (Figures 3–5). The smaller, unfilled circles represent speakers, and the larger, filled circles represent schools. A link between a speaker and a school indicates attendance at the school for at least a year.
Bipartite network, Genration 1. Larger, filled nodes represent schools and smaller, unfilled nodes represent speakers. A tie between a speaker and a school represents the speaker's attendance at the school for at least a year.

Bipartite network, Generation 2. Larger, filled nodes represent schools and smaller, unfilled nodes represent speakers. A tie between a speaker and a school represents the speaker's attendance at the school for at least a year.

Bipartite network, Generation 3. Larger, filled nodes represent schools and smaller, unfilled nodes represent speakers. A tie between a speaker and a school represents the speaker's attendance at the school for at least a year.

The networks reveal a changing school and demographic topography over time. In Generation 1 (Figure 3), most speakers in the sample attended the longstanding, geographically central Broughton High School and one of a small set of public elementary schools. A few speakers attended school in relatively working-class areas, either in East Raleigh, including Enloe High School (which opened in 1962), or to the south of Raleigh in Garner. Two speakers attended private schools. Thus Generation 1 is a very centralized network with a sparse periphery.
In Generation 2 (Figure 4), it is still the case that many speakers in the sample attended Broughton High School and associated middle and elementary schools, but now there is also a new North Raleigh periphery including Sanderson High School, which opened in 1969. Enloe High School continues to represent a less affluent East Raleigh community. Millbrook High School to the northeast predates the tech migration; some families during this time moved from the Enloe district to the Millbrook district, hence the multiple ties between these two areas. The movement from East to Northeast Raleigh was, according to some Raleigh speakers, motivated by the racial integration of local schools during the 1960s: Enloe was the first integrated high school in Raleigh. As in Generation 1, some speakers attended Garner schools to the south of town, and some attended private schools.
In Generation 3 (Figure 5), the sample reflects an expanded North Raleigh, now with Leesville High School (which opened in 1993) in addition to Sanderson. The other significant change is that Enloe High School began offering magnet courses in 1980 and subsequently expanded its magnet program. (Magnet courses are for qualifying students from any school district in the area.) For the next decade, Enloe was the only high school in Raleigh to offer a magnet program, and so its student population shifted from a local, East Raleigh majority to a mixture of high-achieving students from around the county plus a local, largely non-White base. Many Enloe students attend elementary and middle schools in North Raleigh or central Raleigh, and so Enloe is well connected to other parts of the network in Figure 5, in contrast with its earlier, relatively peripheral position. As in the previous generations, some students attend private schools, and a few attend very new, far-North Raleigh pubic schools.
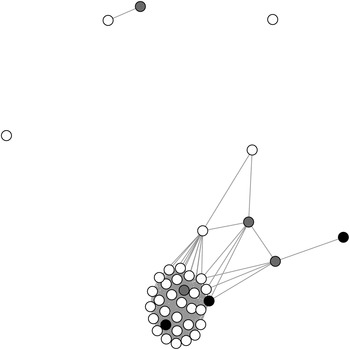
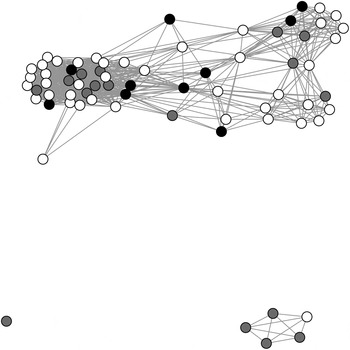
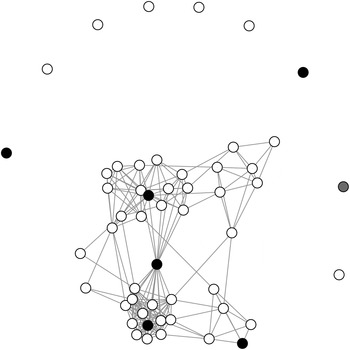
Many network-analysis procedures require one-mode rather than two-mode networks. For this reason, two-mode networks are often ‘projected’ to their one-mode versions: two people tied to the same institution in the two-mode network become tied directly to each other in the one-mode network, and the institution nodes are removed. Figures 6–8 show the one-mode projections of Figures 3–5, respectively, such that all nodes represent individual speakers and ties indicate co-attendance at a school, possibly at different points in time. The node colors indicate occupational category: black represents blue-collar speakers, grey represents unskilled white-collar speakers, and white represents professional white-collar speakers.
One-mode projection of the Generation 1 bipartite network (Figure 3). Colors indicate occupation: black = blue-collar speakers, grey = unskilled white-collar speakers, and white = professional white-collar speakers.

One-mode projection of the Generation 2 bipartite network (Figure 4). Colors indicate occupation: black = blue-collar speakers, grey = unskilled white-collar speakers, and white = professional white-collar speakers.

One-mode projection of the Generation 3 bipartite network (Figure 5). Colors indicate occupation: black = blue-collar speakers, grey = unskilled white-collar speakers, and white = professional white-collar speakers.

Our reasons for avoiding standard sociolinguistic network indices are summarized above. Nevertheless, we anticipate and briefly discuss two reasons for which school-based bipartite networks may be considered unsuitable for modeling network structure in sociolinguistics.
First, an advantage of many sociolinguistic network indices is their inclusion of information about factors likely to influence a speaker's symbolic use of local linguistic variants, such as voluntary engagement in community events or cultural practices (V. Edwards Reference Edwards1986; Lippi-Green Reference Lippi-Green1989) and attitudes toward the community (W. Edwards Reference Edwards1992). By contrast, a speaker's position in the Raleigh bipartite network only tells us the speaker's geographic location during childhood and adolescence, as well as the speaker's network position relative to others in the sample. This information is useful in its own right, in the absence of information about voluntary engagement, in two respects. First, the question at hand is about the role of nonvoluntary position in the network structure in shaping the distribution of linguistic variants, specifically the role of embeddedness in a network that has a dense core corresponding to the oldest schools and neighborhoods, which predate dialect contact. Network position is, of course, not independent from local identity and symbolic choices, just as gender and occupation are not. But we are trying to model childhood and adolescent network in a way that lets us test whether speakers near the dense urban core of the network differ linguistically from speakers who are not deeply embedded in the network. We expect that this type of analysis can ultimately advance the study of the symbolic use of linguistic variants insofar as it clarifies the role of nonvoluntary network position. Additionally, given that Raleigh is a dialect contact setting, we can reasonably assume that long-term linguistic accommodation drives the observed linguistic change. So our focus on schools, inevitably the site of face-to-face interaction among adolescents, is more appropriate for Raleigh than it would be for settings in which linguistic differences arise chiefly from differential symbolic choices.
A second potential critique of our approach is that a speaker's mere attendance at a school tells us nothing about his/her adolescent friendship group, the cluster of people with whom the speaker voluntarily interacted and identified. Ethnographic sociolinguistic studies of adolescent networks at school (Eckert Reference Eckert2000; Moore & Podesva Reference Moore and Podesva2009; Kirkham Reference Kirkham2015) demonstrate that a speaker's linguistic exposure and linguistic practice during adolescence cannot be adequately summarized as the product of elementary, middle, and high school attendance.
Our response to this point has to do with weak ties. If we adopt the theory put forth by Milroy & Milroy (Reference Milroy and Milroy1985, 1992) that linguistic innovations spread through multiple weak-tie encounters in shops, waiting rooms, and so on, then we can assume that non-Southern variants diffused at least in part across weak ties within schools, between speakers who did not belong to the same friendship groups. In that case, the bipartite school networks allow a good model for sociolinguistic network analysis. More generally, bipartite networks are useful in characterizing speakers' positions in the overall community network in large urban settings where there are many weak ties, as opposed to the smaller, dense networks of foundational studies.
Cohesive blocking and depth
In Figures 6–8, some nodes are embedded within dense clusters where they are tightly interconnected to many other nodes in their local community. Other nodes are nested within sparser portions of the network where they are interconnected through only a few pathways. The network concept of structural cohesion refers to the extent to which some sections of a social network are more cohesive or tightly knit than other sections. Cohesive groups are characterized by larger numbers of independent and redundant pathways among members of the group where members are connected to many others.
Considerable theory and evidence indicates that social action within cohesive networks is distinct from action embedded in sparser network communities (Simmel Reference Simmel1950; Coleman Reference Coleman1988). Norm enforcement, diffusion potential, and peer influence are stronger within cohesive groups (Friedkin Reference Friedkin1984, Reference Friedkin2004). Cohesive network structures ensure that information and social norms are regularly encountered and affixed. Individual divergence from these social norms is also more readily encountered and sanctioned within dense networks. As a consequence, pairs of people who are co-present, or mutually embedded, within cohesive social groups, where many individuals mutually share friends-of-friends, are more similar in their opinions and behaviors, even as compared to two individuals who are tied to one another but share few connections to mutual acquaintances or friends.
Moody & White (Reference Moody and White2003) formalize structural cohesion and develop a cohesive blocking procedure for identifying hierarchically nested cohesive groups within a large social network. The most cohesive groups are completely connected cliques where all members are directly connected to one another. K-connectivity refers to the number of nodes one would need to remove to disconnect the subgroup. Intuitively, a highly cohesive group does not dependent on a single individual or pathway to maintain the group's connection; highly cohesive groups are robust to perturbations of the network structure. More cohesive subgroups are typically hierarchically nested within less cohesive sets. Consider, for example, a group of 100 connected nodes that can be disconnected via the removal of k nodes. When the group of 100 nodes has been disconnected, there may nevertheless remain smaller connected subgroups. If k is the level of connectivity of the original group of 100 nodes, then cohesive blocking recursively identifies all connected subgroups with k + 1 connectivity, and so on. The recursive blocking routine uncovers the hierarchically nested structure of the network, first removing weakly connected nodes at shallow layers and uncovering more deeply and strongly tied groups.
The cohesive blocking routine yields a network metric that is analytically useful for describing the relative positions of individual nodes and their relationships to others in the network. A node's maximum cohesion is the k-connectivity of the most cohesive set in which it is embedded. This metric describes the extent to which an individual node is embedded within sparse or cohesive portions of a network, and higher scores indicate that a node's subgroup is more tightly knit. Moody & White use cohesion as an independent variable in regression models predicting US adolescents' feelings of belonging in their school communities.
We applied the cohesive blocking routine to each of the three generational one-mode school co-attendance networks. For the Raleigh network, the value of cohesive blocking is that it finds the most well-connected subgroup (block) to which each speaker belongs. Speakers who attended the same schools as many other speakers belong to dense, well-connected subgroups that survive multiple iterations of cohesive blocking, while speakers who attended geographically peripheral or small private schools are removed at earlier stages.
A block's cohesion value is highly sensitive to its number of nodes, and thus the size of the network. For example, a completely connected component with five members has a cohesion value of 4 while a completely connected component with eleven members has a cohesion value of 10. While these values may be substantively meaningful if the groups are in the same network, it is difficult to compare them across networks of various sizes. It is also problematic when the speaker sample is biased rather than representative of the community; in the Raleigh corpus, for example, there are disproportionately more speakers who attended Broughton than either Enloe or Garner. To overcome this limitation, we instead use a depth score to describe maximum cohesion and mutual embeddedness. Depth refers to the hierarchical layer of a speaker's most cohesive block—or the number of iterations before the node is removed in the cohesive blocking routine. Two speakers may occupy different blocks but have comparable levels of integration in the overall Raleigh network. Using depth allows us to compare cohesive partitions across networks of different sizes and densities. Importantly, cohesive depth offers an empirically tractable method of assessing network integration, which can be applied across diverse sociolinguistic settings.
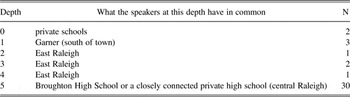
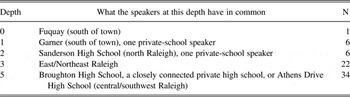
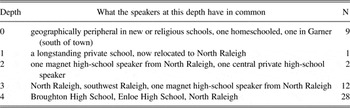
Tables 6–8 give broad definitions for the depth scores at each generation in Raleigh. While high schools are used to define each depth level, two speakers who attended the same high school may have different depth scores by virtue of their elementary and middle schools. In Tables 6–8 higher depth corresponds to greater network proximity to Raleigh's urban core. This is a mostly affluent, dense area of the network that predates the tech-driven migration of Northerners to Raleigh. In Generations 1 and 2, most of the speakers with depth scores of 5 attended Broughton High School, the oldest high school in Raleigh. Low depth scores in these generations correspond to schools south of town (Garner or Fuquay), east of the urban core (Enloe, still relatively working class at the time), or private schools. The first North Raleigh schools emerged during Generation 2, and speakers who attended them have depth scores of 2 or 3. That is, they are nearer in the network to the urban core than the south Raleigh speakers are. By Generation 3, the magnet system has resulted in a greater number of links between the urban core (Broughton), East Raleigh (Enloe), and some near-North Raleigh schools.
Depth scores and broad definitions: Generation 1.

Depth scores and broad definitions: Generation 2.

Depth scores and broad definitions: Generation 3.

Evaluating network as a predictor of linguistic variation: Part 1
We now ask whether depth contributes to an understanding of the distribution of Southern and non-Southern vocalic variants, when considered together with the effects of age, sex, and occupation. In particular, does membership in a dense, central area of the network (i.e. high depth) correlate with retention of SVS variants? The predictions we make about the relationship between depth and linguistic Southernness vary by generation. In Generation 1, the retreat from the SVS had mostly not yet begun, and North Raleigh schools, in the current sense, did not yet exist. We thus expect no significant depth effects. In Generation 2, the decline of the SVS began, North Raleigh schools were emerging, and white flight drove some families from the Enloe district to the Millbrook district. These processes continued in Generation 3, in addition to the onset of Enloe's magnet program. North Raleigh speakers with low depth are predicted to have had relatively frequent exposure to non-Southern dialects and infrequent exposure to the indigenous Southern dialect. By contrast, low-depth non-North Raleigh speakers, who by definition are network-distant from the urban core and from North Raleigh, are expected to have had mainly exposure to Southern dialects and infrequent contact with the Northern migrants. We therefore additionally add, to the Generation 2 and Generation 3 analyses, the interaction between depth and attendance at North Raleigh vs. non-North Raleigh schools.
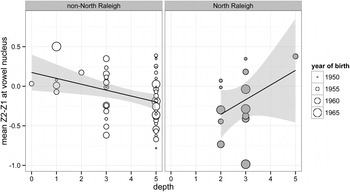
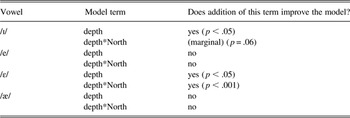
For each vowel at each of the three generations, the multilevel regression models containing the social factors of year of birth and occupation, reported in Table 4, were replicated with depth added as a fixed effect. For Generations 2 and 3, a further set of models includes the interaction between depth and the binary variable of North Raleigh vs. non-North Raleigh. In Generation 1, depth does not significantly improve the model for any vowel, as expected. In Generation 2, however, the addition of depth improves the models for both /ɪ/ and /ε/ (Table 9), the same vowels that showed neighborhood effects. Subsequent models with the interaction between depth and North Raleigh vs. non-North Raleigh further improve the model fit (though only marginally for /ɪ/). For both vowels, the nature of the effect is such that North Raleigh speakers are on average less Southern, and as predicted, the correlation between depth and linguistic Southernness is positive for North Raleigh speakers but negative for non-North Raleigh speakers (cf. Figure 9 for /ε/). That is, speakers who attended North Raleigh schools, which were filling rapidly with both Southerners and non-Southerners at the time, were more likely to acquire the Southern vocalic variants if they were network-proximal to the urban core. Speakers who attended schools in the urban core or in neighborhoods to the east or south were more likely overall to acquire the Southern variants, but especially if they were not closely connected to the urban core. This is probably because consistent, face-to-face interaction with non-Southerners could happen in the urban core but not in more peripheral eastern and southern areas (which are only a few miles away). Adding the interaction between depth and sex does not improve the models for /ɪ/ or /ε/, nor does the interaction between depth and year of birth (but see below for important revisions to this point).
Relationship between depth and mean Z2–Z1 for /ε/, North vs. non-North Raleigh, Generation 2. Among North Raleigh speakers, greater depth in the Raleigh network corresponds to a more Southern vowel. The opposite trend emerges in non-North Raleigh.

Depth effects in multilevel regression: Generation 2. Depth is never significant in Generations 1 and 3.

Depth does not significantly improve the model for any vowel in Generation 3, just as the neighborhood variable showed no significant effects in Generation 3 (Table 4). Again, we assume that linguistic focusing had progressed by this later point in time, but it is also the case that the emergence of the magnet program first at Enloe High School, and then at other schools, resulted in new connections between different areas of the school network.
Summarizing the results thus far: For two of the four vowels, /ɪ/ and /ε/, network variables show significant effects in Generation 2. The categorical neighborhood variable revealed that speakers who attended private schools or Garner (south of town) schools produce the most Southern variants of these vowels. Similarly, models with the depth variable show that in areas other than North Raleigh (i.e. central, eastern, and southern areas), network distance from the urban core is associated with greater linguistic Southernness with respect to /ɪ/ and /ε/. Conversely, in North Raleigh, closer connection to the urban core is associated with greater linguistic Southernness. The other two vowels, /e/ and /æ/, show no significant network effects, but as revealed in previous models (Table 4), /e/ shows occupational effects at Generations 2 and 3, and /æ/ is significantly more Southern-shifted among males at Generation 3.
One advantage of cohesive blocking is its generalizability: it offers a definition of network position that can be applied across networks, regardless of the qualitative meaning of ties, thereby enabling relatively transparent hypothesis testing. Additionally, cohesive blocking largely removes the analyst; there are no decisions to be made about calculating network scores or about determining threshholds between high and low centrality (or degree, or multiplexity, etc.). The procedure is also easy to implement.
Despite these strengths, linear regression analysis of a speaker-level depth score, or any network measure, offers limited information about whether and how network characteristics relate to linguistic variation. In any setting where linguistic variance increases, either due to contact, as in Raleigh, or to community-internal innovation, we expect network proximity to explain part of the variance: people who are network-proximate will be less different from one another than people who are network-distant from each other. That is, we expect network structure to play a role in shaping either the emergence of new linguistic norms in the community or the stability of existing norms. The foregoing regression analysis, which instead asks whether a more embedded network position corresponds to a more Southern vowel system, addresses a related but different hypothesis. In order to take the first step toward being able to say that network exposure causes changes in linguistic behavior, or that there is at least the potential for any kind of contagion effect in the network, we need to show that network ties and linguistic similarity are correlated.
We now turn to a relational network analysis that more directly addresses the role of network in determining linguistic conservatism by using the linguistic difference between pairs of speakers as the dependent variable.
Evaluating network as a predictor of linguistic variation: Part 2
A relational network analysis asks how position and proximity in a network explain the similarities and differences in linguistic (or other) traits among a community of speakers. A typical approach is to construct dyadic data (that is, data about the difference between two people) from every possible pair of individuals in a network and use the presence or absence of a network tie between each possible pair to predict their similarity. However, applying standard linear regression and its generalizations to dyadic data constructed from a network matrix has been shown to produce biased estimates due to the problem of structural autocorrelation and the nonindependence of observed dyads (Krackhardt Reference Krackhardt1988). As a solution, network scholars have proposed Quadratic Assignment Procedure (QAP) as a nonparametric approach to testing hypotheses for network variables. QAP is a straightforward way of testing the hypothesis that a network tie predicts similarity on a behavior (Mizruchi Reference Mizruchi1993; Moody & White Reference Moody and White2003; Benton Reference Benton2016). QAP regression involves regressing a matrix of actor attribute similarities on a matrix representing relational data, such as a network. Consider a dependent variable defined as a speaker-by-speaker matrix where cell i,j contains a similarity score of some measure between speakers i and j. In our case, the dependent variable matrix is an acoustic difference matrix where cell i,j contains the difference between speaker i’s and speaker j’s mean Z2–Z1 for a given vowel. Thus, for each pair of speakers, the matrix cells indicate their similarity with respect to that vowel. QAP regression allows us to test whether this acoustic difference matrix is correlated with a network adjacency matrix or other relational data matrix. This tests the hypothesis that two speakers' network proximity is correlated with their linguistic similarity.
In the following QAP models, the dependent variable is a matrix of differences in mean Z2–Z1 for each pair of speakers, for each vowel separately. The independent variables are given in (1) below.
-
(1)
-
a. A matrix of j’s year of birth (such that each column contains one value for year of birth): This matrix is one of two variables allowing for change over time within each generation.
-
b. A matrix of the absolute difference in year of birth between i and j, hereafter called the age difference matrix : This matrix is the second of the two variables allowing for change over time within each generation; all else being equal, the age difference matrix is predicted to show a positive correlation with the matrix of linguistic differences.
-
c. A binary network matrix encoding the presence or absence of a direct tie between i and j in the projected one-mode network: Although we are primarily interested in how members of cohesive subgroups are more similar, it is important to control for the presence of a direct tie between speakers i and j to ensure that the similarity within cohesive subgroups is not simply the result of a direct tie.
-
d. A ‘depth’ matrix encoding the depth of the deepest cohesive block in which pairs of speakers co-occur; this is a metric of mutual embeddedness : In the matrix, cell i,j contains the depth score for the deepest block that contains both i and j. We anticipate that pairs of speakers jointly embedded in deeper blocks exhibit greater linguistic similarity than speaker pairs embedded in ‘shallower’ blocks. All else being equal, the correlation between this matrix and any matrix of mean vowel differences is predicted to be negative: deeper mutual embeddedness should correspond to less linguistic difference.Footnote 2
-
e. A matrix representing the interaction between the age difference matrix and the depth matrix: This is the element-wise product of age difference and depth.
-
f. A matrix of j’s occupation
-
g. A binary matrix of occupation differences: Cell i,j is coded one if speakers i and j are in the same occupational group and zero otherwise.
-
h. A matrix of j’s gender (male or female)
-
i. A matrix representing the interaction between the gender matrix and the depth matrix: This is the element-wise product of gender and depth.
-
For each vowel at each generation, a total of eight QAP models were run, each model adding a predictor variable to the previous model (other than models 1 and 2, which separately assess the strongly correlated year of birth and age differences matrices):
-
QAP models
-
1 year of birth
-
2 age differences
-
3 age differences, binary network
-
4 age differences, binary network, depth
-
5 age differences, depthFootnote 3
-
6 age differences, depth, depth*age
-
7 age differences, depth, depth*age, gender
-
8 age differences, depth, depth*age, gender, depth*gender
-
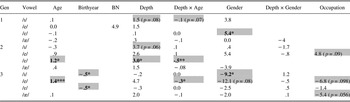
Table 10 lists the coefficients from the best QAP models for each vowel at each generation, as determined by the R2. Shaded cells correspond to significant or marginal effects. When a cell in a given column is blank, this means that the predictor variable in that column was not a term in the best model for that vowel.
Coefficients from the best QAP model for each vowel at each generation, as determined by the R2. (Coefficients are multiplied by 100. Significant effects are in bold; gen = generation, BN = binary network.)

In Generation 1, the absence of significant main effects for age difference is consistent with the absence of apparent-time change in this generation in the earlier multilevel regression. Gender shows the only significant effect, and only for /ε/. The positive coefficient here indicates that males, relative to females, are more linguistically different from their network alters overall. This appears to result from males having both the highest and the lowest mean values for /ε/; in particular, three males with professional occupations have very low (non-Southern) values, though other professional males have higher values. For /ɪ/, there are near-significant depth effects, and the positive main effect for depth indicates that deeply embedded pairs of speakers are more different from one another than other pairs. Given that the high front pair, /i/ and /ɪ/, was never fully Southern-shifted in Raleigh, it is not surprising to find evidence of variability for this vowel, rather than a stable community norm, prior to the onset of dialect contact. In general, however, the QAP analyses return few social effects in Generation 1, as expected.
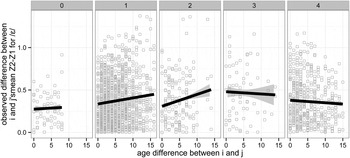
In Generation 2, the first period of contact-induced linguistic change, the QAP results suggest a more complex sociolinguistic setting. In this generation, which spans only a sixteen-year range, there is a significant and positive main effect of age difference for /ε/, indicating that speakers far apart in age are also linguistically different. For the same vowel, there is a positive main effect for depth: two speakers mutually embedded at a deep network level are predicted to be more linguistically similar than speakers mutually embedded at a shallower network level. (The coefficients associated with depth for the other vowels in Generation 2, while not significant, are also positive.) We elucidate the depth effect in the case of /ε/, as well as its significant interaction with age difference, via Figure 10. The y-axis represents the linguistic difference between speakers i and j with respect to their mean Z2–Z1 for /ε/; higher values mean greater linguistic difference. Each panel in the graph corresponds to one level of mutual depth. For example, circles in the leftmost panel correspond to dyads that are mutually embedded at the most shallow level. The major insight available from Figure 10 is that age difference is more positively correlated with linguistic difference among speakers mutually embedded at shallow network levels, relative to speakers mutually embedded at deep network levels. At depth 1 and 2, linguistic difference rises as age difference rises, whereas at depth 3 and 4, the positive correlation disappears as speakers of different ages are not very different linguistically. This is consistent with the conclusion that young speakers in Raleigh's affluent core maintain the SVS to a greater extent than those in the Northern periphery. At depth 0, unlike at other depth levels, all of the pairs of speakers in this generation are very close in age, and therefore linguistically similar.
Difference in mean Z2–Z1 for /ε/ in Generation 2, as a function of age difference and depth. Each panel represents one depth level.

The QAP results for Generation 2 also include a marginally positive main effect of depth for /ɪ/. This effect is largely due to a single speaker having an unusually Southern /ɪ/ for a speaker of his age and network profile. The linguistic difference between him and several others is responsible for a set of high outlier data points at depth 4. This speaker is not only blue-collar (recall that blue-collar speakers retain the SVS to a greater degree than others) but also directly manages other blue-collar employees, who may have grown up in rural Southern areas where the SVS remains intact. For that reason, he has a great deal of exposure to, and motivation to use, Southern linguistic variants.
There is also, in Generation 2, a marginally positive main effect of occupation for /e/. This indicates that white-collar speakers as a group are more linguistically different from their alters than blue-collar or unskilled white-collar speakers, suggesting that some white-collar speakers were retreating from the SVS at this stage. This is consistent with the significant main effect of occupation for /e/ in the earlier multilevel regression (cf. also the significant differences between industries for /e/ in Forrest & Dodsworth Reference Forrest and Dodsworth2016). In general, the QAP results for Generation 2 point to a contact setting in which age, occupation, and network are all beginning to shape the retreat from the SVS.
There are two salient differences between the QAP results for Generations 2 and 3, respectively. First, age effects are more prominent in Generation 3: there are significant main effects of either age difference or year of birth for three of the four vowels. This likely reflects both a more advanced stage of linguistic change and the fact that Generation 3 spans twenty-six years, in contrast with sixteen years in Generation 2. The positive age differences coefficient for /e/ is in the expected direction. The negative year of birth coefficients for /ɪ/ and /ε/ indicate the leveling off of linguistic change among the youngest speakers; very young speakers are linguistically similar to one another as stable norms emerge. Second, depth as a main effect is never significant in Generation 3, reflecting the community's changing network structure. (Depth was also not significant in the mixed effects regressions for Generation 3.) Instead, gender and occupation consistently appear in the best models in Generation 3, other than occupation in the case of /ɪ/. The gender coefficients are consistently negative, indicating that females are more linguistically different from their alters, relative to males. For /ɪ/, the marginal main effect of depth in Generation 2 has been replaced by a significant interaction between depth and gender. For /e/, the (small but significant) negative effect associated with the interaction between depth and age is accompanied by marginal gender and occupation effects, such that females and blue-collar speakers are more linguistically different from their alters, relative to males and white-collar speakers, respectively. The same marginal occupation effect shows up for /æ/. Whereas Generation 2 showed marginal evidence of a white-collar lead in the case of /e/, Generation 3's negative occupation coefficients suggest that blue-collar speakers—who are in the minority in the Raleigh corpus—are more different linguistically from others because they are retaining SVS forms.
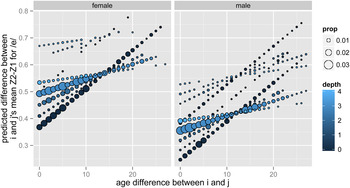
Figure 11 elucidates the Generation 3 model for /e/, where significant effects of age difference and its interaction with depth are joined by marginal effects of gender and occupation. The y-axis shows predicted values for the dependent variable (linguistic difference), calculated by building a linear equation with the QAP model's coefficients. The x-axis represents the age difference between i and j, and circle size represents the proportion of data that each circle represents. Lighter blue indicates deeper mutual network embeddedness. The graph shows that greater age difference is associated with greater linguistic difference, but the age effect is moderated by depth: for pairs of speakers who are mutually embedded at deep network levels, the effect of age difference is weaker than for pairs of speakers whose mutual embedding is shallow (either because they are located at different positions in the network or because they are both network-peripheral). In this context, females are more linguistically different from their network alters overall than males. In both panels, each depth level appears twice, once higher and once lower in the panel. The lower set in each panel corresponds to white-collar speakers, and the higher set corresponds to blue-collar speakers (who account for a much smaller proportion of the data, as indicated by circle size). We can conclude that, whereas /e/ was sensitive only to occupation in Generation 2, by Generation 3 its distribution is chiefly shaped by age and network, with gender and occupation showing secondary effects.
Predicted values for /e/ at Generation 3. Lighter color indicates that speakers i and j jointly occupy a deeply embedded network position. Circle size indicates the proportion of data that each circle represents at each depth level.

The gender effect in Generation 3 is due in part to an outlying speaker with an unusual social trajectory. She is well embedded in the school network by virtue of attending Broughton High School before transferring to a North Raleigh high school. She grew up in a white-collar family, but she has a blue-collar job. She lives in a South Raleigh neighborhood and is married to a member of a different ethnic group. She has departed from her childhood both geographically and socially, and her unusually Southern-shifted vowels may be a symbolic element of this departure. This speaker, together with the unusually Southern blue-collar male speaker in Generation 2, described above, offers evidence that even when adolescent peer network influences adult patterns of variation, as in the case of /e/ in Generation 3, the use of symbolic linguistic resources remains an individual practice.
The QAP models return significant or near-significant main effects of depth for /ε/ and /ɪ/ in Generation 2 but not in Generation 3, just as the earlier multilevel models did. However, whereas the interaction between depth and year of birth did not improve the multilevel regression models (Table 9), the QAP models show that for some variables, depth interacts with age difference, such that the linguistic difference between two speakers far apart in age is smaller when they are mutually embedded at a deep level in the community network. This is true for /ε/ in Generation 2 and /e/ in Generation 3. The interaction between mutual embeddedness and age difference in the QAP results directly indicates that a dense area of the local network corresponds to linguistic homogeneity in the context of great variability and change over time. This interaction is significant in the QAP models but not in the multilevel regression models because the QAP models ask a fundamentally different question. Rather than asking whether the vowel's Southernness (its value of Z2–Z1) correlates with depth or year of birth, the QAP models ask whether the linguistic difference between two speakers correlates with their mutual embeddedness and age difference. In this way, the QAP models represent a step toward asking whether and in what ways network structure influences linguistic change.
CONCLUSION
Two main empirical conclusions emerge from the analysis of network in relation to the retreat from the SVS in Raleigh. First, in Generation 2, network proximity to Raleigh's urban core, as indexed by depth in the hierarchy of cohesive blocks, correlates positively with linguistic Southernness for North Raleigh speakers, and negatively for non-North Raleigh speakers, for the vowels /ɪ/ and /ε/ (Table 9). In both cases, a network position offering more consistent exposure to indigenous (Southern) linguistic variants favors the retention of those variants in the face of their ongoing disappearance from the community. The correspondence between membership in a high-cohesion network component and the maintenance of vernacular forms is consistent with the correlation between local network integration and use of local vernacular variants in Belfast (Milroy Reference Milroy1980), Harlem (Labov Reference Labov1972), Grossdorf (Lippi-Green Reference Lippi-Green1989), Detroit (Edwards Reference Edwards1992), and other studies.
The second conclusion, derived from the QAP models, is that co-membership in a high-cohesion network cluster moderates linguistic difference for speakers far apart in age, for /ε/ in Generation 2 and /e/ in Generation 3. This finding is somewhat analogous to the favorable effect of network integration upon vernacularity in other sociolinguistic network studies, but only in the sense that the predicted effect of age—that is, the larger the age difference, the greater the linguistic difference—is weaker when two speakers are both from the dense, central core of the network. These interactions are our most direct evidence that densely connected areas of the network correspond to the maintenance of local linguistic variants in the context of ongoing change.
Regarding the absence of significant network effects for /æ/in either the multilevel regression or the QAP regression, it may be relevant that raised and fronted variants of /æ/ were likely present in many of the in-migrants' dialects, particularly those from New York. Although the incoming variants of /æ/ would have differed from local variants with respect to the shape of the formants' trajectories as well as internal factors, they may nevertheless have influenced the social evaluation of /æ/ in Raleigh. We can also ask why /e/ shows no significant network effects in Generation 2. In the present analysis and in previous work (e.g. Forrest & Dodsworth Reference Forrest and Dodsworth2016), /e/ shows strong occupation effects. This variable appears to carry class-related social meaning that outpaces network effects during Generation 2. Previous network research, including Milroy (Reference Milroy1980), Labov (Reference Labov2001), and Edwards (Reference Edwards1992), similarly finds that some linguistic variables show significant network effects, while others show effects of class or sex.
An important methodological conclusion is that the bipartite network approach yields effects in the expected direction in the absence of further individual-level data about participation in community life or friendship networks. This points to the possibility of fruitful sociolinguistic network analysis using institution-based data, which is easy to collect and verify. It also lends itself well to a model of the community's holistic network structure, in contrast to scores along a traditional network index. The depth measure similarly has the advantage of offering a nuanced view of community network structure that can be applied in the same way to network data from any community. We have also tried to move beyond atomistic characterizations of speakers' linguistic traits, and conceive of linguistic variation as relational by evaluating linguistic similarity between pairs of speakers. This type of relational approach is useful to sociolinguists because it models linguistic difference—whether driven by contact or by local innovation—as a function of network proximity: people with similar network positions are predicted to be less different from one another than people with different network positions. As we have argued, this approach allows us to ask directly whether and in what ways linguistic variables travel through structures of social ties.
Nevertheless, sociocultural knowledge of the community remains essential to sociolinguistic network analysis. For example, the Raleigh bipartite network does not by itself reveal the important information that Enloe High School's magnet program transformed it from an East Raleigh working class school to a prestigious institution that draws students from all over the city. Rather, the bipartite approach is a tool for modeling network information within a larger, multi-dimensional analysis.