Implications
Veal calf production corresponds to raising an animal from 50 kg body weight (BW) to more than 250 kg BW in a short period of time with average daily gain greater than 1 kg. A good estimation of energy requirements of veal calf is of importance for the economic sustainability of this production. Additionally, a correct knowledge of responses of protein, fat and BW gain may allow predicting accurately the growth response of the calf. The present study expects measuring the evolution of response of protein, fat and BW to feed intake as the calves get older for estimating their energy requirement.
Introduction
Growth rate and composition of body weight (BW) gain in veal calves can be modified by nutrient supply and feeding level (FL) (Donnelly and Hutton, Reference Donnelly and Hutton1976; Gerrits et al., Reference Gerrits, Tolman, Schrama, Tamminga, Bosch and Verstegen1996). Several studies involving different FL have been conducted during the last decade in veal calves using the comparative slaughter technique (Gerrits et al., Reference Gerrits, Tolman, Schrama, Tamminga, Bosch and Verstegen1996; Diaz et al., Reference Diaz, Van Amburgh, Smith, Kelsey and Hutten2001; Bartlett et al., Reference Bartlett, McKeith, Vandehaar, Dahl and Drackley2006). Nevertheless, little attention has been paid to the dynamic change of the response of the calf over short periods of time. In addition, energy requirements for maintenance and gain are frequently expressed per kg BW0.75 (NRC, 2001). Recent work demonstrated that BW0.85 is more appropriate to calculate metabolic BW in veal calves (Labussière et al., Reference Labussière, Dubois, van Milgen, Bertrand and Noblet2008a). An inappropriate exponent to express metabolic BW can bias the partitioning of energy between maintenance and protein and lipid deposition (PD and LD) during the development of the animal and estimates of partial efficiencies for PD and LD (k p and k f) would be biased (Noblet et al., Reference Noblet, Karege, Dubois and van Milgen1999). The objectives of this study were (1) to quantify the effect of feed intake on (components of) heat production (HP) and on PD and LD in veal calves during 26 weeks of fattening using the indirect calorimetry technique and (2) to estimate metabolizable energy (ME) requirements for maintenance and growth.
Material and methods
The present experiment complied with French laws on animal experimentation and was conducted under the direction of J. Noblet (authorization no. 04739) and G. Bertrand (authorization no. 07558).
Experimental design
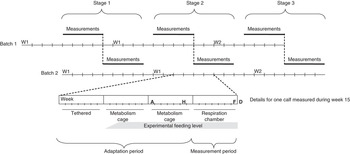
This experiment was designed to study the effect of four FL on PD and LD and HP using nitrogen and energy balance techniques. Measurements were conducted at three stages of fattening (Figure 1): one during the growing period (stage 1: 5 to 8 weeks of fattening) and two during the finishing period (stage 2: 14 to 17 weeks of fattening; stage 3: 23 to 26 weeks of fattening). Week 1 corresponds to the first week after purchase and arrival of the calves at the facilities at 7 to 15 days of age. The measurements were conducted on four calves per FL and per stage and consisted of a 6-day nitrogen and energy balance followed by a fasting day for measuring fasting heat production (FHP). Two successive batches of calves were used and calves of the second batch were purchased 4 weeks after those of the first batch (Figure 1). Calves were raised at the experimental station of the Institut de l’Elevage (Le Rheu, France) and measurements were conducted at INRA facilities (Saint-Gilles, France) located at 10 km from Le Rheu.
Distribution of stage of measurements and details for adaptation and measurement periods for one calf. A: arrival at the INRA facilities, H: calf is harnessed for total feces collection, F: fasting day, D: departure from the INRA facilities.

Experimental diets and feed allowance
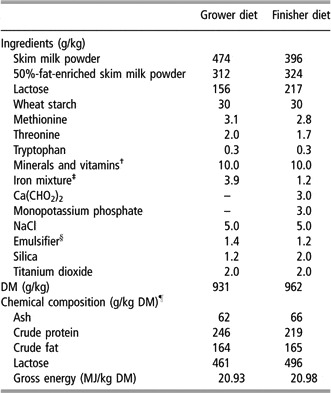
The study involved one grower diet and one finisher diet formulated using skim milk powder, 50% fat-enriched skim milk powder (the enrichment originated from tallow (80%) and coconut oil (20%)) and lactose (Table 1). Titanium dioxide was included as an indigestible marker to correct for possible incomplete feces collection. As this did not occur, this information was not further exploited in the calculations.
Composition of milk replacers

DM = dry matter.
†The minerals and vitamins mixture provided (/g mixture): magnesium, 45 mg; retinol, 2000 IU; cholcalciferol, 400 IU; A tocopherol, 8 mg; ascorbic acid, 15 mg; thiamin, 1 mg; riboflavin, 1 mg; pyridoxine, 0.8 mg; cyanocobalamin, 0.008 mg; niacin, 4 mg; pantothenic acid, 2 mg; menadione, 0.25 mg; biotin, 0.01 mg; folic acid, 0.15 mg; choline, 50 mg; betaine, 20 mg; iron, 1 mg; copper, 1 mg; zinc, 4 mg; manganese, 5 mg; cobalt, 0.04 mg; iodine, 0.045 mg; selenium, 0.02 mg.
‡The iron mixture provided (/g mixture): thiamin, 4 mg; cyanocobalamin, 0.08 mg; folic acid, 1 mg; iron, 18.5 mg; copper, 4.8 mg; cobalt, 0.5 mg.
§The emulsifying agent contained soya fatty acids polyethylene glycol glycerol (60%) and silica (40%), Cognis, Germany.
¶As measured.
Liquid milk was reconstituted just before distribution by dissolving the powder in hot water (around 65 °C) to which cold water was added to achieve concentrations ranging from 130 to 175 g dry matter (DM) per kg of reconstituted milk as calves got older while maintaining the temperature within the range of 45 to 50°C. Before the adaptation period and after measurement period (Figure 1), calves were fed at 95% of a reference FL commonly used at the station: the daily amount of milk replacer powder corresponded to a percentage of BW, which decreased from 1.9% to 1.3% between week 2 and 27. This strategy was chosen to avoid long-term disturbances due to insufficient or excess feed allowance caused by the experimental protocol. At the INRA facilities, milk was given as two equal meals at 0845 and 1800 h using 79%, 87%, 95% and 103% of the reference FL (named FL79, FL87, FL95 and FL103 hereafter). The feed distribution was adjusted for each calf according to its BW at arrival and at entrance in the respiration chamber.
Animals, housing and management
Fifty male Prim’Holstein calves were used in this experiment. Each animal was designated to a treatment (14 for FL95 and 12 for each for the three other FL) for 2 weeks after the beginning of the fattening period. Every week (Figure 1), two calves receiving different FL were tethered for 1 week in a pen and then moved to cages with wood-slatted floors. After 1 week, they were transferred to the INRA facilities (Saint-Gilles, France) for further adaptation (1 week) and measurements. During the adaptation period, both cages were placed in the same room but separated by a curtain to avoid visual contact between the two calves. They were bucket-fed automatically without direct human contact just before drinking according to Labussière et al. (Reference Labussière, Dubois, van Milgen, Bertrand and Noblet2008b). Calves were harnessed with plastic bags 2 days before their entrance in the respiration chamber allowing for total feces collection. Some calves were measured twice but measurements with repeatedly used calves were considered independent due to the large delay between two successive measurements (8 weeks).
During the measurement week, the calf in its metabolism cage was placed in a 12 m3 open-circuit respiration chamber similar to those described by Vermorel et al. (Reference Vermorel, Bouvier, Bonnet and Fauconneau1973). The cage was mounted on force sensors producing an electrical signal proportional to the physical activity of the calf (Quiniou et al., Reference Quiniou, Noblet, van Milgen and Dubois2001). Animal position was estimated using an infrared beam placed across the cage at the bottom of the calf’s hip while standing. Temperature and relative humidity of the air in the chamber were maintained constant at 18°C and 70%, respectively. A 12 h lighting time scheme (from 0730 to 1930 h) was used. The two available respiration chambers were independent but equipped with microphones and speakers so that calves could hear each other. While in the respiration chamber, calves were fed automatically as in the previous adaptation week. The automatic feeder was placed on a weight sensor to detect the beginning of the milk replacer distribution. As calves drank immediately, this time was considered as the beginning of the meal.
Measurements and sampling procedure
Calves were weighed before the meal the morning following their arrival at the INRA facilities, before entering the respiration chamber and the morning after the fasting day (i.e. three times during 13 days). The quantity of milk replacer offered to each calf when housed in the INRA facilities was weighed at each meal. Milk replacer was sampled over the balance period jointly for the two calves measured simultaneously and samples were pooled per stage. Milk replacer refusals were weighed and sampled (20 ml) for each calf after each meal during the balance period and samples were stored at −20°C before analysis. Feces were collected and weighed daily on the morning prior to the meal. They were then stored at −20°C and pooled per calf over the 6-day balance period. To prevent microbial activity and volatilization of ammonia, urine was collected in buckets containing a solution of 120 ml H2SO4 (1.8 mol/l) during stage 1 or 240 ml during stages 2 and 3. The urine was weighed daily and an aliquot was taken and pooled per calf over the 6-day balance period and stored at 4°C for further analysis.
Gas concentrations (CO2, O2 and CH4) of outgoing air and ventilation rate were continuously recorded (60 times per second) and averaged over 10-s intervals according to procedures described by van Milgen et al. (Reference Van Milgen, Noblet, Dubois and Bernier1997) and Labussière et al. (Reference Labussière, Dubois, van Milgen, Bertrand and Noblet2008b). The urinary nitrogen losses in the air, recovered in condensed water and outgoing air, were collected according to the methods described by Noblet et al. (Reference Noblet, Henry and Dubois1987).
Chemical analyses
Samples of feed (one per stage) were analyzed for DM, ash, N, crude fat and lactose content according to standard methods (Association of Official Analytical Chemists, 1990); N and gross energy (GE) contents were also analyzed on weekly feed samples. Samples of milk replacer refusal were analyzed for DM; the composition of DM refusals was supposed to be identical to offered DM. Samples of feces were analyzed for DM, ash, crude fat, N and GE content. Samples of urine were analyzed for N content on fresh material and GE content was obtained after freeze-drying approximately 30 ml in polyethylene bags. The ammonia content of condensed water and extracted air was determined using an enzymatic method (Enzytec fluid; Scil Diagnostics GmbH, Viernheim, Germany).
Calculations
The BW at the end of the balance period was estimated from BW after fasting and BW loss during the fast (previously determined, Labussière et al., Reference Labussière, Dubois, van Milgen, Bertrand and Noblet2008b). Mean growth rate of the calf during the combined adaptation and balance periods (12 days) was calculated using the (measured) BW on the morning after the arrival at the INRA facilities and the (estimated) BW on the morning prior to fasting. Growth rate during the balance period was also calculated, which was used to estimate BW for each day during the balance period.
Dry matter intake (DMI) and apparent digestibility coefficients of DM, organic matter (OM), CP, GE and crude fat were calculated according to standard procedures. Nitrogen retention (RN) of each calf was calculated as the difference between ingested nitrogen and nitrogen lost in feces, urine, condensed water and extracted air. Digestible energy (DE) and ME were calculated according to standard methods excluding CH4 production (which was negligible and averaged 3 l/day). Total HP was calculated from gas exchanges according to the formula of Brouwer (Reference Brouwer1965). The first day in the respiration chamber was considered as an adaptation day and all calculations were carried out over the five subsequent days. Energy retention was calculated as the difference between ME intake and HP. Energy retained as protein (REp) was calculated from N balance, assuming an energy content of protein (RN × 6.25) of 23.6 kJ/g and energy retained as fat (REf) was calculated as the difference between total energy retained and energy retained as protein. Fat deposition was then calculated assuming an energy content of 39.7 kJ/g fat. The protein and lipid content of BW gain were calculated by relating these measurements to daily growth rate during the 12 consecutive days of adaptation and measurement.
Simultaneous measurement of O2 and CO2 concentrations in the respiration chamber, signals of force sensors, meals information (time of distribution and ingested quantity) and physical characteristics of the gas in the chamber were used to calculate the components of HP according to the modeling approach of van Milgen et al. (Reference Van Milgen, Noblet, Dubois and Bernier1997). The HP due to physical activity (AHP), to feed intake (short-term thermic effect of feeding, TEFs) and resting metabolism (RHP) were calculated from respective volumes of O2 consumption and CO2 production according to the formula of Brouwer (Reference Brouwer1965) excluding urinary nitrogen loss. For the fasting day, this modeling procedure was carried out on only the last 12 h, which resulted in only two components of total O2 consumption and CO2 production: one due to physical activity and the other one due to fasting metabolic rate at zero activity level. These latter volumes were used to calculate FHP, which corresponds to the asymptotic value of fasting metabolic rate at zero activity. The difference between RHP and FHP was assumed to correspond to a long-term effect of feeding (TEFl). Total thermic effect of feeding (TEF) was calculated as the sum of TEFs and TEFl. All energy traits were expressed relative to metabolic BW calculated as BW0.85 (Labussière et al., Reference Labussière, Dubois, van Milgen, Bertrand and Noblet2008a). Results on AHP and FHP have been combined with data obtained from other trials of our group (Labussière et al., Reference Labussière, Dubois, van Milgen, Bertrand and Noblet2008a) and will not be discussed in detail here.
Statistics
Diets differed between stage 1 and stages 2 and 3 but the difference was small and concerned a small reduction in CP content. In addition, this effect is partly confounded with the effect of stage. Consequently, the diet effect was ignored and only the effect of stage was considered in the statistical analyses. Apparent digestibility coefficients, components of nitrogen and energy balances, growth rate and composition of BW gain were tested for the effects of FL, stage, their interaction and week of measurement within a stage according to the following model:

where Y is the dependent variable, μ is the average intercept, FL is the effect of feeding level (FL79, FL87, FL95 or FL103), S is the effect of stage of fattening (1–3), W is the effect of week of measurements within one stage (1–4), and ε is an error term. The effect of week of measurement within a stage is to some extent a refinement of the effect of stage of fattening. This effect is mentioned in the tables but it will not be described in detail in the text.
The HP (MJ/day) was supposed to be a nonlinear function of BW and ME intake (HP = a × BWb + c × (ME intake)) and the parameters of this function (a, b and c) were estimated using PROC NLIN of SAS (2004). Additionally, the linear relationship between HP and ME intake (kJ/kg BW0.85 per day) was considered with stage of fattening as a fixed effect. The HP (kJ/kg BW0.85 per day) was also regressed against REp and REf in order to calculate MEm and k p and k f.
The response of protein, fat and BW gain (g/kg BW0.85 per day) to ME intake (kJ/kg BW0.85 per day) was evaluated using linear models including the interaction between stage of fattening and ME intake. Additionally, protein and fat gain (g/kg BW0.85 per day) was expressed as a function of ME intake and BW (Y = g + h × exp(i × BW) × (ME intake)) and parameters were estimated according to PROC NLIN of SAS (2004).
Results
The composition of diets offered to the calves is given in Table 1 and diet characteristics were in line with the experimental design. There were no major difficulties during the measurement and adaptation periods. For data analysis, the HP partitioning model failed to fit data for the fasting day of one calf during stage 3. The FHP of this calf was then estimated from its BW and ME intake (Labussière et al., Reference Labussière, Dubois, van Milgen, Bertrand and Noblet2008a). Two calves had feed refusals during the adaptation weeks and they were replaced by other calves that received the same FL since the beginning of the adaptation period.
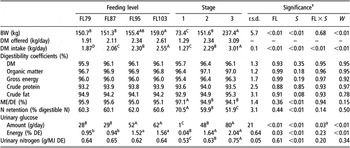
Mean BW of calves during measurement periods increased (P < 0.01) with stage of fattening from 73.4 to 237.4 kg (Table 2) and with FL from 150.7 to 159.0 kg (average values for the three stages). As designed, DMI increased from 1.87 to 2.55 kg/day with FL, and from 1.27 to 3.01 kg/day with stage of fattening. The interaction between stage and FL concerning DMI is due to the increasing difference in BW gain between the lowest and the highest FL as animals got older. As offered DM was calculated from BW at the entrance in the respiration chamber, DMI increased from 1.07 to 1.48 kg/day during stage 1 (+38.4%), from 1.96 to 2.74 kg/day during stage 2 (+39.3%) and from 2.57 to 3.44 kg/day during stage 3 (+33.7%).
Effects of feeding level and stage of fattening on apparent digestive and metabolic utilization of energy and nutrients in milk-fed calves (n = 48)

r.s.d. = residual standard deviation; DM = dry matter; ME = metabolizable energy; DE = digestible energy.
†Values were tested for the effects of feeding level (FL), stage of fattening (S), their interaction (S × FL) and week of measurements within a stage (W); results are least-square means.
‡See text for details.
A,B,C,DIndicate that values with different superscript letters within the same row and for different feeding level or stage are significantly different (P<0.05).
a,bIndicate that values with different superscript letters within the same row and for different feeding level or stage are significantly different (P<0.01).
Digestive and metabolic utilization of the diets
Digestibility coefficients for DM, organic matter, GE and CP were not significantly affected by FL and stage of fattening and averaged 96.1%, 96.8%, 96.0% and 93.7%, respectively (Table 2). Nevertheless, digestibility coefficient of crude fat tended to increase from 92.9% to 95.3% as animals got older (P = 0.08, Table 2). The metabolizability of DE was not affected by FL but was significantly higher during stage 1 (97.1%) than during stages 2 and 3 (94.5% on average for the two stages). N retention (as % digestible N) was not affected by FL but decreased from 70.5% to 51.9% as animals got older (P < 0.01). Glucose excreted in the urine increased with FL and stage and the interaction was significant. The increase in urinary glucose excretion between the lowest and the highest FL was the greatest during stage 3 (+62 g/day), intermediate during stage 2 (+38 g/day) and negligible during stage 1. Expressed as a percentage of DE intake, energy loss due to urinary glucose increased from 0.04% during stage 1 to 1.64% and 2.04% during stages 2 and 3, respectively. It also increased from 0.95% to 1.56% between the lowest and the highest FL.
Energy balance
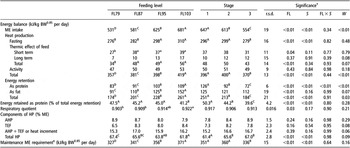
In agreement with the experimental design, ME intake (kJ/kg BW0.85 per day) increased by 28% between the lowest and the highest FL (P < 0.01, Table 3) and decreased from 647 to 554 kJ/kg BW0.85 per day between stages 1 and 3. Among the components of HP, FHP increased with FL from 276 to 310 kJ/kg BW0.85 per day but decreased between stages 1 and 3 (296 to 279 kJ/kg BW0.85 per day). Total TEF increased from 34 to 56 kJ/kg BW0.85 per day with increasing FL (P < 0.01). The TEFs also increased (P = 0.04) whereas TEFl was not affected. None of the TEF traits were affected by stage of fattening. The AHP averaged 50 kJ/kg BW0.85 per day and was not affected by FL, stage and their interaction. Expressed as a percentage of ME intake, AHP and TEF and their sum were not affected by FL and stage of fattening and averaged 8.4%, 7.8% and 16.1%, respectively. Total HP increased with increasing FL from 357 to 419 kJ/kg BW0.85 per day. The mean HP was lower during stage 3 (370 kJ/kg BW0.85 per day) than during stages 1 and 2 (398 kJ/kg BW0.85 per day on average). When expressed as a percentage of ME intake, HP decreased with increasing FL from 67.4% to 61.8% (P < 0.01) and significantly increased with stage of fattening from 61.4% to 67.0%.
Effects of feeding level and stage of fattening on components of energy balance in milk-fed calves (n = 48)

ME = metabolizable energy; HP = heat production; AHP = heat production due to physical activity; TEF = heat production due to feed intake.
†Values were tested for the effects of feeding level (FL), stage of fattening (S), their interaction (S × FL) and week of measurements within a stage (W); results are least-square means.
‡Calculated from measured fasting heat production (FHP) values and individual efficiencies of use of ME (as 100 – (TEF + AHP), expressed as % ME).
A,B,C,DIndicate that values with different superscript letters within the same row and for different feeding level or stage are significantly different (P<0.05).
a,bIndicate that values with different superscript letters within the same row and for different feeding level or stage are significantly different (P<0.01).
Energy stored as protein, as fat and total energy retention increased by 31%, 65% and 49%, respectively, between extreme FL. Energy retained as protein and total energy retention decreased as animals got older (or heavier) from 126 to 72 kJ/kg BW0.85 per day and from 251 to 184 kJ/kg BW0.85 per day, respectively, whereas energy retained as fat was not affected by stage of fattening. The fraction of energy, which was retained as protein, decreased (P < 0.01) as animals got older (50.3% to 39.6%) and when FL increased at each stage (P < 0.01). The respiratory quotient increased with increasing FL from 0.90 to 0.92 (P = 0.03) but was not affected by stage of fattening nor was there an interaction between FL and stage.
Protein, lipid and BW gain
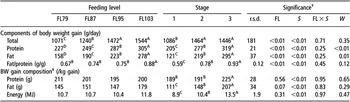
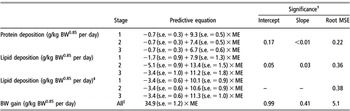
The BW gain increased significantly with increasing FL from 1071 to 1544 g/day and was higher during stages 2 and 3 than during stage 1 (1455 v. 1086 g/day, P < 0.01, Table 4). Furthermore, there was no interaction between ME intake and stage and the slope of the relationship between BW gain and ME intake equalled 34.9 g/MJ (Table 5).
Effects of feeding level and stage of fattening on BW, protein, fat and energy gain in milk-fed calves (n = 48)

†Values were tested for the effects of feeding level (FL), stage of fattening (S), their interaction (S × FL) and week of measurements within a stage (W), results are least-square means.
‡Calculated as the ratio between deposition and BW gain over 12 days.
A,B,C,DIndicate that values with different superscript letters within the same row and for different feeding level or stage are significantly different (P<0.05).
Predictive equations of protein and fat depositions and BW gain as functions of ME intake (MJ ME/kg BW0.85 per day)

ME = metabolizable energy; MSE = mean square error.
†Probability of significance of the effect of stage of fattening on intercept and slope of the linear relationship between dependent variable and ME intake (covariance model).
‡Fixing a single intercept for the three stages of fattening.
§Parameters of the relationship were estimated according to PROC NLIN of SAS (2004) with all data from the three stages.
The PD and LD increased with FL from 227 to 305 g/day and from 158 to 278 g/day, respectively. They also increased from 205 to 319 g/day and from 121 to 295 g/day as animals got older (Table 4). The ratio between LD and PD was higher for FL103 than for the other FL and increased from 0.59 to 0.93 g/day as animals got older (P < 0.01). Moreover, the response of PD and LD to ME intake differed between stages since the marginal PD decreased from 9.3 g/MJ during stage 1 to 6.7 g/MJ during stage 3 whereas marginal LD increased from 7.9 to 11.2 g/MJ ME (P = 0.03, Table 5). At zero ME intake, PD equaled −0.7 g/kg BW0.85 per day, whereas LD equaled −1.7, −5.1 and −3.4 g/kg BW0.85 per day during stages 1, 2 and 3, respectively. The intercept was affected by stage of fattening (P = 0.05). Ignoring this effect resulted in an overall intercept of −3.4 g/kg BW0.85 per day and a marginal LD equal to 10.1, 10.6 and 11.3 g/MJ ME during stages 1, 2 and 3, respectively.
The protein and fat content of BW gain increased as animals got older from 189 to 225 g/kg BW gain and 111 to 207 g/kg BW gain, respectively (Table 4). The latter values tended to be affected by FL whereas the former were not affected by FL. Energy content of BW gain increased from 8.9 to 13.5 MJ/kg BW gain as animals got older and was not affected by FL.
Energy requirements
As indicated in Table 3, HP varied with ME intake and BW. The following equation was obtained when the data were analyzed by regression (HP and ME expressed in kJ/day; values are estimates and asymptotic s.e. are given in parentheses):

The exponent for BW (0.89) did not differ from the exponent 0.85 proposed to express fasting energy expenditure in calves (Labussière et al., Reference Labussière, Dubois, van Milgen, Bertrand and Noblet2008a). Expressing data relative to BW0.85 resulted in the following equation:

From this equation, the efficiency of utilizing ME for growth is estimated as 63%. It was not affected by stage and the estimated FHP is 167 kJ/kg BW0.85 per day, that is an MEm of 265 kJ/kg BW0.85 per day.
It is commonly accepted that HP can be partitioned between HP due to maintenance, HP due to PD and HP due to LD, resulting in the following equation:

There was no effect of stage of fattening on the slopes of the equation. Equation (2) indicates that MEm was 299 kJ/kg BW0.85 per day and the efficiencies of utilizing ME for PD and LD were 65% and 76%, respectively.
Discussion
Effect of feeding level on nutrient utilization
The digestibility coefficients for DM, OM, GE, crude protein and crude fat (Table 2) were high and they were not affected by FL. They agree with values previously measured for similar diets (Roy et al., Reference Roy, Stobo, Gaston and Greatorex1970; Ternouth et al., Reference Ternouth, Stobo and Roy1985; Gerrits et al., Reference Gerrits, Tolman, Schrama, Tamminga, Bosch and Verstegen1996; Labussière et al., Reference Labussière, Dubois, van Milgen, Bertrand and Noblet2008b). The digestibility coefficient for crude fat tended to increase with age while the crude fat content of the diets were similar. The higher calcium level in the grower diet and the associated higher binding of biliary acids with calcium may contribute to the lower digestibility values for fat (Xu et al., Reference Xu, Wensing and Beynen1998).
The metabolizability of DE was lower during stages 2 and 3 than during stage 1. Values for stage 1 are in agreement with earlier reports (Diaz et al., Reference Diaz, Van Amburgh, Smith, Kelsey and Hutten2001) but are higher than more recent studies (Blome et al., Reference Blome, Drackley, McKeith, Hutjens and McCoy2003). Values for stages 2 and 3 are consistent with values measured by van den Borne et al. (Reference Van den Borne, Verstegen, Alferink, Giebels and Gerrits2006) in calves of similar BW. Methane production was negligible in our trial and should not be considered as a significant contributor to energy loss in veal calves fed with milk replacer only. However, N retention (as % digestible N) decreased as animals got older, indicating a greater urea excretion, in addition to an increase in urinary glucose excretion (Table 2). Both resulted in a greater energy loss in urine and therefore decreased the ME/DE. Similar observations were made by van den Borne et al. (Reference Van den Borne, Lobley, Blum and Gerrits2007a). This may be explained partly by the development of a lactose-induced insulin resistance (Hostettler-Allen et al., Reference Hostettler-Allen, Tappy and Blum1994) as calves get older, suggesting that the metabolic ability to use large amounts of glucose is limited. Veal calves are fed as monogastric animals for long periods of time. It is possible that, with age, there is a reduction in the metabolic potential to catabolize glucose while favoring the use of volatile fatty acids as energy substrate and for gluconeogenesis.
Results in Table 3 indicate that the fraction of total retained energy, which was stored as protein, decreased as animals got older. Additionally, marginal PD and LD were oppositely affected by ME intake as animals got older (Table 5), in agreement with previous results in pigs (Bikker et al., Reference Bikker, Verstegen and Campbell1996a) and in calves (Vermorel, Reference Vermorel1975). As shown in Table 5, the marginal response of PD to ME intake decreased from 9.3 to 6.7 g/MJ as animals got older (or heavier) whereas the marginal LD increased from 10.1 to 11.3 g/MJ. At a given stage, the relationship between PD and ME intake was linear despite the high dietary CP content and the high FL. This may indicate that a maximum PD was not reached and that PD was first limited by feed intake. Additionally, the ratios between digestible N and ME in the milk replacers (1.87 g/MJ for grower and 1.69 g/MJ for finisher diet) were close or higher to the requirements of veal calves (Labussière et al., Reference Labussière, Dubois, van Milgen, Bertrand and Noblet2008b). Consequently, the slopes for PD in Table 5 may not be biased by the animal potential for protein deposition or by insufficient protein allowance. According to their variation as animals got heavier, the slopes of the relationships between PD or LD (g/kg BW0.85 per day) and ME intake (MJ/kg BW0.85 per day) at each stage may then be considered as exponential functions of BW. The following equations were obtained:


From equation (3), marginal PD calculated using mean BW at each stage (9.4 and 6.8 g/MJ) are close to those presented in Table 5 for stages 1 and 3 but the one for stage 2 differs (8.0 v. 7.4 g/MJ). The marginal LD increased from 9.6 to 10.6 g/MJ as the calf got older (equation (4)), which is slightly lower than estimated from Table 5. Nevertheless, the root mean square error (MSE) was similar between both calculations.
The response of BW gain to ME intake equaled 34.9 g/MJ (Table 5). Similar values are not available in the literature for veal calves but the estimate is close to values measured in pigs (36 g/MJ, Quiniou et al., Reference Quiniou, Dourmad and Noblet1996; 35 g/MJ ME, Bikker et al., Reference Bikker, Verstegen, Kemp and Bosch1996b). Additionally, average BW gain values at the highest FL for stages 2 and 3 increased up to 1.8 kg/day, which is consistent with results of van den Borne et al. (Reference Van den Borne, Verstegen, Alferink, Giebels and Gerrits2006) for similar ME intake.
As a consequence from responses of PD, LD and BW gain to FL, the protein content of BW gain was not affected by FL but differed between stages 1 and 2 (190 g/kg BW gain on average) and stage 3 (225 g/kg BW gain, Table 4). Values for the first stages are in agreement with previous results (Donnelly and Hutton, Reference Donnelly and Hutton1976; Diaz et al., Reference Diaz, Van Amburgh, Smith, Kelsey and Hutten2001) with calves receiving high quantities of protein in their diets and they are also close to the value used by the NRC (187 g/kg BW gain, NRC, 2001). However, the protein content of BW gain for the oldest calves is higher than that measured by Meulenbroeks et al. (Reference Meulenbroeks, Verstegen, Van Der Hel, Korver and Kleinhout1986) or values measured previously in our group (Labussière et al., Reference Labussière, Dubois, van Milgen, Bertrand and Noblet2008b), although they are consistent with results of Vermorel et al. (Reference Vermorel, Bouvier, Thivend and Toullec1974). As lipid content also increases as animals get older (Vermorel et al., Reference Vermorel, Bouvier, Thivend and Toullec1974, Table 5), this indicates that the water content of BW gain would decrease as calves get older (Robelin, Reference Robelin1986). However, one should keep in mind that although the estimates of PD and LD were reasonably accurate, this is less the case for BW gain.
Estimation of energy requirements of veal calves
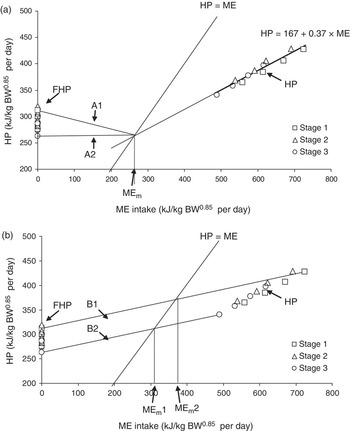
The classical analyses for determining energy requirements of growing animals are mainly based on the linear regression between HP and ME intake (equations (1a) and (1b), Figure 2a), or one of its derivatives. In this approach, data (expressed relative to BW0.75) from energy balance measurements performed in calves receiving different levels of ME intake are regressed together with a common and unique intercept. In other words, MEm is considered to be independent of ME intake and to be affected by BW only. In the present experiment, we have observed (equation (1a)) that the 0.85 exponent was more suitable for expressing basal metabolic rate (Labussière et al., Reference Labussière, Dubois, van Milgen, Bertrand and Noblet2008a). Even though a different exponent was used, BW alone may not be sufficient to describe variation in MEm. In our study, FHP was estimated as the activity-free extrapolated plateau of HP from a modeling approach performed during the fasting day (van Milgen et al., Reference Van Milgen, Noblet, Dubois and Bernier1997). However, FHP increased when previous FL increased, in agreement with Koong et al. (Reference Koong, Nienaber, Pekas and Yen1982) and de Lange et al. (Reference De Lange, van Milgen, Noblet, Dubois and Birkett2006). Additionally, the measured FHP values were largely higher than the estimated value from equations (1a) and (1b), suggesting that the extrapolation to zero ME intake of such relationships is not adequate for estimating accurately FHP and MEm. If FHP is considered as an indicator of MEm, results of our study suggest that animals adapt their maintenance metabolism to FL. Consequently, MEm would depend on FL or ME intake, which is in agreement with previous results in veal calves from Vermorel et al. (Reference Vermorel, Bouvier and Geay1979) and Aurousseau et al. (Reference Aurousseau, Vermorel and Bouvier1983).
Effect of metabolizable energy (ME) intake (kJ/kg BW0.85 per day) on heat production (HP, kJ/kg BW0.85 per day) in milk-fed calves: comparison between traditional (panel A) and alternative (panel B) methods for estimating the maintenance energy requirement (MEm) and the efficiency of energy utilization. A: The equation HP = 167 (s.e. = 19) + 0.37 (s.e. = 0.03) × ME ([equation (2b)], n = 48, root mean square error (MSE) = 16 kJ/kg BW0.85 per day) is obtained from individual data measured in the fed state; its extrapolation to HP = ME provides the traditional estimate of MEm (265 kJ/kg BW0.85 per day). Efficiency of utilizing ME for growth (k g) is equivalent to the complement of the slope of equation (2b) (i.e., 63%) and efficiency of utilizing ME for maintenance (k m) is equivalent to the complement of the slopes of lines A1 and A2. A1 and A2 represent the relationship between HP and ME at the highest (FL103, stage 1) and the lowest (FL79, stage 3) ME intakes. B: Lines B1 and B2 (average slope: 0.161 (s.e. = 0.005)) originate from the relationship between HP at zero ME intake (i.e., FHP) and HP at the amount of ME intake by each calf. They were analyzed as a covariance analysis with FL and stage as fixed effects and ME intake as covariate; the slope is not affected by FL and stage. The complement to the slope corresponds to the efficiency of utilizing ME for maintenance and growth (k mg). The intercept (fasting heat production (FHP)) depends on both stage and FL; B1 and B2 represent the relationship between HP and ME at the highest (FL103, stage 1) and the lowest (FL79, stage 3) ME intakes. MEm1 and MEm2 values correspond to the ME intake equal to HP. Points (two batches of 12) are means per FL and per stage for FHP and HP.

An alternative approach for estimating MEm is presented in Figure 2b. Rather than comparing HP in the fed state of veal calves with different ME intake to each other, HP in the fed state of each calf is compared to the corresponding measured FHP value (lines B1 and B2). The slopes of lines B1 and B2 can therefore be considered as an overall inefficiency (energy loss = 16.1%) of utilizing ME for maintenance and growth (k mg). This value is equivalent to the ratio between the sum of AHP and TEF, and ME intake (Table 3). Therefore, k mg equaled 83.9%, and this value did not depend on FL or stage of fattening. Consequently, the associated MEm (equaling FHP/k mg, from lines B1 or B2) increased from 327 to 371 kJ/kg BW0.85 per day between the lowest and the highest FL (Table 3, P < 0.01), indicating that calves truly adapt their maintenance metabolism to different FL. Regression analysis of the calculated MEm values relative to ME intake indicates that the relation was not affected by stage of growth and the following equation was obtained:

Expressed relative to BW0.75, average values of MEm would correspond to 570 and 589 kJ/kg BW0.75 per day for a 100 and 200 kg BW calf fed at 650 and 600 kJ ME/kg BW0.85 per day, respectively. These values are higher than those previously estimated from the regression methods in our study (265 kJ/kg BW0.85 per day: equations (1a) and (1b), or 299 kJ/kg BW0.85 per day: equation (2)), in previous studies (460 kJ/kg BW0.75 per day: Kirchgessner et al., Reference Kirchgessner, Müller and Neesse1976; from 414 to 473 kJ/kg BW0.75 per day: Vermorel et al., Reference Vermorel, Bouvier and Geay1979; from 394 to 452 kJ/kg BW0.75 per day: Gerrits et al., Reference Gerrits, Tolman, Schrama, Tamminga, Bosch and Verstegen1996) or from previous recommendations (418 kJ/kg BW0.75 per day: Toullec, Reference Toullec1989; NRC, 2001).
Using the estimate of MEm for each calf, equation (2) can now be reconsidered by expressing the HP not related to maintenance in order to estimate the marginal efficiencies for PD and LD and the following equation was obtained:
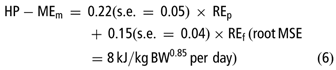
From this equation, the marginal efficiencies of utilizing ME for PD and LD were 82% and 87%, respectively. As MEm, they are higher than the values estimated from equation (2) (65% and 76%, respectively) or in previous studies (54% and 79%: Holmes and Davey, Reference Holmes and Davey1976; 49% and 85%: Kirchgessner et al., Reference Kirchgessner, Müller and Neesse1976), especially for protein deposition. Additionally, the increase in ME intake was associated with combined increases of PD and LD (Pearson correlation coefficient: 0.49, P < 0.01) and the latter is prejudicial to the correct estimation of partial efficiencies. Hence, one should consider that veal calves receiving great amounts of dietary lipids may deposit directly their dietary fat (van den Borne et al., Reference Van den Borne, Lobley, Verstegen, Muijlaert, Alferink and Gerrits2007b) with a greater efficiency. The increase in partial efficiency of utilizing ME for LD would therefore decrease the partial efficiency of utilizing ME for PD.
Conclusions
In our trial, calves were fed liquid rations and high quantities of nutrients were absorbed in a short period of time. Increasing FL was associated with increasing amounts of glucose excreted in urine, especially in heavy calves, indicating that the maximum ability of utilizing glucose may be reached after the meal. Nutritional solutions, such as use of solid feeds or differently hydrolyzed starch, should be developed to attenuate this energy loss. Responses of PD and LD to ME intake depend on BW or age of the calves and they were described by exponential functions. In addition, the energy balances and FHP measurements carried out in our study allow proposing a new method for evaluating energy requirements which considers MEm as dependent on ME intake.
Acknowledgments
This experiment was part of a research project conducted jointly by INRA and Institut de l’Elevage and was financed by the French regions of Bretagne and Pays de la Loire, and the French veal calf production organizations Interveaux and SDVF. The authors would also like to thank A. Chauvin, O. Glais, B. Janson, R. Leborgne, F. Le Gouevec, V. Piedvache and J.-F. Rouaud for animal care, R. Delaunay, B. Fontaine and D. Guillard for transport of the animals and Y. Jaguelin and A. Pasquier for laboratory analyses. The authors also thank M. Vermorel for the review of the manuscript and the interest he has devoted to the project.