Introduction
The crystal structure of a material plays a fundamental role in determining its properties.[Reference Bragg1,Reference Van De Walle2] This is best exemplified by carbon allotropes[Reference Pierson3]—diamond is extremely hard and electrically insulating, whereas graphite is soft and semi-metallic. Even minor structural modifications can have a profound effect on a broad array of properties, ranging from ferroelectricity and piezoelectricity (e.g., phase-dependent ferroelectricity in BaTiO3)[Reference von Hippel4] to conductivity (e.g., metal to insulator Peierls distortions)[Reference Burdett and Lee5] and photocatalytic activity (e.g., observed only in Rutile rather than Anatase TiO2).[Reference Scanlon, Dunnill, Buckeridge, Shevlin, Logsdail, Woodley, Catlow, Powell, Palgrave, Watson, Keal, Sherwood, Walsh and Sokol6] Accordingly, our ability to describe and understand such structural features is of crucial importance when characterizing new and existing materials.[Reference Zunger7]
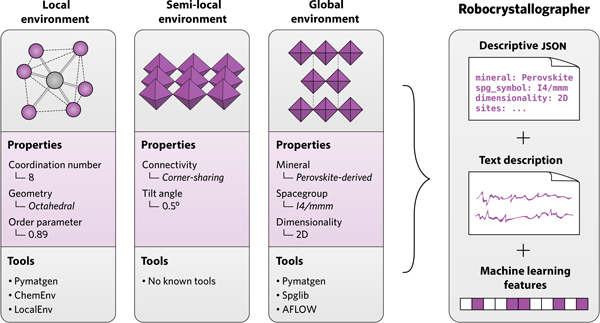
There now exists an increasing number of packages for programmatically analyzing crystal structures. These mainly fall into two categories. The first provides information on the global structure, such as the dimensionality,[Reference Gorai, Toberer and Stevanović8–Reference Ashton, Paul, Sinnott and Hennig11] the symmetry information,[Reference Togo and Tanaka12] and whether the structure matches a known mineral prototype.[Reference Mehl, Hicks, Toher, Levy, Hanson, Hart and Curtarolo13] The second analyzes local coordination environments and site geometries (e.g., the recent ChemEnv[Reference Waroquiers, Gonze, Rignanese, Welker-Nieuwoudt, Rosowski, Göbel, Schenk, Degelmann, André, Glaum and Hautier14] and LocalEnv[Reference Zimmermann, Horton, Jain and Haranczyk15] packages). Currently, however, there are not yet tools for describing semi-local structure, i.e., how the local geometry connects throughout space to form the overall structure (Fig. 1). Furthermore, to our knowledge, no package provides human-readable descriptions of crystal structure resembling that found in a journal article.
A crystal structure can be broken down into the local environment (e.g., site coordination number and geometry), the semi-local environment detailing how the sites connect throughout space (e.g., polyhedral connectivity and tilt angles), and the global environment (e.g., mineral type and symmetry information). Robocrystallographer analyzes each of these components and compiles the information into machine-readable (JSON), human-readable (text), and machine learning formats.

In this paper, we introduce robocrystallographer, an open-source toolkit for analyzing crystal structures. We illustrate how robocrystallographer can extract local, semi-local, and global structure features, and use these to generate human-readable text descriptions and machine learning features. Next, we showcase the code on several example structures and use it to investigate the dimensionally of all materials in the Materials Project database. Lastly, we demonstrate how robocrystallographer can be used in statistical machine learning models to improve the accuracy of predictions of elastic properties.
Overview and code design
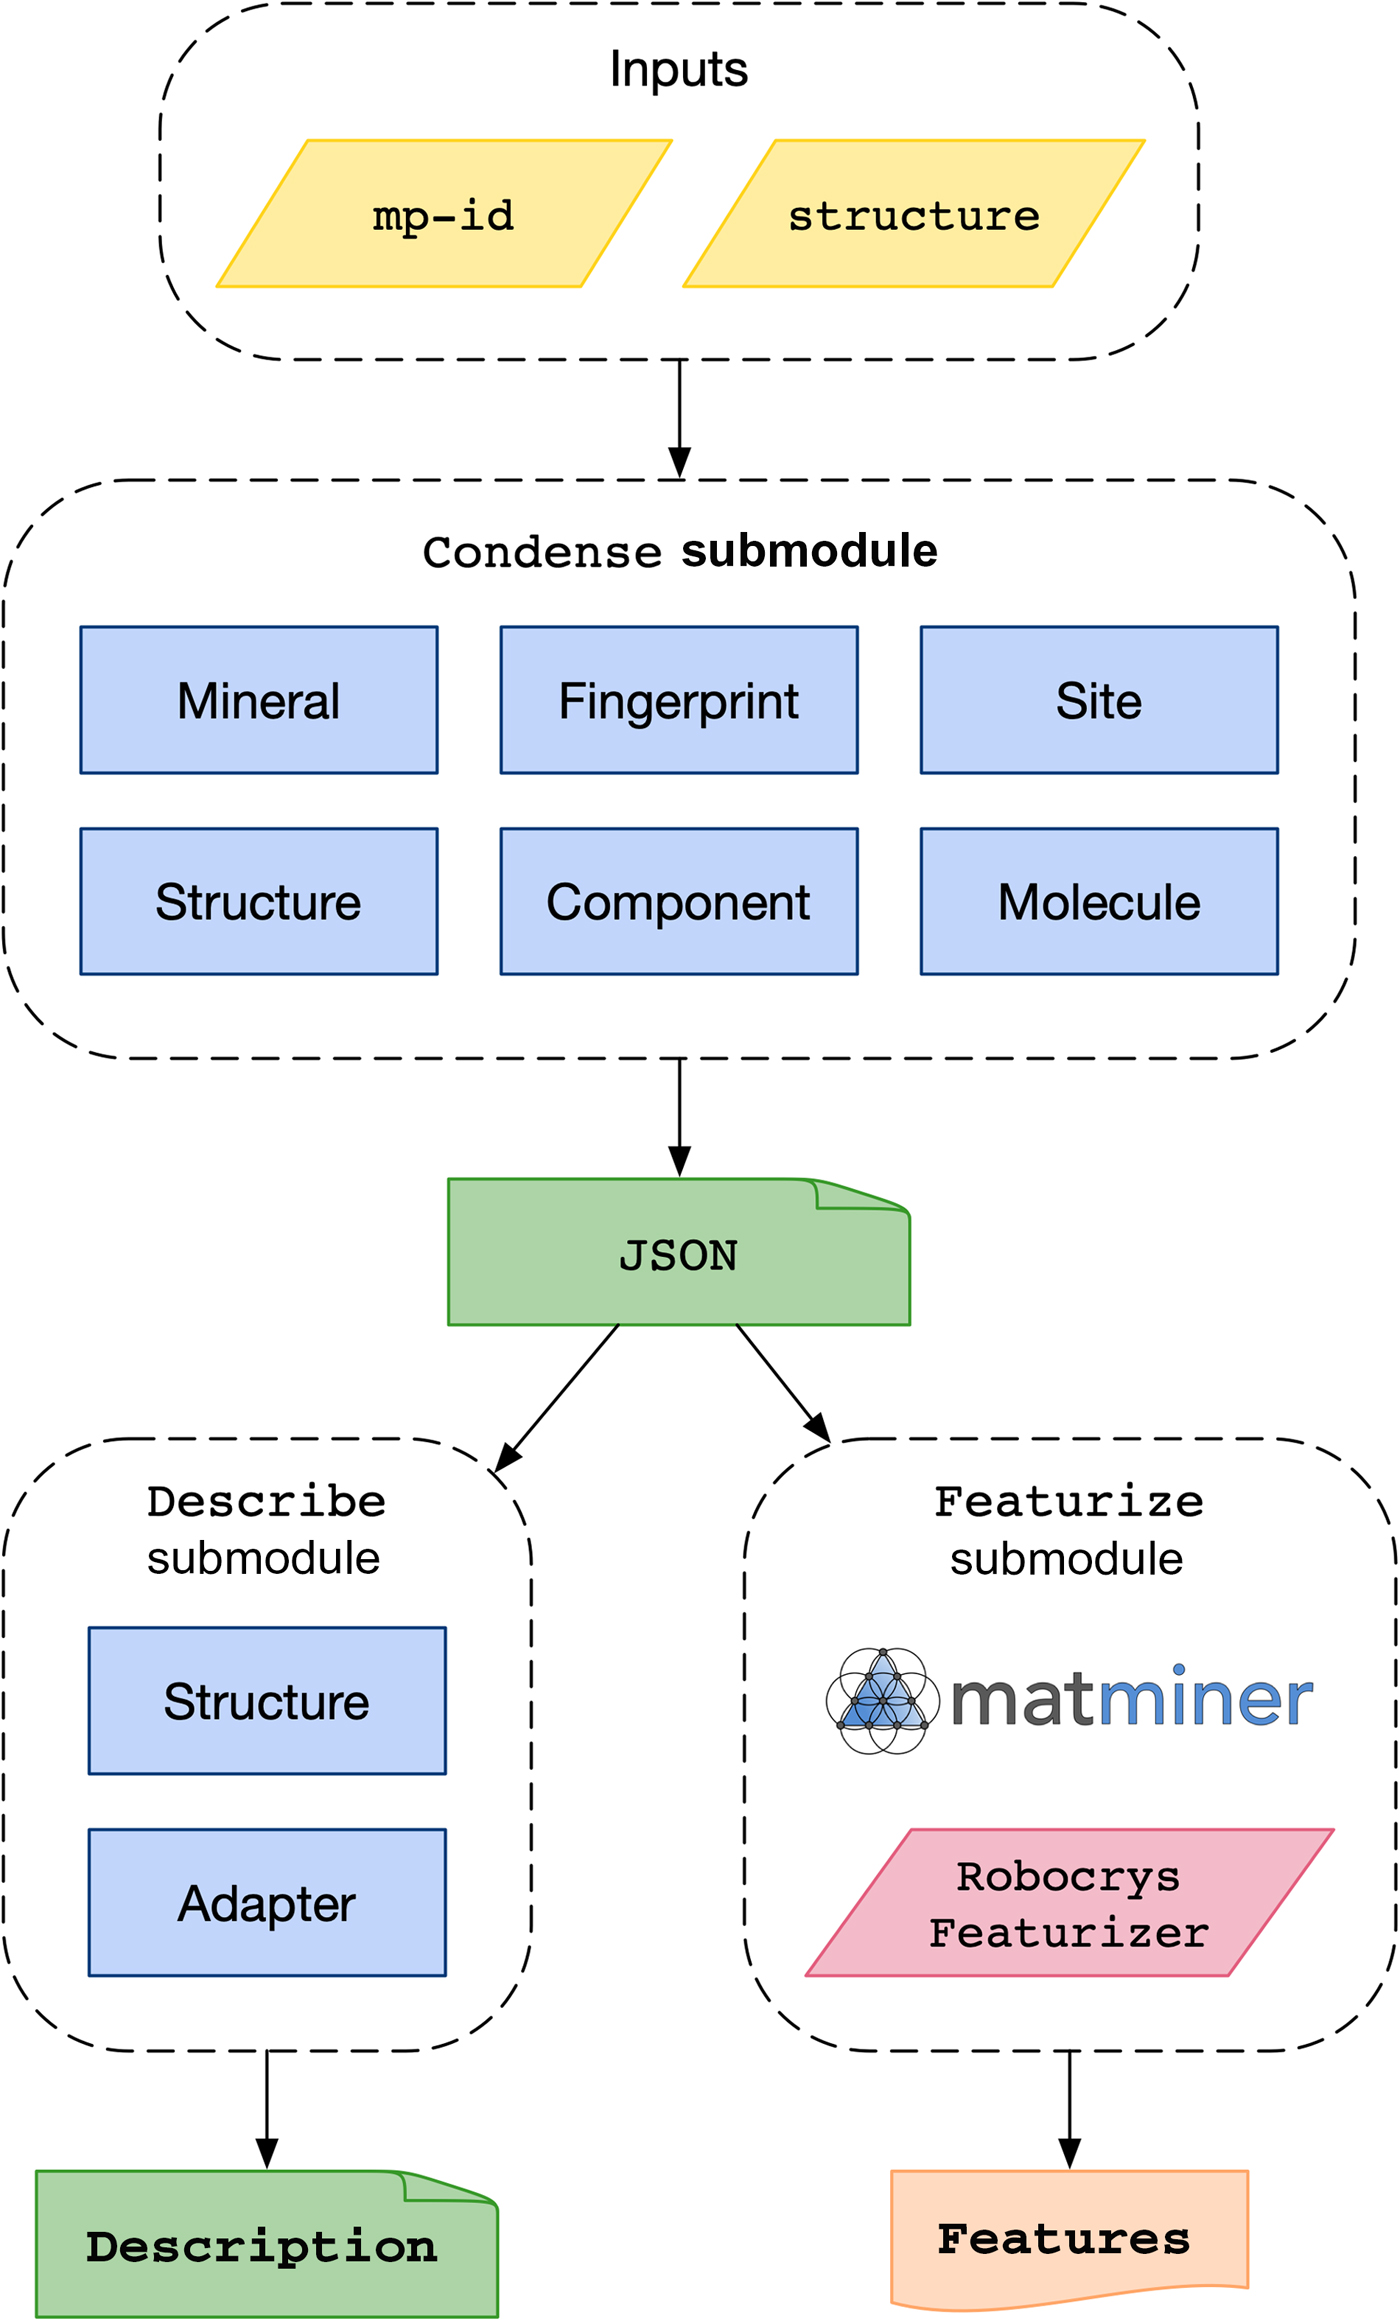
Robocrystallographer follows a modular design, with individual sub-packages for different types of analysis. In this way, individual components may be used as standalone tools. Robocrystallographer builds upon the many open-source tools that already exist for analyzing crystal structures, including pymatgen[Reference Ong, Richards, Hautier, Kocher, Cholia, Gunter, Chevrier, Persson and Ceder16] for manipulating structure objects and local environment analysis, spglib[Reference Togo and Tanaka12] for symmetry analysis, matminer[Reference Ward, Dunn, Fahaninia, Zimmermann, Bajaj, Wang, Montoya, Chen, Bystrom, Dylla, Chard, Asta, Persson, Snyder, Foster and Jain17] for structure fingerprinting, the AFLOW[Reference Mehl, Hicks, Toher, Levy, Hanson, Hart and Curtarolo13] prototype library for framework analysis, OpenBabel[Reference O'Boyle, Banck, James, Morley, Vandermeersch and Hutchison18] for processing molecular structures, and PubChemPy[Reference Swain19] for interfacing with the PubChem website.[Reference Kim, Thiessen, Bolton, Chen, Fu, Gindulyte, Han, He, He, Shoemaker and Wang20] The three primary functions of the code (Fig. 1) are: (i) to condense a crystal structure into a descriptive, machine-readable Javascript Object Notation (JSON) representation containing the structure features; (ii) to generate a human-readable text description of the structure from the JSON format; and (iii) to extract a set of machine learning features from the descriptive JSON. We briefly outline how these functions are achieved in robocrystallographer.
Generating the descriptive JSON
The conversion from crystal structure to descriptive JSON is handled within the Condense submodule of robocrystallographer (Fig. 2). The first step is to assign oxidation states to all sites in the structure. These are used for descriptive purposes and to increase accuracy when determining the structural bonding. The oxidation states are assigned based on (i) achieving charge balance and (ii) using oxidation states most consistent with statistics of oxidation states found in the International Crystal Structure Database. While this method performs well for most structures, it can fail when unusual oxidation states are present (e.g., peroxides and persulfides) and in cases of disproportionation (e.g., Pb2+ and Pb4+ in Pb3O4—in which an averaged oxidation state of 2.67+ is assigned to all Pb sites).
Schematic of the robocrystallographer program indicating code components within the core submodules (Condense, Describe, and Featurize) and program flow. The robocrystallographer machine learning featurizer extends the matminer code.[Reference Ward, Dunn, Fahaninia, Zimmermann, Bajaj, Wang, Montoya, Chen, Bystrom, Dylla, Chard, Asta, Persson, Snyder, Foster and Jain17]

Next, global structure properties are evaluated including the symmetry information (e.g., space group using the spglib[Reference Togo and Tanaka12] library) and whether the structure matches any known mineral prototypes. Mineral matching is first attempted using the AFLOW structure library prototype matcher available in pymatgen.[Reference Mehl, Hicks, Toher, Levy, Hanson, Hart and Curtarolo13,Reference Ong, Richards, Hautier, Kocher, Cholia, Gunter, Chevrier, Persson and Ceder16] This algorithm relies on StructureMatcher, an affine mapping technique with tunable tolerances. Matches are determined by first aligning the crystal lattices (considering different settings and unit cells) and then computing atomic distances. Robocrystallographer has the option to simplify zero-dimensional (0D) clusters of sites to a single site, allowing for the correct identification of prototypes containing organic molecules such as the mixed organic–inorganic hybrid perovskites (see sections on dimensionality analysis and molecule analysis in Supplementary Material). If no match is found, “fuzzy” matching will be performed using the geometric structure fingerprint calculated using matminer.[Reference Ward, Dunn, Fahaninia, Zimmermann, Bajaj, Wang, Montoya, Chen, Bystrom, Dylla, Chard, Asta, Persson, Snyder, Foster and Jain17] The structure fingerprint (SiteStatsFingerprint in matminer) encodes information about the different types of local environments (e.g., “tetrahedral”) present in a crystal structure. We describe structures that do not directly match a prototype but possess a small Euclidean fingerprint distance to that prototype, as being similar to or “like” that structure (e.g., “perovskite-like”). Furthermore, if a structure matches a known prototype but contains a different number of atomic elements, the structure is described as “derived” from that structure (e.g., “perovskite-derived”). Additional details on the fuzzy matching algorithm are provided in Supplementary Material.
Next, the structural bonding is determined using one of the nearest-neighbor routines provided by pymatgen.[21] It is essential that bonding is assigned correctly due to its importance throughout all subsequent analysis steps. Robocrystallographer defaults to using the CrystalNN bonding algorithm, which, in our testing, produced the most reasonable bonding interpretation for a wide array of systems. Details of this approach can be found in the pymatgen documentation[21] and will be the subject of a future work. In essence, CrystalNN uses Voronoi decomposition[Reference Voronoi22] and solid angle weights to determine the probability of various coordination environments and selects the one with highest probability.
We next identify the bonded components (all sets of sites that are connected by bonds) that comprise the structure using the StructureGraph module in pymatgen.[Reference Ong, Richards, Hautier, Kocher, Cholia, Gunter, Chevrier, Persson and Ceder16] For each structure component, we identify its dimensionality using the modified breadth-first search approach detailed by Larsen et al.[Reference Larsen, Pandey, Strange and Jacobsen9] and as implemented in pymatgen. While this method is, in principle, exact, the performance depends on the accuracy of the assigned bonding. A comparison between different bonding algorithms and their effect on dimensionality for 40 reference structures is provided in Supplementary Material. If the component is one- or two-dimensional (1D or 2D), its orientation is determined using singular value decomposition. By describing the dimensionalities of individual components, we obtain a much deeper understanding of the material geometry than available from pre-existing tools. When a single structure contains multiple components with different dimensionalities (e.g., 1D chains within a three-dimensional (3D) framework), we take the largest dimensionality of all components as the dimensionality of the overall structure. Lastly, if the cell contains two or more 2D components with the same Miller index and different compositions, the structure is labeled as a van der Waals heterostructure and the minimum repeating sequence of the components is identified.
Any 0D components are compared against the PubChem database to determine if they match known molecules. As mentioned previously, such components can be reduced to a single site for prototype identification. Thus, hybrid systems in which molecules are embedded in a crystal (such as the hybrid metal-organic halide systems) are correctly identified as being perovskite, and in many cases, the molecular component can be explicitly matched with a known molecule (see Supplementary Material for such an example).
Having covered the more global aspects of structure, we next analyze the local and semi-local structure. Using spglib[Reference Togo and Tanaka12] and pymatgen,[Reference Ong, Richards, Hautier, Kocher, Cholia, Gunter, Chevrier, Persson and Ceder16] we identify the inequivalent components and, within each component, the symmetrically inequivalent atoms. The LocalEnv module of pymatgen is used to determine the site geometry and obtain information on the nearest and next-nearest neighbors. This module uses specially designed order parameters[Reference Zimmermann, Horton, Jain and Haranczyk15] to match the geometry of a near-neighbor configuration to known patterns such as “octahedral,” “tetrahedral,” and “square planar” (as of this writing, 24 distinct motifs are available). These order parameters can detect and report distortions from perfect motifs in a continuous manner. We note that the ChemEnv[Reference Waroquiers, Gonze, Rignanese, Welker-Nieuwoudt, Rosowski, Göbel, Schenk, Degelmann, André, Glaum and Hautier14] package is also available for this purpose; we use the order parameter technique for speed as well as compatibility with custom near-neighbor algorithms. To assess the connectivity between a site and its next-nearest neighbor(s) (i.e., polyhedral connectivity), we determine the number of nearest neighbors shared between the two sites. If the two sites share one, two, or more nearest neighbors, the connectivity is determined as corner-, edge-, and face-sharing, respectively. The corner-sharing octahedral tilt angles (θ tilt) are calculated as follows:

where X oct and Z oct are two octahedral sites, and Y NN is a shared nearest-neighbor site.
Most materials chemistry packages represent chemical formulae in a reduced form based on the overall composition of the system, with the elements ordered by their electronegativities. This method specifically ignores the connectivity of sites within the structure. This is useful when the structural properties of a compound are not known but result in confusing or unrecognizable formulae for some materials, for example “Li(N3)(H2O)” is reduced to “LiH2N3O.” In robocrystallographer, the formulae of the individual bonded components are used to reconstruct the overall chemical formula, allowing for more understandable formulae that more faithfully describe the structural bonding.
Together, the full analysis is compiled into a descriptive JSON representation, containing keys for each property including the mineral, formula, space group information, and dimensionality. A summary of this process along with some example JSON data is provided in Supplementary Material. The conversion of the descriptive JSON to human-readable text description and machine learnable features is handled within the Describe and Featurize submodules of robocrystallographer, respectively (Fig. 2). More details of these procedures are provided in Supplementary Material.
General information and usage modes
Robocrystallographer is compatible with Python 3.6+. The application programming interface (API) is modular and fully documented, with 60 unit-tests covering the entire codebase. A schematic indicating how the components interact is provided in Fig. 2. The code is released under a modified BSD license and is available open source at https://github.com/hackingmaterials/robocrystallographer. Robocrystallographer can be used from either the command line or via the Python API with the full details provided in the package documentation. The time needed to generate structural descriptions is discussed in Supplementary Material; a rough estimate is 0.22 s per site in the structure (e.g., 4–5 s for a structure with 20 sites).
Results
Crystal structure descriptions
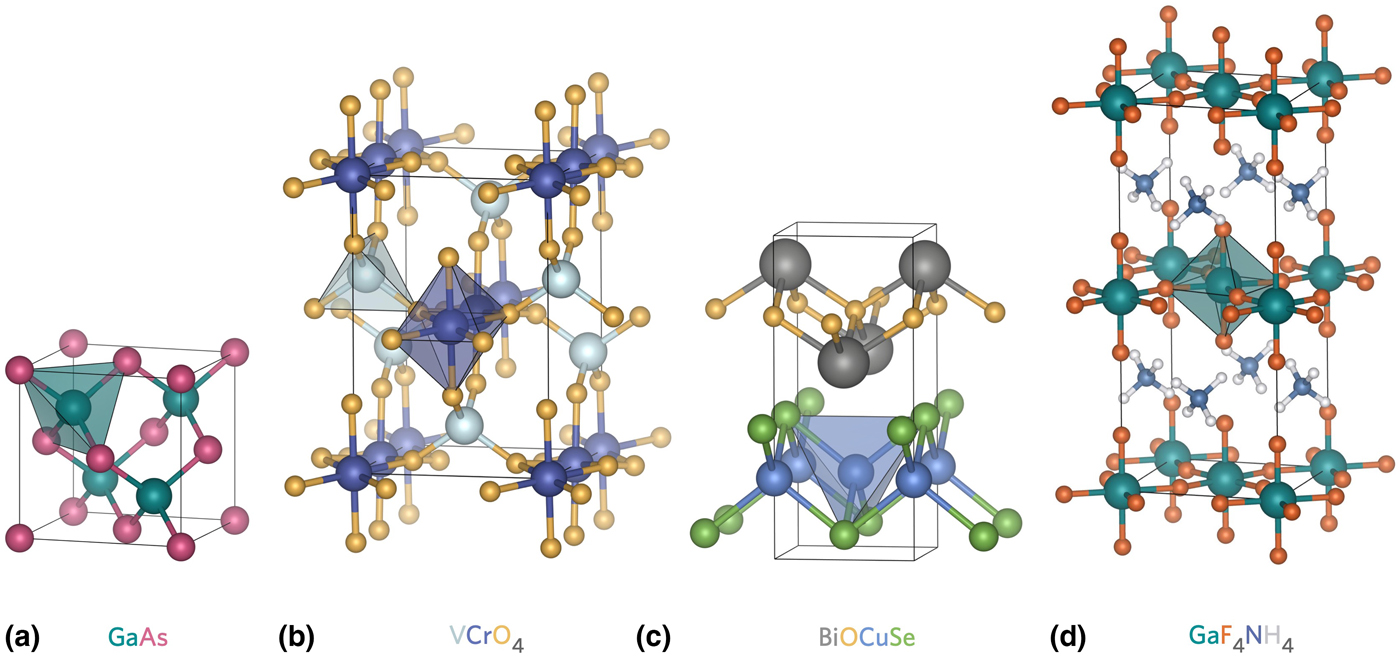
To highlight the functionality of robocrystallographer, we have generated automated text descriptions (using the Describe module of robocrystallographer) for several crystal structures of varying complexity. In this section, we reproduce verbatim these descriptions, albeit with slight typesetting adjustments. Note that in each case, oxidation states are inferred automatically using the routines available in pymatgen. In the simplest case, the output of robocrystallographer on GaAs[Reference Giesecke and Pfister23] (Fig. 3(a)) is: “GaAs is zincblende structured and crystallizes in the cubic F $\bar{4}$ 3m space group. Ga3+ is bonded to four equivalent As3– atoms to form corner-sharing GaAs4 tetrahedra. All Ga–As bond lengths are 2.49 Å. As3– is bonded in a tetrahedral geometry to four equivalent Ga3+ atoms.” Despite the simple structure, this description demonstrates many of the core features of robocrystallographer. The mineral prototype is matched correctly, as is the space group information. The geometry of each site is determined and the presence of corner-sharing tetrahedra is identified. Lastly, the code keeps track of which bond lengths have been described such that each length is described only once. Overall, the description is clearly understandable and resembles a human description of the structure. We note that this description, as well as the ones to follow, involved no human intervention; the only information provided to robocrystallographer was the structural information (i.e., lattice parameters and site positions) of GaAs.
Crystal structures of (a) GaAs, (b) VCrO4, (c) BiOCuSe, and (d) GaF4NH4. Only cation polyhedral are drawn.

For more complex structures with multiple inequivalent sites and a mixture of site connectivities (corner, edge, or face-sharing), the output is longer but remains readable. To increase clarity, we can display the symmetry labels for each site. For example, for CrVO4[Reference Frazer and Brown24] (Fig. 3(b)), the output is as follows: “CrVO4 crystallizes in the orthorhombic Cmcm space group. V(1)5+ is bonded to two equivalent O(1)2– and two equivalent O(2)2– atoms to form VO4 tetrahedra that share corners with six equivalent Cr(1)O6 octahedra. The corner-sharing octahedra tilt angles range from 47–54°. Both V(1)–O(1) bond lengths are 1.82 Å. Both V(1)–O(2) bond lengths are 1.69 Å. Cr(1)3+ is bonded to two equivalent O(2)2– and four equivalent O(1)2– atoms to form CrO6 octahedra that share corners with six equivalent V(1)O4 tetrahedra and edges with two equivalent Cr(1)O6 octahedra. Both Cr(1)–O(2) bond lengths are 1.99 Å. All Cr(1)–O(1) bond lengths are 2.04 Å. There are two inequivalent O2– sites. O(1)2– is bonded in a distorted trigonal planar geometry to one V(1)5+ and two equivalent Cr(1)3+ atoms. O(2)2– is bonded in a distorted bent 120 degrees geometry to one V(1)5+ and one Cr(1)3+ atom.”
Support for low dimensionality structures can be observed in the description for BiOCuSe[Reference Kholodkovskaya, Akselrud, Kusainova, Dolgikh and Popovkin25] (Fig. 3(c)): “BiOCuSe is parent of FeAs superconductors structured and crystallizes in the tetragonal P4/nmm space group. The structure is two-dimensional and consists of one BiO sheet oriented in the (0, 0, 1) direction and one CuSe sheet oriented in the (0, 0, 1) direction. In the BiO sheet, Bi3+ is bonded in a 4-coordinate geometry to four equivalent O2– atoms. All Bi–O bond lengths are 2.35 Å. O2– is bonded in a tetrahedral geometry to four equivalent Bi3+ atoms. In the CuSe sheet, Cu1+ is bonded to four equivalent Se2– atoms to form a mixture of edge and corner-sharing CuSe4 tetrahedra. All Cu–Se bond lengths are 2.52 Å. Se2– is bonded in a 4-coordinate geometry to four equivalent Cu1+ atoms.” Here, robocrystallographer identifies the two separate structure components and reports their dimensionality and orientation. The use of components is further reflected in the chemical formula. Namely, if the elements were solely ordered by their electronegativity, the formula would instead be reported as “CuBiSeO.” By describing each component separately, the description becomes more readable and easier to understand in terms of structural components. We note, however, that such ordering preferences may depend on the type of analysis being performed (this particular structure is usually called “BiCuSeO” in the literature).
Robocrystallographer can process structures with mixed dimensionalities, with 0D structures matched against the PubChem database.[Reference Kim, Thiessen, Bolton, Chen, Fu, Gindulyte, Han, He, He, Shoemaker and Wang20] This is exemplified by the description for GaF4NH4[Reference Roos and Meyer26] (Fig. 3(d)): “GaF4NH4 crystallizes in the tetragonal I4/mcm space group. The structure is two-dimensional and consists of two ammonium molecules and one GaF4 sheet oriented in the (0, 0, 1) direction. In the GaF4 sheet, Ga3+ is bonded to six F1– atoms to form corner-sharing GaF6 octahedra. The corner-sharing octahedral tilt angles are 27°. There are two shorter (1.87 Å) and four longer (1.95 Å) Ga–F bond lengths. There are two inequivalent F1– sites. In the first F1– site, F1– is bonded in a bent 150° geometry to two equivalent Ga3+ atoms. In the second F1– site, F1– is bonded in a single-bond geometry to one Ga3+ atom.” We have thus demonstrated that the notable aspects of a diverse set of structures can be captured automatically and reported to a user in a highly readable manner by robocrystallographer.
Statistical analysis of structure dimensionalities
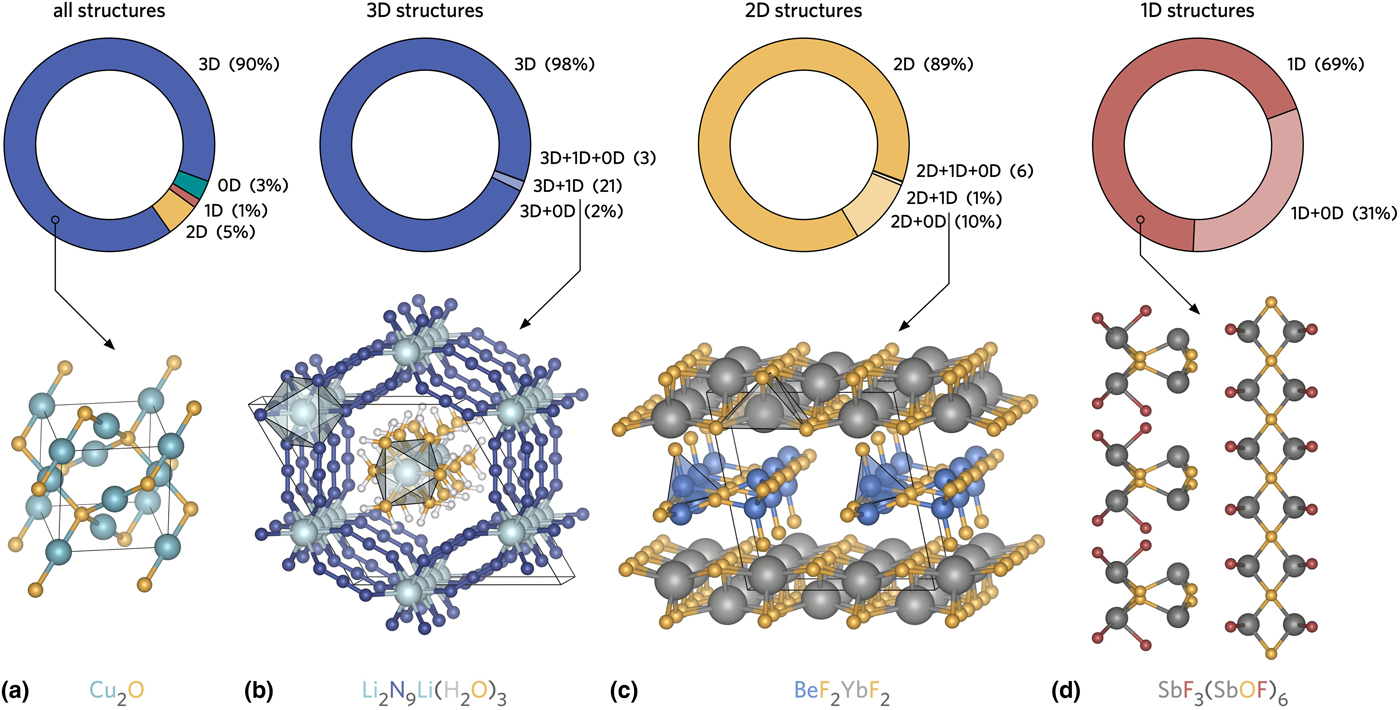
We have employed the component-based dimensionality finding routines implemented in robocrystallographer to investigate the statistics of structure dimensionalities in the Materials Project database[Reference Jain, Ong, Hautier, Chen, Richards, Dacek, Cholia, Gunter, Skinner and Ceder27] (Fig. 4). At the time of writing, this database comprises 133,688 crystal structures which we filter to remove very unstable entries—those with an energy above the hull of >500 meV/atom—providing 114,300 final materials. We ran robocrystallographer on these structures and used the JSON representation to analyze and search through the database. We note that, while the dimensionality finding algorithm is exact for a given bonded structure, limitations in determining the crystal bonding mean that the results presented here will only provide a qualitative guide to the true dimensionality statistics. An assessment of different bonding schemes and their impact on dimensionality is provided in Supplementary Material. In general, the bonding scheme used in this work (CrystalNN) tends to slightly overestimate the bonding, leading to an artificial increase in the number of 3D structures (see Supplementary Material).
Statistics of structure dimensionalities in the Materials Project database and example crystal structures. For clarity, only a portion of the SbF3(SbOF)6 crystal structure is displayed.
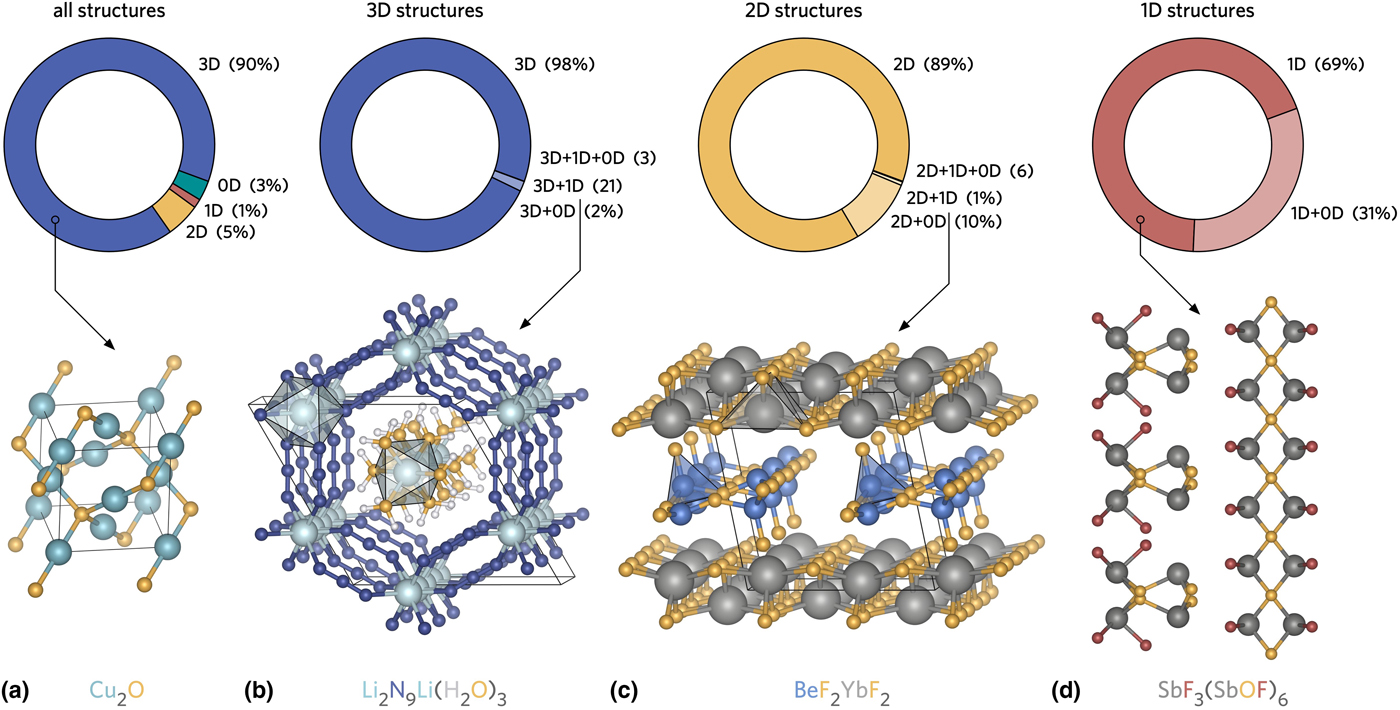
We find that the vast majority of compounds in the Materials Project (90%) are 3D. 2D, 1D, and 0D structures comprise 5%, 1%, and 3% of the database, respectively. The component-based analysis allows for an enhanced understanding of structure dimensionalities. For example, by filtering the structures for those containing more than one 3D component, we can easily identify interpenetrated structures such as Cu2O (Fig. 4(a)), with additional perspectives provided in Supplementary Material.
The component analysis can also be used to investigate the statistics of mixed dimensionality structures. As the overall dimensionality of a structure is determined by the largest component dimensionality, an n-dimensional structure can also include components of lower dimensionality. The breakdown for each set of structure dimensionalities is displayed in Fig. 4. For 3D structures, the majority contain only 3D components, with a small percentage (2%) containing intercalant atoms (3D + 0D). We find that twenty one 3D compounds also contain 1D ribbons passing through open channels in the structure, for example Li2N9Li(H2O)3 (Fig. 4(b)), and three compounds possess a combination of 3D, 1D, and 0D components.
Similarly, for 2D structures, the majority are comprised of solely 2D components (89%), with smaller subsets containing mixed 2D/0D components (10%), mixed 2D/1D components (1%), and mixed 2D/1D/0D components (six materials). An example of a structure with mixed 2D/1D dimensionality, BeF2YbF2, is illustrated in Fig. 4(c). For 2D structures containing more than one 2D component, the orientations of the 2D sheets are always aligned in the same direction. 1D structures exhibit the largest percentage of mixed component-dimensionality compounds (31%); however, again structures with only a single component-dimensionality compound dominate (69%). For 1D structures, however, several compounds possess ribbons bonded in orthogonal directions (as identified through the orientation analysis in robocrystallographer), such as SbF3(SbOF)6 (Fig. 4(d)).
Using robocrystallographer for machine learning
To demonstrate the utility of robocrystallographer in statistical machine learning, we have tested the effect of including robocrystallographer features when modeling elastic properties. Specifically, we have modeled the density functional theory (DFT) calculations of bulk modulus (K) produced by de Jong,[Reference de Jong, Chen, Angsten, Jain, Notestine, Gamst, Sluiter, Ande, van der Zwagg, Plata and Toher28] provided as the “elastic_tensor_2015” dataset in the matminer package.[Reference Ward, Dunn, Fahaninia, Zimmermann, Bajaj, Wang, Montoya, Chen, Bystrom, Dylla, Chard, Asta, Persson, Snyder, Foster and Jain17] This dataset consists of 1181 inorganic compounds. Three models were trialed, the first included only composition-based features,[Reference Ward, Agrawal, Choudhary and Wolverton29] the second included composition and sine matrix structural features (implemented in the SineColoumbMatrix featurizer in matminer[Reference Faber, Lindmaa, Von Lilienfeld and Armiento30]), and the final model included composition and robocrystallographer features. As the purpose of this study is to demonstrate the potential of robocrystallographer features, we used the same simple regression model (random forest with 100 estimators) for all feature sets. The total number of features in each model was reduced to 10 using the MultiSURF algorithm, as implemented in the Scikit-Rebate package.[Reference Tzanis, Berberidis and Vlahavas31,Reference Urbanowicz, Olson, Schmitt, Meeker and Moore32] Full details are provided in Supplementary Material. The model including the robocrystallographer features produced slightly more accurate predictions of bulk modulus (mean squared error [MSE] of 537 GPa) relative to the model containing just composition-based features (MSE of 544 GPa) and that containing both structure and composition features (MSE of 544 GPa). Perhaps, more importantly, a plot of predicted versus DFT calculated bulk modulus demonstrates that many outliers are reduced with the addition of the robocrystallographer features (see Supplementary Material). In addition to improved performance, the features produced by robocrystallographer allow for interpretable models through the analysis of feature importance plots (as provided in the Supplementary Material). In contrast, the sine matrix structural features do not have a clear physical interpretation which makes it difficult to rationalize models containing these features.
Discussion
Robocrystallographer brings together many previously unconnected analysis packages into a centralized toolkit for better understanding crystal structures. Once a structure is condensed into a descriptive JSON representation, the user can perform many different types of analyses and searches on the data. For example, the data can be used to classify materials by properties such as polyhedral connectivity that were previously difficult to calculate automatically. Furthermore, the JSON data are easily searchable and therefore could be used to create a database of structures that can be filtered based on materials properties, including site geometry and connectivity, or by dimensionality as we demonstrated in this work. An additional opportunity is the ability to make a library of crystal structure components that could be used to compose novel materials or to understand trends in crystal structures formed by various compositions. In a similar vein, the condensed structure can be used to assess the overall structural and chemical diversity of crystal structure databases. Lastly, the analysis may be of use in analyzing defective crystal structures; indeed, the mineral matching routines implemented are somewhat robust to the presence of vacancies in the structure, as discussed in Supplementary Material. Nevertheless, small changes in the algorithms (e.g., excluding “standard deviation” from the fuzzy structure fingerprints) may further increase robustness to finding defect structures.
Robocrystallographer is, to our knowledge, the first tool that can produce text-based descriptions of crystal structures. The descriptions can be automatically generated for libraries of compounds and used to provide additional easy to understand the analysis of structural properties. If integrated into online databases such as the Materials Project,[Reference Jain, Ong, Hautier, Chen, Richards, Dacek, Cholia, Gunter, Skinner and Ceder27] the text descriptions can help provide a greater context and improved understanding of the structures, as well as to improve accessibility for visually impaired users. Disseminating these text descriptions may also encourage a feedback cycle in which users can help improve the performance of existing structure analysis tools. For example, if robocrystallographer produces an unexpected result, it will be immediately apparent to a user reading the text description, who may report such discrepancies to the software package authors to improve the underlying algorithms. Robocrystallographer can thus facilitate the improvement of structure analysis routines by making it easy to validate their results.
Another area in which robocrystallographer may be used is in text mining the literature to extract materials information. Current text mining approaches can parse materials compositions accurately[Reference Swain and Cole33,Reference Kim, Huang, Saunders, McCallum, Ceder and Olivetti34] but are unable to transform text descriptions of structures into any usable information. Using text similarity algorithms[Reference Gomaa and Fahmy35] to compare the reported structure descriptions in a text report with robocrystallographer descriptions for a set of candidate structures, it may be possible to better understand what structure is being described in a particular piece of text, making progress towards the longstanding issue of extracting structure from materials text.
Conclusion
We have introduced robocrystallographer, an open-source toolkit for analyzing crystal structures. The package can condense a structure into a descriptive JSON representation amenable to analysis and provides insights into the local coordination and polyhedral type, polyhedral connectivity, octahedral tilt angles, and component dimensionality. Additional analysis enables heterostructure and molecule-within-crystal identification, and fuzzy prototype matching. Using this information, robocrystallographer can generate text-based descriptions of crystal structures that resemble descriptions written by human crystallographers. We used the output of robocrystallographer to investigate the dimensionalities of all compounds in the Materials Project database, finding a rich degree of structural diversity and highlighting interesting cases such as mixed dimensionality. Lastly, we highlight the potential of robocrystallographer in machine learning studies.
Supplementary Material
The supplementary material for this article can be found at https://doi.org/10.1557/mrc.2019.94.
Acknowledgments
The authors acknowledge many useful discussions with Matt Horton regarding structure dimensionality. The authors additionally acknowledge Matt Horton for his work on the StructureGraph and BondedStructure components of pymatgen and for parsing the AFLOW prototype library. The authors acknowledge Evan Spotte-Smith for his work on the MoleculeGraph functionality in pymatgen. The authors acknowledge useful discussions with Leigh Weston regarding materials science text mining. The authors acknowledge Donny Winston for facilitating the calculation of robocrystallographer on all structures in the Materials Project database. The authors acknowledge useful conversations with Alex Dunn regarding machine learning model optimization. This work was intellectually led and funded by the U.S. Department of Energy (DOE) Basic Energy Sciences (BES) program—the Materials Project—under Grant No. KC23MP. Lawrence Berkeley National Laboratory is funded by the DOE under award DE-AC02-05CH11231.