


1 Introduction
Because housing prices reflect households’ bids for housing in different locations, a regression of house value or rent on housing and neighborhood characteristics, also called a hedonic regression, is a key tool in the study of household demand for public school quality, clean air, neighborhood safety, access to worksites, and neighborhood ethnic composition, among other things. Moreover, when direct measures of demand are not available, hedonic regressions are a valuable tool for estimating the benefits from public programs that alter these neighborhood traits (Graves, Reference Graves2012). In recent years, many scholars have developed new techniques to solve problems, such as endogeneity, that arise in estimating hedonic regressions. Unfortunately, however, many applications of these techniques have lost track of the basic principles of hedonic estimation in Rosen (Reference Rosen1974) and its extensions; thus, they often provide misleading estimates of household willingness to pay (WTP) for neighborhood improvements. After providing background on the Rosen framework and the subsequent literature, this article illustrates these hedonic “vices” and shows how to fix them.
More specifically, Section 2 reviews the Rosen framework, with a focus on the relationship between attribute bid functions and their hedonic envelope. Section 3 turns to three types of vices: the use of extreme or incorrect functional forms, the use of inappropriate control variables, and the misinterpretation of hedonic regression results. Our analysis is supported, in Section 4, with estimates using data from the Cleveland area in 2000 and with Monte Carlo simulations. Section 5 presents our conclusions and reviews how these vices can be averted.
2 Background
2.1 The Rosen framework
Most studies in this literature, including this one, follow the framework in the seminal article by Rosen (Reference Rosen1974), which explores the pricing of multiattribute products in a competitive market. Rosen distinguishes between a household bid function for a product attribute and the market price function, also known as the hedonic. In our terms (which differ from Rosen’s),
 $P$
is a bid and
 $S$
is an amenity. A bid function is an isoutility curve for
 $P$
and
 $S$
for a given type of household, and the hedonic, labeled
 $P^{E}$
, is the envelope of bid functions across households. The allocation of households across values of
 $S$
is known as “sorting.” Figure 1, which is analogous to Figure 2 in Rosen, provides an example of this bidding–sorting framework.
A bid-function envelope for school quality.

When applied to housing, Rosen’s framework highlights the fact that housing prices reflect both the underlying demands for amenities, bidding, and the allocation of households across neighborhoods with different levels of the amenity, sorting. Rosen proposes a two-step empirical approach that makes it possible to separate these two factors. The first step is to estimate a hedonic regression,
 $P^{E}$
as a function of
 $S$
, and then to differentiate the results to find the implicit or hedonic price,
 $\unicode[STIX]{x2202}P^{E}\!/\unicode[STIX]{x2202}S\equiv P_{S}^{E}$
, at each value of
 $S$
. Because each bid function is tangent to the envelope, the derivative of the envelope at the value of
 $S$
a household receives equals the implicit price it faces. The second step is to estimate the demand for
 $S$
by regressing
 $S$
on
 $P_{S}^{E}$
and other demand factors. An equivalent procedure is to estimate the inverse demand function, that is, to regress
 $P_{S}^{E}$
on
 $S$
(and other demand factors).
As is well known, the main problem with this procedure is that the implicit price is endogenous in the second-step regression (or, equivalently,
 $S$
is endogenous in the second-step inverse demand regression); see Taylor (Reference Taylor, Baranzini, Ramirez, Schaerer and Thalmann2008). If the hedonic function is nonlinear, households “select” an implicit price when they select a level of
 $S$
. And if the hedonic is linear, it yields no variation in implicit prices with which to estimate demand. Households have different preferences, so the level of
 $S$
and hence the implicit price they select depend on their observed and unobserved traits. Regressions of
 $S$
on the implicit price (or vice versa) are therefore subject to endogeneity bias. Another challenge facing this procedure is bias in the first-step regression due to omitted neighborhood variables. As we will see, attempts to address these challenges sometimes introduce endogeneity into (or change the meaning of) the first-step regression.
The literature on local public finance (reviewed in Ross & Yinger, Reference Ross, Yinger, Cheshire and Mills1999) complements the Rosen framework in the case of public services and neighborhood amenities (both designated by
 $S$
). This literature emphasizes the importance of household sorting across communities (or neighborhoods) with different values of
 $S$
. Figure 1 illustrates the most fundamental sorting theorem, namely, that households with higher demand for
 $S$
and hence with steeper bid functions sort into locations with higher
 $S$
. Sorting plays a critical role in our federal system, and this sorting theorem has been explored by several scholars, notably Epple and Sieg (Reference Epple and Sieg1999), Epple, Romer and Sieg (Reference Epple, Romer and Sieg2001), and Epple, Peress and Sieg (Reference Epple, Peress and Sieg2010). In this context, a “steeper bid function” is one that is steeper at a given value of
 $S$
, which we call “relative” steepness. This relative steepness is not the same as Rosen’s implicit price, which is the slope of the envelope at the level of
 $S$
a household consumes, because this implicit price is affected by
 $S$
. The slope of a bid function at a given
 $S$
is a household type’s marginal willingness to pay (MWTP) for the amenity at that level of
 $S$
. As shown in Figure 1 and panel A of Figure 2, the high level of
 $S$
consumed by high-demand households may push them so far down their demand curve that the implicit price they face is below the implicit price faced by low-demand households – despite the higher relative slope that goes with high demand.Footnote
2
Sorting and the distribution of MWTP.

Rosen (Reference Rosen1974) recognized that his framework was “similar in spirit to Tiebout’s (Reference Tiebout1956) analysis of the implicit market for neighborhoods, local public goods being the ‘characteristics’ in this case” (p. 40). Nevertheless, the literature on local public finance has shifted the framework used by most studies of this topic in two ways. First, it assumes that people care about housing services,
 $H$
, which are a function of the structural characteristics of housing, and public services,
 $S$
, but it treats these two components differently. Housing services are determined by a function that is common across households, and households are able to alter the amount of
 $H$
their house delivers. In contrast, house buyers treat public services as fixed and households must compete for entry into places where
 $S$
is high, which leads to household sorting.Footnote
3
This approach alters the algebra of a hedonic equation but does not alter the basic principles. As we will see, for example, it leads to expressions of MWTP for
 $S$
per unit of housing services, labeled MWTPH. Because MWTP = (MWTPH)(H) and our assumptions imply that sorting is not influenced by
 $H$
, we can readily move between the two MWTP concepts. The slope of the hedonic in Figure 1, for example, could be interpreted as MWTPH.
Second, this approach provides a way to simplify the supply side. Rosen’s framework applies to goods with multiple traits. Heterogeneous firms each have an offer function for each trait, and the market price function is a joint envelope of the bid and offer functions. With restrictive assumptions, it is possible to derive a form for this joint envelope (as in Epple, Reference Epple1987). In the case of housing, however, housing suppliers do not supply neighborhood amenities and the focus has been on the demand side. We think this is entirely appropriate.
2.2 Rouwendal’s quadratic envelope
An envelope is a mathematical concept and further insight into the Rosen framework can be gained by showing the assumptions about bidding and sorting that are necessary to derive alternative forms for the hedonic envelope. The hedonic vices we identify below arise even without a formal treatment of bidding and sorting, but the use of this mathematical link helps clarify the sources of these vices and why they lead to faulty inferences about WTP. We start with a quadratic envelope derived by Rouwendal (Reference Rouwendal1992) and then turn to an envelope based on constant-elasticity demand functions developed by Yinger (Reference Yinger2015b ).
An envelope is the solution to two equations: a family of crossing curves, written in implicit form as
 $f\{P,S,Y\}=0$
(where
 $P$
and
 $S$
are variables and each member of the family has a different value of the parameter,
 $Y$
) and
 $f_{Y}\{P,S,Y\}=0$
(where
 $f_{Y}$
is the derivative of
 $f$
with respect to the parameter). In our case,
 $f$
is a bid function:
 $P$
is the bid (or its log) for a unit of housing services,
 $S$
is the amenity, and
 $Y$
is income. As we will see, the
 $f_{Y}$
equation describes the sorting equilibrium.
Rouwendal’s (Reference Rouwendal1992) hedonic envelope assumes that the bid function takes the form:
 $$\begin{eqnarray}P=\unicode[STIX]{x1D6FC}_{0}+\unicode[STIX]{x1D6FC}_{1}M+\unicode[STIX]{x1D6FC}_{2}M^{2}+(\unicode[STIX]{x1D6FD}_{0}+\unicode[STIX]{x1D6FD}_{1}M)S,\end{eqnarray}$$
where
 $M$
indicates demand determinants (including income,
 $Y$
) and
 $S$
indicates a public service or amenity.Footnote
4
Rouwendal then treats
 $M$
as the parameter that varies across households. To find the envelope, therefore, Rouwendal differentiates (1) with respect to
 $M$
to obtain
 $$\begin{eqnarray}\frac{\text{d}P}{\text{d}M}=\unicode[STIX]{x1D6FC}_{1}+2\unicode[STIX]{x1D6FC}_{2}M+\unicode[STIX]{x1D6FD}_{1}S.\end{eqnarray}$$
Setting this derivative equal to zero and solving for
 $M$
yields
 $$\begin{eqnarray}M=\frac{-(\unicode[STIX]{x1D6FC}_{1}+\unicode[STIX]{x1D6FD}_{1}S)}{2\unicode[STIX]{x1D6FC}_{2}},\end{eqnarray}$$
where
 $\unicode[STIX]{x1D6FC}_{2}<0$
. Now substituting equation (3) into equation (1) yields the envelope:
 $$\begin{eqnarray}P^{E}=\unicode[STIX]{x1D6FE}_{0}+\unicode[STIX]{x1D6FE}_{1}S+\unicode[STIX]{x1D6FE}_{2}S^{2},\end{eqnarray}$$
where
 $$\begin{eqnarray}\unicode[STIX]{x1D6FE}_{0}=\unicode[STIX]{x1D6FC}_{0}-\frac{\unicode[STIX]{x1D6FC}_{1}^{2}}{4\unicode[STIX]{x1D6FC}_{2}};\quad \unicode[STIX]{x1D6FE}_{1}=\unicode[STIX]{x1D6FD}_{0}-\frac{\unicode[STIX]{x1D6FC}_{1}\unicode[STIX]{x1D6FD}_{1}}{2\unicode[STIX]{x1D6FC}_{2}};\quad \unicode[STIX]{x1D6FE}_{2}=-\frac{\unicode[STIX]{x1D6FD}_{1}^{2}}{2\unicode[STIX]{x1D6FC}_{2}}.\end{eqnarray}$$
Three points are worth emphasizing. First, Rouwendal (Reference Rouwendal1992) explains that equation (3) shows the value of
 $M$
that maximizes the bid at a given value of
 $S$
. This interpretation fits the intuition of sorting, which allocates housing at a given location (= given value of
 $S$
) to the household with the demand factors (
 $M$
) that lead to the highest bid for
 $S$
at that location. Another way to make this point is that
 $M$
determines the slope of a bid function at a given
 $S$
; it is therefore the parameter that determines sorting. Thus, equation (3) describes the sorting equilibrium.
Second, the slope of the envelope reflects both the slope of the underlying bid functions and the slope of the sorting equilibrium. Bid functions generally get flatter as the amenity increases because of the law of diminishing marginal rate of substitution (MRS), but sorting implies steeper bid-function slopes as
 $S$
increases. In the Rouwendal case, the bid functions (equation (1)) are linear in
 $S$
, which corresponds to linear utility functions, that is, to a situation in which the MRS does not diminish as
 $S$
increases. In this case, bidding has the same impact on the slope of the envelope at all values of
 $S$
. It follows that the slope of the envelope has to increase as
 $S$
increases because the sorting factor is the only one at work.
Third, the distinction between bid functions and the envelope is analogous to the distinction between short-run average cost curves (SRACs) and long-run average cost curves (LRACs). An LRAC is the envelope of a set of SRACs. Each SRAC applies at a different value of the capital stock, and a set of SRACs is estimated with the capital stock as a variable.Footnote
5
Any cost regression that includes capital stock must be interpreted as estimating SRACs, although it is only correctly specified for this purpose if it also includes interactions between capital stock and output. The same lesson applies to the hedonic envelope. If demand variables are included, the regression examines bid functions, not a hedonic envelope, and a bid-function regression should include interactions between demand factors and amenities. Equation (1) has an interaction between
 $M$
and
 $S$
, for example. Without such interactions, all households have the same bid-function slope at a given
 $S$
and sorting is not possible. Moreover, a bid-function regression must treat the amenity variables as endogenous because unobserved demand traits affect both amenity choices and housing prices.
2.3 The constant-elasticity case
Yinger (Reference Yinger2015b
) provides a more general discussion of sorting and extends envelope derivations to the case of constant-elasticity demand functions for amenities and housing. He starts by deriving a general form for a household bid function. He assumes, like most of the literature, that household utility depends on a composite good,
 $Z$
, housing services,
 $H$
, and a public service or amenity,
 $S$
. Households maximize their utility subject to the constraint that their income equals spending on
 $Z$
, spending on housing, PH, and property taxes, which are levied at rate
 $\unicode[STIX]{x1D70F}$
on house value,
 $V=\mathit{PH}/r$
, where
 $r$
is a discount rate.
 $P=P\{S,\unicode[STIX]{x1D70F}\}$
is a bid per unit of
 $H$
that depends on
 $S$
and
 $\unicode[STIX]{x1D70F}$
. This well-known (Ross & Yinger, Reference Ross, Yinger, Cheshire and Mills1999) maximization problem leads to
 $$\begin{eqnarray}\hat{P}_{S}=\frac{\mathit{MB}_{S}}{H},\end{eqnarray}$$
where “
 $\,\hat{\;}\,$
” denotes a before-tax bid and
 $\mathit{MB}_{S}$
is the MWTP for
 $S$
. The role of property taxes is not important for our purposes and is therefore not considered.Footnote
6
Yinger then assumes that the demands for
 $S$
and
 $H$
take the following forms:
 $$\begin{eqnarray}S=K_{S}N^{\unicode[STIX]{x1D6FF}}Y^{\unicode[STIX]{x1D703}}W^{\unicode[STIX]{x1D707}}\end{eqnarray}$$
and
 $$\begin{eqnarray}H=K_{H}M^{\unicode[STIX]{x1D70C}}Y^{\unicode[STIX]{x1D6FE}}\left(P\left(1+\frac{\unicode[STIX]{x1D70F}}{r}\right)\right)^{\unicode[STIX]{x1D708}}=K_{H}M^{\unicode[STIX]{x1D70C}}Y^{\unicode[STIX]{x1D6FE}}\!\hat{P}^{\unicode[STIX]{x1D708}},\end{eqnarray}$$
where
 $W$
equals tax price,
 $K_{S}$
and
 $K_{H}$
are constants, and
 $N$
and
 $M$
are vectors of preferences and other demand variables than income
 $Y$
, both observable and unobservable. LaFrance (Reference LaFrance1986) derives these forms from a model of “incomplete” demand, in which one set of commodities (
 $Z$
) is not observed but affects the observed commodities (
 $S$
and
 $H$
) through a price index, which appears in
 $N$
and
 $M$
. More specifically, LaFrance shows that these forms are consistent with the integrability requirements of a demand system.Footnote
7
This result is important here because it preserves the link between estimated price elasticities and household WTP.
Substituting the inverse of (7), which equals
 $\mathit{MB}_{S}$
, and (8) into (6) and assuming that
 $\unicode[STIX]{x1D708}=-1$
,Footnote
8
yields the following differential equation:
 $$\begin{eqnarray}\frac{\hat{P}_{S}}{\hat{P}}=\unicode[STIX]{x1D713}S^{1/\unicode[STIX]{x1D707}},\end{eqnarray}$$
where
 $$\begin{eqnarray}\unicode[STIX]{x1D713}=((K_{S}N^{\unicode[STIX]{x1D6FF}})^{1/\unicode[STIX]{x1D707}}K_{H}M^{\unicode[STIX]{x1D70C}}Y^{(\unicode[STIX]{x1D703}/\unicode[STIX]{x1D707})+\unicode[STIX]{x1D6FE}})^{-1}.\end{eqnarray}$$
The solution to this differential equation, that is, the bid function, is
 $$\begin{eqnarray}\ln \{\hat{P}\{S\}\}=C+\left(\frac{\unicode[STIX]{x1D713}\unicode[STIX]{x1D707}}{1+\unicode[STIX]{x1D707}}\right)S^{(1+\unicode[STIX]{x1D707})/\unicode[STIX]{x1D707}},\end{eqnarray}$$
where
 $C$
is a constant of integration. Note that the slope of a bid function at a given value of
 $S$
depends on
 $\unicode[STIX]{x1D713}$
; that is, the role of
 $\unicode[STIX]{x1D713}$
in equation (11) is the same as the role of
 $M$
in equation (1).
Yinger’s next step is to find the envelope of equation (11) using the sorting theorem. He reverses the mathematical steps in Rouwendal. Instead of arbitrarily specifying the constant and then differentiating the bid function to find
 $\unicode[STIX]{x2202}f\{P,S,\unicode[STIX]{x1D713}\}/\unicode[STIX]{x2202}\unicode[STIX]{x1D713}$
, Yinger draws on the sorting theorem to specify
 $\unicode[STIX]{x2202}f\{P,S,\unicode[STIX]{x1D713}\}/\unicode[STIX]{x2202}\unicode[STIX]{x1D713}$
, which describes the sorting equilibrium, and then integrates to find the constant. This approach opens the door to a more general derivation of hedonic envelopes and ensures a link between the form of the envelope and the assumptions about sorting.
More specifically, Yinger (Reference Yinger2015a
,Reference Yinger
b
) explores the case of one-to-one matching in which each household type, identified by a value for
 $\unicode[STIX]{x1D713}$
, sorts into a unique value for
 $S$
. In this case, Yinger shows that the nature of the sorting equilibrium does not directly depend on the distributions of
 $\unicode[STIX]{x1D713}$
and
 $S$
; instead, it depends on the function that transforms the
 $\unicode[STIX]{x1D713}$
distribution into the
 $S$
distribution (or vice versa). Suppose, for example, that both
 $\unicode[STIX]{x1D713}$
and
 $S$
have normal distributions. Any normal distribution can be transformed into any other normal distribution with a linear transformation. In this example, therefore, the sorting equilibrium can be described by
 $S$
as a linear function of
 $\unicode[STIX]{x1D713}$
. To provide for a wider range of possible transformations between the
 $\unicode[STIX]{x1D713}$
and
 $S$
distributions, Yinger assumes that the sorting equilibrium can be described by
 $$\begin{eqnarray}S\{\unicode[STIX]{x1D713}\}=(\unicode[STIX]{x1D70E}_{1}+\unicode[STIX]{x1D70E}_{2}\unicode[STIX]{x1D713})^{\unicode[STIX]{x1D70E}_{3}},\end{eqnarray}$$
where the
 $\unicode[STIX]{x1D70E}$
terms are parameters to be estimated. Assuming a linear form for this equilibrium, as in the above example, corresponds to assuming that
 $\unicode[STIX]{x1D70E}_{3}=1$
. The sorting theorem states that household types with steeper bid-function slopes sort into locations with higher values of
 $S$
, so this theorem can be tested by determining whether
 $\unicode[STIX]{x1D70E}_{2}$
and
 $\unicode[STIX]{x1D70E}_{3}$
are both positive. Finally, note that equation (12) is analogous to Rouwendal’s equation (3), except that (12) is based on theory.
One-to-one matching is unlikely to hold exactly. Some household types may live in locations with more than one value of
 $S$
, for example, or some locations may be home to more than one household type. A method to consider these cases in a hedonic regression has been developed by Epple et al. (Reference Epple, Peress and Sieg2010), but this method is complex and restricts the analysis to a single amenity.Footnote
9
Moreover, Yinger (Reference Yinger2015a
) shows that one-to-one matching is likely to provide a close approximation to the case of one household type in more than one location. With many household types in a single location, however, no method can observe variation in WTP for more than one amenity across household types, because the price of housing in that location varies with amenity levels, but not with household bids.
Based on equations (11) and (12), Yinger (Reference Yinger2015b ) derives the bid-function envelope:
 $$\begin{eqnarray}(\hat{P}^{E})^{(\unicode[STIX]{x1D706}_{1})}=C_{0}^{\prime }-\frac{\unicode[STIX]{x1D70E}_{1}}{\unicode[STIX]{x1D70E}_{2}}S^{(\unicode[STIX]{x1D706}_{2})}+\frac{1}{\unicode[STIX]{x1D70E}_{2}}S^{(\unicode[STIX]{x1D706}_{3})},\end{eqnarray}$$
where
 $\unicode[STIX]{x1D706}_{1}=1+\unicode[STIX]{x1D708}$
;
 $\unicode[STIX]{x1D706}_{2}=(1+\unicode[STIX]{x1D707})/\unicode[STIX]{x1D707}$
;
 $\unicode[STIX]{x1D706}_{3}=\unicode[STIX]{x1D706}_{2}+1/\unicode[STIX]{x1D70E}_{3}$
;
 $X^{(\unicode[STIX]{x1D706})}=(X^{\unicode[STIX]{x1D706}}-1)/\unicode[STIX]{x1D706}$
if
 $\unicode[STIX]{x1D706}\neq 0$
; and
 $X^{(\unicode[STIX]{x1D706})}=\ln \{X\}$
if
 $\unicode[STIX]{x1D706}=0$
. The function
 $X^{(\unicode[STIX]{x1D706})}$
is the Box–Cox form. Figure 1 gives an example of this envelope. With multiple amenities, the terms on the right side other than the constant become summations across amenities, with different parameter values for each amenity. With
 $\unicode[STIX]{x1D708}=-1$
, the left side of equation (13) equals
 $\log \{\hat{P}^{E}\}$
, and this form can be incorporated into a standard log–linear regression with logged house value,
 $V$
, as the dependent variable, and with controls for structural housing traits, which determine housing services,
 $H$
, and the property tax rate; see Yinger (Reference Yinger2015b
).
Special cases of the bid-function envelope.

a Each formula in Panel B also has a constant term.
b This case also requires that
 $\unicode[STIX]{x1D70E}_{1}=0$
.
As shown in Table 1, most parametric forms used for hedonic estimation (including linear, semilog, log–linear, Box–Cox, and quadratic) are special cases of (13). Some forms implicitly assume, for example, that
 $\unicode[STIX]{x1D707}=-\infty$
, which indicates a horizontal demand curve; a linear form also assumes that
 $\unicode[STIX]{x1D70E}_{3}=\infty$
, whereas a quadratic form assumes a linear sorting equilibrium (
 $\unicode[STIX]{x1D70E}_{3}=1$
). A semilog specification implicitly assumes that
 $\unicode[STIX]{x1D708}=-1$
and
 $\unicode[STIX]{x1D707}=\unicode[STIX]{x1D70E}_{3}=\infty$
. Thus, most forms in the literature are based on stronger assumptions than those behind (13).
A key insight from (13) is that specifications consistent with sorting generally require two terms on the right side. The second term drops out if
 $\unicode[STIX]{x1D70E}_{3}=\infty$
, which, according to (12), implies that
 $S$
is not a function of
 $\unicode[STIX]{x1D713}$
, or, in other words, that sorting does not take place.Footnote
10
As the Rosen framework makes clear, the concept of sorting is essential for isolating WTP with heterogeneous households, so one-term hedonics should be regarded with great skepticism. A one-term Box–Cox specification consistent with sorting arises when
 $\unicode[STIX]{x1D70E}_{1}=0$
, that is, when
 $S$
is proportional to
 $\unicode[STIX]{x1D713}$
in equilibrium, so the first term in (13) drops out.Footnote
11
This is Case 4C in Table 1.
2.4 Summary
In summary, the hedonic function is mathematically related to the bid-function envelopes. As we will see, the hedonic vices discussed in this paper are all related to this mathematical connection. Some of the vices reflect extreme assumptions about the bid functions or the envelope, others reflect an inconsistency between the forms assumed for these two functions, and still others arise because scholars confuse the bid-function and envelope concepts.
3 Hedonic vices
3.1 Functional form vices
3.1.1 Strong implicit assumptions
Any form for the envelope is based on explicit or implicit assumptions about the bid functions and the sorting equilibrium. With constant-elasticity demands and a sorting equilibrium characterized by equation (13), a univariate form for the envelope rules out sorting unless
 $S$
is proportional to a power of
 $\unicode[STIX]{x1D713}$
in the sorting equilibrium.Footnote
12
For two reasons, however, the possibility of a one-term hedonic consistent with sorting (Case 4C in Table 1) does not lead to a compelling empirical procedure. First, Case 4C in Table 1 cannot be empirically distinguished from Case 4B, which is also a Box–Cox form – but is inconsistent with sorting.Footnote
13
Second, it does not make sense to begin with this one-variable form, because the assumption required for its validity can readily be tested. Using data for the Cleveland area, for example, Yinger (Reference Yinger2015b
) estimates equation (13) for a measure of school district quality and rejects the hypothesis that
 $\unicode[STIX]{x1D70E}_{1}=0$
.
This analysis leads to what is perhaps the most common hedonic vice, namely, the use of a single right-side term (for each amenity) to specify the hedonic regression – an approach that rules out sorting. Kuminoff, Parmeter and Pope (Reference Kuminoff, Parmeter and Pope2010, Table 1) identify 69 housing hedonic studies listed in the Social Science Citation Index for 1988–2008. Eighty percent of these studies use a linear–linear, log–linear, or log–log specification for their regressions. Another 17% use a Box–Cox form; as just noted, a standard Box–Cox specification does not solve the sorting problem. In addition, a recent review of school-quality capitalization studies (Nguyen-Hoang & Yinger, Reference Nguyen-Hoang and Yinger2011) did not find any study (other than a preliminary version of Yinger, Reference Yinger2015b ) with a two-variable specification. Another recent example is a study of air pollution by Bajari, Fruehwirth, Kim and Timmins (Reference Bajari, Fruehwirth, Kim and Timmins2012), who develop a method to account for omitted variables using double-sales data, but then apply this method to a linear specification of the hedonic. This approach implicitly rules out sorting, so the results cannot be used to shed light on WTP for clean air. Bayer, Ferreira and McMillan (Reference Bayer, Ferreira and McMillan2007, henceforth BFM) develop and estimate a discrete-choice model of household sorting. They also estimate two linear hedonic regressions, one for comparisons with their discrete-choice estimates and the other for an instrumental variable (IV) in their discrete-choice estimation procedure. BFM’s use of a linear hedonic is inconsistent, however, with the bid functions implied by their discrete-choice model. To be specific, their equation (2) defines a linear bid function.Footnote 14 The envelope of a set of linear bid functions cannot be linear, unless all households are alike. The analysis by Rouwendal (Reference Rouwendal1992), for example, shows that linear bid functions (equation (1) above) lead to a quadratic envelope (equation (4)). Thus, BFM compares a hedonic that rules out sorting to their discrete-choice model of sorting, and their procedure to estimate sorting makes use of a sorting-free instrument.
Finally, a few studies (e.g., Halvorsen & Pollakowski, Reference Halvorsen and Pollakowski1981) use a quadratic Box–Cox form, which has two terms for each amenity with exponents
 $\unicode[STIX]{x1D706}$
and
 $2\unicode[STIX]{x1D706}$
. This form is consistent with equation (13) (or Table 1, Case 4A) only in the hard-to-interpret special case with
 $\unicode[STIX]{x1D707}=1/(\unicode[STIX]{x1D706}-1)$
,
 $\unicode[STIX]{x1D70E}_{3}=1/\unicode[STIX]{x1D706}$
, and no across-amenity interaction terms. This multivariate specification is therefore also not consistent with sorting, at least not with the assumptions in this paper.
3.1.2 Contradictions between steps
The Rosen two-step method calls for a general first-step regression combined with a specific second-step demand function. As shown by the Rouwendal (Reference Rouwendal1992) and Yinger (Reference Yinger2015b ) derivations, assumptions about the form of the bid function combined with an assumption about the sorting equilibrium lead to a form for the envelope. Scholars who implement the Rosen two-step procedure should make an effort to ensure that they use consistent forms in the two steps.
Some approaches are clearly contradictory, at least with constant-elasticity demands. Forms for the hedonic that implicitly assume no sorting, such as linear or log–linear (Table 1, cases 2B and 3B), should not be used to estimate a second-step demand model, which is designed to shed light on sorting. Moreover, a quadratic hedonic assumes that bid functions are linear, which corresponds to an infinite price elasticity of demand (Table 1, case 3A), and therefore cannot be combined with a second-step demand that allows the elasticity to be finite.
Our analysis in the previous section also shows that Box–Cox forms do not resolve this issue. A single Box–Cox form might or might not be consistent with sorting, and the estimated coefficients do not reveal whether the required assumption, namely, proportionality between
 $S$
and a power of
 $\unicode[STIX]{x1D713}$
, is satisfied. Moreover, a quadratic Box–Cox is consistent with sorting only in one hard-to-interpret special case.
Another approach is to use a nonparametric method to estimate the first step and a parametric form to estimate the second. Bajari and Kahn (Reference Bajari and Kahn2005), for example, estimate the hedonic using local linear regression and estimate the second-step demand function under the assumption that the price elasticity of amenity demand,
 $\unicode[STIX]{x1D707}$
, equals - 1. With this assumption, both sides of the demand function can be multiplied by the implicit price,
 $P_{S}$
, to yield
 $P_{S}S$
on the left side and nothing endogenous on the right. This approach has the advantage that it addresses the endogeneity problem without requiring an instrument, but it may result in inconsistency between the demand functions and the hedonic. According to Table 1, the assumptions that
 $\unicode[STIX]{x1D707}=-1$
and that sorting exists (which requires
 $\unicode[STIX]{x1D70E}_{3}<\infty$
) lead to the specification of case 2A, which is different from local linear regression.
Overall, simple specifications for the hedonic are not generally consistent with household heterogeneity and sorting, except under extreme assumptions. Scholars should identify new assumptions under which the simple form they use is compatible with sorting or replace this form with one of the sorting-consistent forms in Table 1.
3.2 Control variable vices
3.2.1 Demand variables
One implication of the Rosen analysis, confirmed by the examples in Section 2 and the analogy with cost curves, is that bid functions depend on household demand characteristics, but the envelope does not. In this context, a “demand variable” is any variable other than price that affects household demand for an amenity, including income and family traits (e.g., education, age, or size). This theory implies that variables serving only as demand variables will not be statistically significant in a properly specified hedonic regression, but they might be significant with an improper specification. A linear specification, for example, rules out variation in the implicit price as the level of the amenity changes. Because variation in the implicit price is almost certainly correlated with demand traits, household characteristics are likely to be significant in a linear “hedonic” even when they serve only as demand variables.
Any regression that includes household demand variables, therefore, should be considered a bid-function regression.Footnote 15 Estimating bid functions is a perfectly reasonable thing to do in principle, but it runs into two difficult problems in practice. First, the impact of demand variables on amenity bids must be specified through interaction terms, such as the last term in equation (1). Without interactions, the impact of an amenity on housing bids is the same for all households, which rules out heterogeneity and sorting based on observable demand traits.
Second, bid functions are subject to the fundamental endogeneity problem discussed earlier. In standard applications, this endogeneity problem does not arise when estimating the hedonic, but it does arise in Rosen’s second step because unobserved demand factors influence both the implicit price of an amenity and the level of the amenity. When bid functions are estimated as a first step, unobserved demand variables are correlated with both the amenity variables included in the regression and housing bids. A related endogeneity problem may arise from a correlation between observed and unobserved demand variables.
Rosen (Reference Rosen1974) makes it clear that demand variables appear in bid functions but do not belong in the envelope. Several scholars (in addition to Rouwendal, Reference Rouwendal1992 and Yinger, Reference Yinger2015b ) have emphasized this difference. For example, Butler (Reference Butler1982, p. 96) concludes that “augmenting the list of independent variables with such demander characteristics as income – a fairly common practice – is a clear misspecification.” In our terms, adding demand characteristics changes the interpretation of the regression, whereas leaving out interactions rules out sorting.Footnote 16
This discussion focuses on household-level demand variables. In practice, however, most studies do not include household-level information but do observe demand variables at the neighborhood level.Footnote 17 Because of sorting, neighborhood-level demand variables may cause the same problems. Sorting implies that neighborhood income and household type may be highly correlated with the individual income and the other household traits that influence housing bids. As a result, estimating a house-value regression with neighborhood traits and neighborhood-level demand variables on the right side examines bid functions, not their envelope – the hedonic.
This point was made by Butler (Reference Butler1982, p. 96n), whose review of empirical work says that “[I]n most of these studies, income and other demander characteristics are intended as proxies for neighborhood quality. However, since the data used were aggregated to the ‘neighborhood’ level, it is impossible to separate the function of, for example, income as a neighborhood quality proxy from its role as a characteristic of demanders in that neighborhood.”Footnote 18
Many hedonic studies that rely on the Rosen framework include neighborhood-level demand variables such as income and education as “controls” (BFM; Black, Reference Black1999; Palmquist, Reference Palmquist1984; Kane, Riegg & Staiger, Reference Kane, Riegg and Staiger2006; and Brasington & Hite, Reference Brasington and Hite2008). Thus, these studies estimate bid functions instead of hedonic envelopes. None of these studies includes interaction terms between demand variables and amenities, which is required for bid-function slopes to vary across household types. As a result, these studies all estimate misspecified bid functions that rule out the possibility of sorting.
Several scholars have made arguments in favor of including demand variables in a hedonic regression. Some of these arguments are helpful but, as we will see, they ultimately fail to address the main issue. Chay and Greenstone (Reference Chay and Greenstone2005, p. 392) argue, for example, as follows:
Income and other similar variables are generally excluded on the grounds that they are “demand shifters” and are needed to obtain consistent estimates of the MWTP function. However, if individuals believe that there are spillovers, then the presence of wealthy individuals or high levels of economic activity is an amenity and the exclusion restriction is invalid. In our analysis, we are agnostic about which variables belong in the X vector.
A similar argument appears in BFM. Their regressions include “border fixed effects” (BFEs), which are discussed in Section 3.3.3. Each BFE refers to a location that is within a certain distance of a segment of a school attendance zone boundary. The neighborhoods on either side of a segment share some traits that cannot be observed, but the impact of these traits on house values can be accounted for with BFEs. As Kane et al. (Reference Kane, Riegg and Staiger2006) and BFM point out, this approach needs to consider sorting. In the words of BFM, “even if a school boundary was initially drawn such that the houses immediately on either side were identical, households with higher incomes and education levels might be expected to sort onto the side with the better school” (p. 590). These studies provide evidence to support this argument; household demographic traits are significantly different on the two sides of a segment. BFM concludes that sorting leads to nicer neighborhoods on the better school side of each segment, because household demographic traits are neighborhood traits, and they include average income and other neighborhood demographic traits in their hedonic regressions.
This approach assumes that people not only care about the income of their potential neighbors, but also know what neighborhood income is wherever they look for housing, perhaps by looking at census data. This assumption has never been tested. Moreover, even if Chay and Greenstone and BFM are correct that neighborhood-level income and other “demographic” variables are seen by potential house buyers as indicators of neighborhood quality, adding them inevitably changes the interpretation of the regression. In other words, demographic controls can help eliminate omitted-variable bias in a bid-function regression but not in a hedonic envelope because their inclusion automatically implies that the envelope is not being estimated. One cannot solve a bias problem with a technique that changes the meaning of the regression.Footnote 19
The importance of this issue depends, of course, on the scale at which neighborhood income is measured. Median zip-code income, for example, is not highly correlated with household income and including it does not significantly alter the interpretation of a hedonic regression. In contrast, median block-group income is likely to be highly correlated with household income. Ioannides (Reference Ioannides2004) finds a highly significant correlation of about 0.3 between a household’s current income and the income of its neighbors. He also points out that the correlation based on current income, which contains a transitory component, likely understates the correlation based on permanent income. Indeed, because current income averages out the transitory component, neighborhood average income could have a much higher correlation with household permanent income than the estimate of 0.3 by Ioannides. In addition, Ioannides explains that the households in a given neighborhood are likely to be at different life-cycle stages. The correlation between neighborhood and household income might be even higher once adjusted for life-cycle differences. As a result, a house-value regression that includes average block-group income appears closer to a bid-function regression than to a hedonic envelope.
The trade-off between reduced bias and change in meaning is not so clear at intermediate scales, such as census tracts. Including average census-tract income (or census-tract fixed effects) in a house-value regression brings in household demand to some degree, but census tracts are considerably larger and more heterogeneous than block groups. Many scholars may find it reasonable in this case to interpret the regression as a hedonic envelope instead of as a family of bid functions, but further research on this case appears to be warranted.
It may also prove valuable for scholars to develop alternative approaches to potential bias from unobserved neighborhood demographics that do not change the meaning of the hedonic regression. One strategy is to use IVs for key neighborhood amenities. This strategy is used in several hedonic analyses of school-quality capitalization (Downes & Zabel, Reference Downes and Zabel2002; Gibbons & Machin, Reference Gibbons and Machin2003, Reference Gibbons and Machin2006; Rosenthal, Reference Rosenthal2003).Footnote 20 An alternative strategy that appears in Anderson and West (Reference Anderson and West2006) and Yinger (Reference Yinger2015b ) is to include as many as observable neighborhood amenities, such as proximity to parks or golf courses, that are correlated with neighborhood demographics.
In summary, hedonic theory says that if demand variables are included, regardless of whether they are measured at the individual or small-neighborhood level, a regression with housing prices as the dependent variables estimates bid functions, not the hedonic envelope. To be consistent with Rosen’s framework, these bid-function regressions must treat amenity and demand variables as endogenous, and demand variables should interact with key amenities.
3.2.2 Neighborhood fixed effects
Many types of spatial fixed effects other than BFEs appear in the literature; see Nguyen-Hoang and Yinger (Reference Nguyen-Hoang and Yinger2011). These fixed effects can be distinguished by (a) their level of aggregation and (b) whether they are based on a single cross-section or panel data. Consider first cross-section fixed effects, which could apply to a census block group (CBG), a census tract, a zip code, a school district, or a county. These fixed effects are popular because they control for all unobserved variation in neighborhood amenities at or above the level of geography to which they apply. Fixed effects cannot be estimated at a given level of geography unless multiple house sales are observed at that level, so larger data sets lead to more chances for using this strategy, especially at a smaller level of geographic aggregation.
The problem with geographic fixed effects in a cross-section is that they control for all unobserved variables, including demand variables, at their specified level of aggregation. As a result, geographic fixed effects may introduce demand factors and hence change the meaning of the regression from an envelope to bid functions. The trade-off here is similar to the one involving demand variables: this is not a problem for fixed effects at a high level of aggregation, such as a county, because a large share of the variation in demand factors occurs within counties. It is a problem, however, for fixed effects at a small-neighborhood level of aggregation, such as a CBG, because, due to sorting, demand variables often do not vary greatly within a small neighborhood. Introducing small-neighborhood level fixed effects therefore transforms a regression from a hedonic envelope into an analysis of bid functions.
Thus, the use of geographic fixed effects involves a trade-off that has not been recognized in the literature. Fixed effects at a smaller scale lead to better controls for unobserved nondemand factors, but it also leads to a higher correlation between the fixed effects and the demand factors that are not allowed in a hedonic regression. A regression with block-group fixed effects, which are highly correlated with demand factors, is essentially equivalent to a bid-function regression, for example, whereas a regression with census-tract fixed effects, which are also correlated with demand factors but not to the same degree, is a hybrid estimation, somewhere between a bid function and an envelope. Fixed effects at higher levels of aggregation do not change the interpretation of the regression, but they do not also help to eliminate bias from omitted nondemand factors at lower levels of aggregation.
Some studies with panel data use repeat sales and include fixed effects for each house. These fixed effects remove all time-invariant factors that might cause omitted-variable bias. The resulting “within” estimator is based solely on variation over time in observed explanatory variables. So long as demand variables are not explicitly included, therefore, this type of regression can be interpreted as the change form of a hedonic envelope. As discussed in Section 3.3.2, these change regressions have serious problems of interpretation, but these problems do not arise from the link between fixed effects and demand factors.
Some studies use panel data not limited to double sales. In these studies, geographic fixed effects remove the over-time average impact of unobservable factors in each geographic unit. The estimates are based on price deviations from these averages in each unit, with no controls (unless they are added separately) for deviations in demand variables from their over-time average. Regardless of the level of aggregation, therefore, the use of geographic fixed effects in a panel setting does not introduce demand factors into the analysis. Section 3.3.3 shows, however, that their use does raise issues of interpretation.
3.3 Interpretation vices
3.3.1 Average MWTP
Some simple two-term forms, such as a quadratic, are consistent with sorting. But even if the form is consistent, the estimated parameters provide limited information about household WTP. As Rosen (Reference Rosen1974) pointed out, each household sets its own MWTP equal to the slope of the hedonic at the value of
 $S$
it receives. As a result, the mean slope of the hedonic across observations is the mean MWTP for the sample. This point is stated clearly in several studies, such as Chay and Greenstone (Reference Chay and Greenstone2005, p. 380), who say “Since the hedonic price schedule reveals the MWTP at a given point, it can be used to infer the welfare effects of a marginal change in a characteristic for a given individual.”
Nevertheless, this feature of the hedonic must be used carefully. A hedonic price does not, after all, indicate how much a given household’s MWTP varies with a nonmarginal change in
 $S$
, and the average MWTP refers only to the same small increment to
 $S$
for every household. No imaginable policy moves every household the same small distance away from their current level of
 $S$
, so this average MWTP is of limited usefulness. Moreover, the average MWTP depends on the sorting equilibrium. This average could differ across samples because the distribution of the amenity differs or because the distribution of household characteristics differs, even if household demand functions for a given set of characteristics are identical in every sample. Chay and Greenstone are undoubtedly correct when they say (Reference Chay and Greenstone2005, p. 381) that “inconsistent estimation of the hedonic price schedule will lead to an inconsistent MWTP function, invalidating any welfare analysis of nonmarginal changes regardless of the method used to recover preference or technology parameters.” It is equally true, however, that Chay and Greenstone are incorrect when they compare their average MWTP estimates to those of other studies without recognizing the potential impact of variation in the distribution of the amenity or in household traits across the samples used in various studies. This problem arises even if the hedonic is linear. As discussed earlier, it is possible to derive a linear hedonic with extreme assumptions, but a linear hedonic cannot be derived from linear bid functions. Thus, the slope of a linear hedonic only indicates MWTP for small increments in the amenity and does not indicate the WTP for meaningful policy changes.
Moreover, even this interpretation does not apply when the hedonic is misspecified. For the reasons given earlier, a hedonic estimated with a single
 $S$
term likely provides a biased estimate of individual MWTP and hence a biased estimate of mean MWTP. Consider the hedonic in equation (13) with a household subscript
 $i$
and differentiate with respect to
 $S$
:
 $$\begin{eqnarray}\text{MWTP}_{i}^{H}=-\left(\frac{\unicode[STIX]{x1D70E}_{1}}{\unicode[STIX]{x1D70E}_{2}}\right)(S_{i})^{\unicode[STIX]{x1D706}_{2}-1}+\left(\frac{1}{\unicode[STIX]{x1D70E}_{2}}\right)(S_{i})^{\unicode[STIX]{x1D706}_{3}-1}.\end{eqnarray}$$
The
 $\unicode[STIX]{x1D706}$
terms are defined after equation (13). A linear hedonic per unit of
 $H$
does not yield the average of this expression over households.
A revealing misuse of the MWTP concept appears in BFM. They draw a linear, downward-sloping MWTP curve for heterogeneous households (Figure 6, BFM). Despite appearances, this curve is intended to illustrate the MWTP of the household that wins the competition for housing at each value of school quality,
 $S$
, not the demand (= MWTP) curve for a single household type. BFM assume that “there are roughly an equal number of students in each school” (p. 620), and they divide the horizontal axis (
 $S$
) into equal-sized segments, each with the same number of households. As a result, they interpret the midpoint of the line as the average MWTP in the urban area. Building on this graph, they conclude that “there is likely to be only a slight difference between the mean preferences estimated in the heterogeneous sorting model and the coefficients of the hedonic price regression” (p. 620).
These conclusions do not follow from their assumptions. Panel A of Figure 2 shows what is required to generate an MWTP figure such as the one in BFM. This figure shows the demand (= MWTP) functions for eight household types. These functions represent the slopes of the bid functions in Figure 1. Based on the BFM “equal number of students” assumption, each household type is assumed to win the competition in the same-sized segment along the horizontal axis. The type with the highest demand function (= relatively steepest bid function) sorts into the locations with the highest
 $S$
, but this quality level is so far down this household type’s demand function that the associated MWTP is relatively low. The MWTP for the household type that wins the competition for the
 $S$
in each segment is indicated by a black diamond. A curve drawn through the black diamonds, which is equivalent to the curve in BFM, shows the equilibrium; the midpoint of a linear regression through these points is the average MWTP.
Although Panel A (Figure 2) looks like Figure 6 (BFM), a closer look shows why the BFM approach is not correct. First, their Figure 6 is inconsistent with their assumed utility function which, as shown earlier, implies horizontal demand (= MWTP) functions and linear bid functions for each household type. Sorting implies that the household type with the relatively steepest bid function (= highest MWTP at a given
 $S$
) wins the competition at the highest
 $S$
. In the BFM figure, the households with the highest MWTP are located at the lowest
 $S$
. Second, a pattern such as BFM’s Figure 6 is not guaranteed, even if demand functions are not horizontal. Panel A shows that it is possible to have an across-household MWTP function that is downward-sloping and approximately linear, but this outcome requires both downward-sloping demand functions (and the implied nonlinear bid functions) and a strong assumption about the distribution of demand function heights across households after sorting. Panel B reveals that a different distribution of demand curves could lead to a nonlinear pattern for MWTP. A linear regression may not accurately estimate the average MWTP in this case.
3.3.2 Difference regressions
Some studies with panel data investigate the impact of the change in an amenity on the change in house values. This approach has the advantage that it can control for time-invariant observable and unobservable factors. Moreover, as discussed in Section 3.2.2, the fixed effects associated with this approach do not introduce demand factors into the analysis. However, the key result about MWTP, namely, that the average slope of a hedonic can be interpreted as the mean MWTP, does not carry over to a change form of the regression. Home buyers in a later period after a change in
 $S$
may have different incomes or preferences than previous buyers. When the dependent variable is the change in log house value over time,
 $\unicode[STIX]{x1D6E5}\ln \{V\}$
, therefore, the coefficient of the change in the amenity,
 $\unicode[STIX]{x1D6E5}S$
, cannot be interpreted as a measure of mean MWTP. This application to changes cannot rely on the assumption of small uniform changes in
 $S$
, but must instead account for actual changes in
 $S$
, which are unlikely to be either small or uniform.
Consider equation (14), which indicates the MWTPH for a single household. Except under extreme assumptions (namely,
 $-\unicode[STIX]{x1D707}=\unicode[STIX]{x1D70E}_{3}=\infty =$
the same linear bid function for everyone and no sorting), the derivative of (14) with respect to time depends on the time derivative of
 $S$
. A change in
 $S$
leads to movement along the demand curve for
 $S$
and hence to a change in MWTPH. It makes no sense to define
 $\unicode[STIX]{x1D6E5}S$
as the key explanatory variable while at the same time assuming that its coefficient, which is a function of
 $\unicode[STIX]{x1D6E5}S$
, does not change. Furthermore, unless the sorting equilibrium does not change, the time derivative of equation (14) is also affected by changes in the
 $\unicode[STIX]{x1D70E}$
parameters, which describe the equilibrium sorting pattern. Note that the problem here is not one of controls; it arises even with double-sales data and house-level fixed effects.
The role of sorting in a change form of the hedonic has been recognized for a long time; see, for example, Bartik (Reference Bartik1988). Some studies, such as Smith, Sieg, Spencer Banzhaf and Walsh (Reference Smith, Sieg, Spencer Banzhaf and Walsh2004), develop elaborate general equilibrium models to account for sorting. This issue is also highlighted in some empirical studies with a discrete change in
 $S$
, such as the studies of school district grades by Figlio and Lucas (Reference Figlio and Lucas2004) and Bogin and Nguyen-Hoang (Reference Bogin and Nguyen-Hoang2014). Figlio and Lucas estimate the impact on house values of grades from a school accountability program in Florida. They are careful not to describe their results as measures of MWTP; instead they just present the impact of an A or B grade on house values. They also explain that the grades might lead to re-sorting and find that the grades influence the school districts that home buyers select. Bogin and Nguyen-Hoang estimate the impact on house values in the Charlotte-Mecklenburg School District (North Carolina) of a failing grade in the federal No Child Left Behind (NCLB) accountability system. They find that the estimated impact in a given neighborhood depends on the demand traits of the people who had moved there based on its underlying school quality as measured by average test scores (which are virtually uncorrelated with an NCLB failing grade).
These interpretation problems go beyond nonmarginal changes and re-sorting, however. Any estimate of average MWTP or average MWTPH is associated with a specific sorting equilibrium. Anything that changes this equilibrium may alter the estimated average MWTP, even if it is not associated with a change in an amenity. Extensive immigration into an urban area, for example, may alter the distribution of household bid functions and hence the average MWTP – an effect that cannot be untangled from the effects of changes in the amenity and re-sorting of the initial households. As explained by Kuminoff and Pope (Reference Kuminoff and Pope2014, p. 1248), for example, “the price function adjusts to clear the market following shocks to the distributions of public goods, preferences, wealth, or technology,” and these adjustments cannot be separated from changes in MWTP for a given amenity when it changes over time. Moreover, the simulations in Kuminoff et al. (Reference Kuminoff, Parmeter and Pope2010) show that the assumption of a constant MWTP over time can lead to large biases in the coefficients of a hedonic regression using panel data.
Paradoxically, one example of misinterpreting results from a change form of the hedonic appears in Chay and Greenstone (Reference Chay and Greenstone2005), who also carefully describe the limits of the average MWTP concept. To be specific, Chay and Greenstone (Reference Chay and Greenstone2005) start with a linear hedonic in which the amenity coefficient,
 $\unicode[STIX]{x1D6FD}$
, varies across households. Then they estimate a change form of this hedonic in which the average value of
 $\unicode[STIX]{x1D6FD}$
“is stationary over time” (p. 393). Using our notation,Footnote
21
 $$\begin{eqnarray}\unicode[STIX]{x1D6E5}\ln \{V_{i}\}=\bar{\unicode[STIX]{x1D6FD}}\unicode[STIX]{x1D6E5}S_{i}+(\unicode[STIX]{x1D6FD}_{i}-\bar{\unicode[STIX]{x1D6FD}})\unicode[STIX]{x1D6E5}S_{i}+\unicode[STIX]{x1D6E5}\unicode[STIX]{x1D700}_{i}.\end{eqnarray}$$
This specification is contradictory; the average MWTP is a function of the distribution of air quality, so changes in air quality over time, which appear in their data, alter the average MWTP. Moreover, their formulation rules out changes in the distribution of MWTP caused, for example, by changes in the distribution of income or re-sorting based on changes in the distribution of air quality across counties. These possibilities are at the heart of the underlying theory and cannot be adequately addressed with an assumption that the key coefficient is “stationary.”Footnote 22
The same hidden assumptions appear in Bajari et al. (Reference Bajari, Fruehwirth, Kim and Timmins2012). They “constrain the marginal effect of pollution on price to be constant over time” (p. 1916). Their claim is that this approach “assists with model identification,” but more to the point, it is inconsistent with the changes in air quality over time, as documented in their Figure 2, and with the possibility of re-sorting.Footnote 23
3.3.3 Border fixed effects or neighborhood fixed effects in a panel
Another interpretation issue comes from BFEs. These fixed effects were made popular by Black (Reference Black1999) and, as reviewed in Nguyen-Hoang and Yinger (Reference Nguyen-Hoang and Yinger2011), have been widely used since then. This approach begins by dividing elementary school attendance zone boundaries into segments. The distance from the nearest boundary is then recorded for each house sale in the sample. A fixed effect for each segment is set equal to unity for all the houses that are (a) within a given distance of that segment and (b) not closer to any other segment. In a regression of house values on elementary school quality, these fixed effects control for unobserved neighborhood effects shared by houses on either side of a boundary segment.
Because houses on either side of a segment face the same average school quality at the district level, the use of BFEs alters the meaning of the regression coefficients for school quality. These coefficients do not capture the impact of school quality generally on housing prices, but instead capture the impact of variation in elementary school quality within a district. The impact of relative elementary school quality and of overall school quality in a district may not be the same.Footnote 24 Households may care little about relative elementary school quality when they know that all students in the district will go to the same middle school and/or the same high school. Alternatively, parents may be eager for their children to get off to a fast start; if so, the within-district elasticity might be higher than the across-district elasticity.
Of course, estimating the impact of within-district variation in elementary school quality on housing prices is a perfectly reasonable thing to do, but this impact is different from the impact of school district quality on housing prices. Adding BFEs is not a correction for omitted-variable bias in estimating the impact of school district quality on housing prices; it is a method that changes the meaning of the regression – while correcting for a certain type of omitted-variable bias in this redefined regression.Footnote 25 The problem is that people using BFEs do not recognize this change in interpretation. Black (Reference Black1999, p. 590), for example, finds that her estimate with BFEs “is roughly half the estimated effect if one runs a simple hedonic regression …. This finding suggests that, if one does not carefully control for neighborhood characteristics, one will greatly overestimate the value of the additional school quality as measured by test scores.” This conclusion is not correct. The simple hedonic regression estimates the average impact of difference in school quality both across and within districts, whereas the regression with BFEs only reflects differences in school quality within a district.
Other studies also fail to recognize the impact of BFEs on interpretation. Kane et al. (Reference Kane, Riegg and Staiger2006, p. 197) say that “With no fixed effects included for boundary or neighborhood …, we estimate a one student-level SD difference in school test scores is associated with a 0.527 log point increase in housing values. Controlling for 84 boundary fixed effects cuts this estimate nearly in half.” BFM (pp. 604 and 605) concludes that
the estimated effect of a one-standard deviation increase in a school’s average test score on the cost of housing declines by nearly 75 percent, from $124 to $33 per month, when boundary fixed effects are included in the analysis. This suggests … that the majority of the observed correlation between test scores and housing prices is driven by the correlation of school quality with other aspects of housing or neighborhood quality.
These statements are also not correct.
In summary, there is nothing wrong with a regression that includes BFEs. The question this regression addresses, namely, the impact of within-district variation in school quality on house values, is worth studying. But it is a different question than the one these studies claim to address. The ability of BFEs to control for unobserved neighborhood traits does not prevent the change in interpretation that is caused by their inclusion. Leaving out BFEs may result in omitted-variable bias,Footnote 26 but including them inevitably changes the meaning of the regression. Thus, the correct interpretation of the results in these studies is that the estimated impact of within-district variation in elementary test scores on house values is considerably smaller than the (possibly biased) estimates of the full variation, across-district and within-district, in test scores.
Similar problems of interpretation arise with neighborhood fixed effects in a panel of house sales not limited to double sales. As explained earlier, a model with neighborhood fixed effects is determining the impact on housing prices of deviations in observable variables from their across-time neighborhood mean. People buying housing may respond differently to the across-time mean value of school quality in a neighborhood than to variation in school quality around this mean. For example, some neighborhoods may have a reputation for excellent schools that is little affected by year-to-year variation in a test-score quality measure. On the basis of their results with tract fixed effects, Clapp, Nanda and Ross (Reference Clapp, Nanda and Ross2008, p. 464) claim that “cross-sectional studies that do not control for unobservable components of neighborhood quality overstate the influence of test scores on property values.” In fact, all they have shown is that in their data, deviations from over-time tract mean school quality have a smaller estimated impact on property values than their (possibly biased) estimates based on all school-quality variation.
4 Evidence
The importance of the hedonic vices described in this paper may, of course, vary from one study to the next. This section provides evidence about the importance of these vices based on a sample of house sales and on a Monte Carlo simulation.
4.1 Evidence from Cleveland
This section explores hedonic vices with the Cleveland data set used in Yinger (Reference Yinger2015b
).Footnote
27
Our analysis focuses on the price of housing in a CBG per unit of housing services,
 $H$
. We use a two-step procedure that appears in Epple et al. (Reference Epple, Peress and Sieg2010) and Yinger (Reference Yinger2015b
).Footnote
28
The first step, which applies to a sample of 23,000 house sales, is a regression of the log of sales price on 17 structural characteristics of a house (including house age, house area, and lot area), 18 variables to measure within-block-group variation in amenities (including commuting distance and distance to a private school), and block-group fixed effects. These fixed effects summarize the impact of all neighborhood traits on sales prices. Complete results can be found in Yinger (Reference Yinger2015b
, Table 1).
Variables in the parsimonious specification.

Notes: All regressions also include the two variables in Table 5. The first five variables appear in quadratic form. An asterisk indicates significance of variable (or pair) at the 5% level in the regression in the second row of Table 5. Some variables are in the original Brasington data set; the remaining were added. The last dummy reflects unique voucher, charter school, or infrastructure programs in these two districts. See Yinger (Reference Yinger2015b ).
Other neighborhood amenities.

Notes: Most of these variables were added to the Brasington data set using the CBG latitudes and longitudes in that data set. For details, see Yinger (Reference Yinger2015b ) and the technical appendix posted at http://faculty.maxwell.syr.edu/jyinger/. An asterisk indicates significance of a variable (or of a quartic in row 1) at the 5% level in the regression in the second row of Table 5.
The second step, which applies to the sample of 1,665 block groups, is a regression of the coefficients of the block-group fixed effects (plus the first-stage constant term) on public services and neighborhood amenities. This dependent variable can be interpreted as the log of the after-tax price per unit of housing services,
 $P^{E}\{S\}$
. As shown in Tables 2–4, the data set for estimating this second step includes public services, neighborhood amenities, and neighborhood-level demand variables.Footnote
29
We focus on the results for two measures. The first is the share of students in a school district who enter the twelfth grade and subsequently pass all five mandated state tests. Students are recorded as not passing if they either drop out before taking the tests or if they fail to pass all five before they graduate. The second is the share of a neighborhood’s population that is Black.Footnote 30 In every case, these two amenity variables (and many others) are entered in quadratic form, so sorting is not ruled out. According to Table 1, this specification corresponds to an infinite demand elasticity and a linear approximation to the sorting equilibrium.Footnote 31
Demand variables.
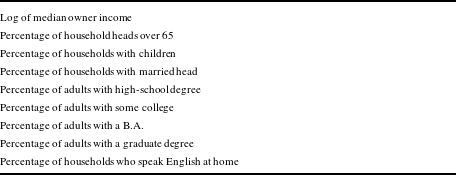
Notes: All variables refer to the CBG. The income variable is estimated based on a regression of census-tract median owner income on tract-level measures of median household income and the percentage of housing units that are owner-occupied. Other variables are from the Brasington data set.
We divide the other public service and amenity variables into two sets. The set in Table 2, which we use in our “parsimonious” specification, consists of the variables that are, in our judgment, basic public service and amenity variables, representing the types of variables included in many previous studies. The set in Table 3, which we add for our complete specification, consists of additional public services and amenities that households seem likely to care about but which are rarely included in hedonic regressions. The regression results for the second step are presented in Table 5 and summarized in Figures 3 and 4. The results in this table use a quadratic specification for the continuous amenities; a linear alternative can be rejected at a high rate of confidence.
Comparison of alternative specifications, high-school passing rate.

Comparison of alternative specifications, neighborhood ethnicity.

In the parsimonious regression, the impact of high-school quality is large (the first two columns of row 1 in Table 5 and Figure 3). However, the results from the parsimonious regression are potentially biased from omitted amenities. Using both sets of amenity controls (row 2) enhances the statistical significance of key variables. Using this preferred model, a house in a district with a 0.77 passing rate sells for about 34% more than one with a 0.13 passing rate.Footnote 32 Adding the demand variables instead (row 3), has a much more dramatic effect, namely, to substantially lower the magnitude and significance of the school-quality variable. If taken at face value, these estimates imply that house value goes up only 12.2% when the district passing rate goes from 0.13% to 0.77%. As explained earlier, however, these estimates should be interpreted as a biased bid-function regression based on extreme sorting assumptions. Adding interactions with income (but, to keep the estimation manageable, not the other demand variables) leads to bid functions that vary with income (row 4, which gives results for the median block-group income). Along this bid function, plotted in Figure 3, the WTP for housing increases 18.8% from the district with the lowest passing rate to the district with the highest passing rate; as discussed earlier, this estimate is subject to endogeneity bias. As shown by the second two columns of Table 5 and by Figure 4, the results for neighborhood ethnicity also depend heavily on specification. The parsimonious regression (row 1 of Table 5 and Figure 4) indicates that house values drop 24.6% as one moves from 0% Black to 74% Black, but also drop 3.6% as one moves from 100% to 74% Black. Because largely Black neighborhoods tend to have poorer amenities, the impact of ethnicity is smaller when additional controls for amenities are added; to be specific, the second row of Table 5 indicates that house values are 20.3% lower at 74% Black than at 0% Black and 2.6% lower at 74% than at 100% Black. These highly significant results are consistent with the survey evidence, which indicates that some people are willing to pay more to live in a largely Black neighborhood than in an integrated or White neighborhood (Yinger, Reference Yinger2014).
School-quality and ethnicity results for alternative house-value regressions, Cleveland, 2000.
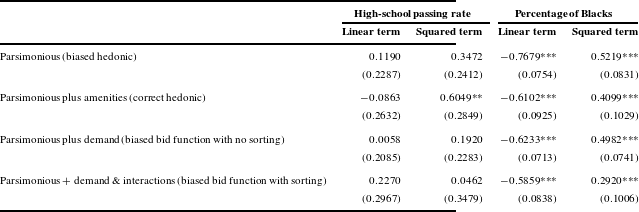
Notes: The dependent variable is the log of
 $P\{S\}$
. The sample is 1,665 CBGs in the Cleveland metropolitan area. The explanatory variables are defined in Tables 2–4. The last model includes interactions between income and four school variables and two ethnicity variables. Standard errors, which are in parentheses, are estimated using the vce(hc3) option in Stata. These results are plotted in Figures 3 and 4. A * (**) [***] indicates statistical significance at the 10 (5) [1] percentage level.
As in the case of the high-school passing rate, adding income leads to an understatement of the amenity effect. The third row of Table 5 indicates that going from 0% to 63% Black (the minimum has shifted) lowers house values by 17.7%, whereas going from 100% to 63% Black lowers them by 6.7% (see Figure 4). Adding interactions between income and both the school and ethnicity variables yields (possibly biased) bid-function estimates. The bid function for the median homeowner income is tangent to the envelope in the second row at 10% Black and declines continuously as the percentage of Blacks increases. Interpreting this estimate as an envelope is obviously a serious error.
Overall, these results are consistent with the view that bid functions, which include demand variables, have different shapes than the envelope. With demand variables (but no interactions) included, the regression is a biased, no-sorting bid-function regression, not a hedonic. More reasonable results can be obtained for a bid-function regression when the required interactions with income are added, but this regression still is subject to endogeneity bias. We know of no instruments to solve this problem.
Under certain assumptions, these results are also consistent with the hypothesis that home buyers are able to determine income and other demand traits at the neighborhood level, consider these traits to be indicators of neighborhood quality, and adjust their housing bids (and hence the envelope) accordingly. These assumptions are that (a) neighborhood and household demand traits are uncorrelated and (b) neighborhood demand traits capture important dimensions of the home buyer’s perceptions of neighborhood quality beyond the neighborhood amenities in Table 3. We find both assumptions to be implausible: Sorting leads to relatively homogeneous neighborhoods, and the amenities in Table 3 cover a wide range of observable, statistically significant neighborhood traits. Scholars who include neighborhood-level demand variables in a hedonic regression should explain why they are willing to make these assumptions.
We also use the Cleveland data to examine how neighborhood fixed effects alter estimated results. In the case of the high-school variable, adding census-tract fixed effects to the parsimonious specification results in an envelope with a negative (but statistically insignificant) slope.Footnote 33 Turning to neighborhood ethnicity, the envelope with tract fixed effects starts and ends at the same place as the parsimonious specification in Figure 4 but is essentially linear. These results do not prove, of course, that these changes in the slopes of the bid functions associated with tract fixed effects reflect the impact of tract-level demand factors. Instead, these results could signify that the tract fixed effects eliminate bias caused by the omission of nondemand tract traits. Nevertheless, these results are consistent with the possibility that the inclusion of tract or other small-area fixed effects introduces inappropriate controls for demand variables. These controls may be measured with error, because they ignore within-tract variation in demand, and they may be accompanied by legitimate controls for nondemand factors, but neither of these possibilities can justify their use. If the coefficients of the tract effects reflect demand factors to a significant degree, a possibility that cannot be ruled out a priori or tested, then the regression is a hybrid somewhere between a hedonic envelope and a set of bid functions – not a true hedonic.
4.2 A hedonic simulation
We conducted simulations to shed further light on the biases that may be caused by a hedonic regression that is misspecified and/or that includes neighborhood-level demand variables. These simulations are based on the forms in equations (10), (11), and (13). As discussed in Yinger (Reference Yinger2015a ), the assumption of one-to-one matching, which is used to derive equation (13), may not be a good approximation to an actual market equilibrium under some circumstances. These simulations therefore indicate possible biases but do not reveal whether these biases arise in any particular market.
Our simulation consists of four steps. The first step is to fill in a table of neighborhoods, each with a unique income and a unique combination of two neighborhood traits, school quality (
 $S$
) and an index of other amenities (
 $A$
). The second step is to create a table of household types, each with a unique combination of relative MWTPH for the two neighborhood traits. The third step is to allocate household types to neighborhoods on the basis of their relative MWTPHs and then to use the winning household’s bids and a random error to define the market price, that is, the hedonic, in each location. The final step is to run several different hedonic regressions using the simulated data and to determine the extent to which the estimated average MWTPH for a given regression provides a biased estimate of the “true” average MWTPH from the simulation.Footnote
34
This approach is similar in spirit to the elaborate, iterative simulation procedures devised by Kuminoff et al. (Reference Kuminoff, Parmeter and Pope2010) and Kuminoff and Jarrah (Reference Kuminoff and Jarrah2010), who build on Cropper, Deck and McConnell (Reference Cropper, Deck and McConnell1988). Our procedures are simpler because we assign a single household type to each neighborhood and because we eliminate the need for iteration by creating neighborhoods with every possible combination of the two amenities. With this approach, households can be allocated according to the standard sorting theorem, which says that households sort across the values of any given amenity according to the relative steepness of their bid function. As discussed earlier, this relative steepness (or, equivalently, relative MWTPH) can be measured by the
 $\unicode[STIX]{x1D713}$
term in equation (10). Without a complete table of the two amenities, a household type with a very high
 $\unicode[STIX]{x1D713}_{A}$
might outbid a household type with a high
 $\unicode[STIX]{x1D713}_{S}$
in a high-
 $S$
, high-
 $A$
neighborhood. In this case, iteration is needed to determine the equilibrium household allocation. With our approach, however, every possible combination of the two amenities is available. Thus, a household type with a high
 $\unicode[STIX]{x1D713}_{A}$
can find a neighborhood with both a high level of
 $A$
and with the level of
 $S$
that is consistent with its
 $\unicode[STIX]{x1D713}_{S}$
. In other words, this household can obtain its preferred level of
 $A$
without having to “overrule” the bid of a household with a higher
 $\unicode[STIX]{x1D713}_{S}$
.
Our approach also differs from Kuminoff et al. (Reference Kuminoff, Parmeter and Pope2010) and Kuminoff and Jarrah (Reference Kuminoff and Jarrah2010) because we focus on housing bids per unit of
 $H$
, not overall bids. As discussed earlier, the standard model in the literature is one in which households sort based on public services and amenities, but not on the basis of the structural characteristics of housing. In the long run, housing services adjust to match the sorting equilibrium, not the other way around. This approach matches the empirical results in the previous section, which look at housing prices per unit of
 $H$
. Measures of WTP per unit of
 $H$
must, of course, be multiplied by
 $H$
before they can be used in benefit-cost analysis. Our simulations would add no insight to this step, however, because they are designed to shed light on an analysis of sorting, not on the determinants of
 $H$
.Footnote
35
Although we switch to a per-unit-of-
 $H$
measure, we follow Kuminoff et al. (Reference Kuminoff, Parmeter and Pope2010) by focussing on average MWTP. This approach is not an endorsement of average MWTP as a welfare measure. Instead, it is based on the idea that average MWTP provides a reasonable way to summarize the extent to which a given empirical approach leads to a pattern of MWTP estimates that differ from the “true” underlying pattern.
One key feature of previous simulations and of ours is that they draw a new set of amenity values for each run. Kuminoff et al. (Reference Kuminoff, Parmeter and Pope2010) implement this step by drawing a new sample of houses including the amenities in their neighborhoods; our approach is to draw neighborhood incomes and associated amenity levels. To obtain the “true” values for MWTP in each run, Kuminoff et al. then average household MWTP across the amenity values associated with that run.Footnote 36 In these simulations, household bids are nonlinear functions of amenity levels, so the average MWTP varies across runs not only because households and bids differ, but also because the calculations are conducted for different sets of amenity values. A better approach, in our view, is to find average MWTP (or, in our case, average MWTPH) across runs for the same set of amenity values. Our objective is to determine bias in estimates of average MWTP, not to determine how estimates of average MWTP vary as amenity levels vary. Kuminoff et al. cannot follow this approach because they do not observe households or MWTP at amenity values other than those observed for a given run. We can follow this alternative approach by making use of the hedonic envelope in equation (13), which indicates the MWTPH at all values of an amenity and therefore can be used to find the average MWTPH for a selected set of amenity values.
In these simulations, bids and hence the hedonic do not depend on neighborhood income. As in an actual housing market, however, neighborhood income is correlated with the level of the amenities. This correlation reflects past sorting and may also reflect amenity choices by voters, as in Epple et al. (Reference Epple, Romer and Sieg2001). Moreover, as shown by equation (10), the
 $\unicode[STIX]{x1D713}$
terms are functions of household income,
 $Y$
, among other things. Because high-
 $\unicode[STIX]{x1D713}$
households sort into high-amenity locations, these simulations (and actual housing markets) are characterized by a correlation between household income (as represented by the
 $\unicode[STIX]{x1D713}$
terms) and neighborhood income. These simulations are designed to determine whether this correlation results in biased coefficients for the amenity variables when neighborhood income is included in a hedonic regression. These simulations also show whether and by how much estimated average MWTPH is biased when the hedonic regression is misspecified. Key parameters for the simulations are based on the analysis of Cleveland area data in Yinger (Reference Yinger2015b
).
Illustrative results from our simulation for the school-quality amenity,
 $S$
, are presented in Table 6. These results describe cases with different price elasticities of demand for
 $S$
; different values for the exponent in equation (12), which characterizes the sorting equilibrium; and different correlations between
 $S$
and neighborhood income, NI.Footnote
37
In all these cases, a quadratic specification provides a good approximation to the underlying hedonic and to the “true” average MWTPH – which is derived using equation (14). Adding NI to the quadratic regressions has little impact on the estimated average MWTPH, and the coefficient of NI is, as theoretically predicted and discussed earlier, usually small and insignificant. This table also shows, however, that a linear specification may yield a severe underestimation of average MWTPH, and that adding NI to a linear regression may boost this underestimation by 40% or more.Footnote
38
Simulation results.

Notes: NI stands for “neighborhood income.” Numbers in parentheses show bias relative to true average MWTPH. We conducted across-run mean-difference two-tailed statistical tests: ∗ = p < .10, ∗∗ = p < .05, ∗∗∗ = p < .01.
These results do not prove that a quadratic form always provides a good approximation to the true average MWTPH, that a linear form always understates average MWTPH, or that adding NI always makes this understatement worse. Nevertheless, these results reinforce two key conclusions of Section 3: (a) linear forms should be met with great skepticism and (b) adding small-neighborhood demand measures to a hedonic, particularly one with a simple specification, may lead to downward bias in estimates of average MWTPH. These results also suggest a procedure for minimizing these problems, namely, to estimate hedonic regressions with quadratic forms, which allow for sorting and appear at least to minimize the underestimate of average MWTP that can arise when neighborhood-level demand variables are included.Footnote 39
In summary, neighborhood-level household demand variables should not be significant when they are added to a hedonic regression that is specified correctly with no omitted variables. In practice, however, these variables may prove to be significant for two reasons. First, they may be either neighborhood traits themselves or proxies for unobserved neighborhood traits. Second, they may help predict prices when added to a misspecified hedonic regression, particularly one that assumes a constant MWTP (or a constant MWTPH – these lessons apply to both concepts). This situation poses a challenge for scholars, because these two possibilities cannot be formally distinguished. Estimating a regression without neighborhood-level demand traits may lead to omitted-variable bias and an associated overstatement of average MWTP, whereas including these variables may result in a severe underestimate of this average. The vast majority of existing studies include neighborhood-level demand variables or small-neighborhood fixed effects while assuming that MWTP is constant. The authors of these studies interpret these results to mean that the demand variables eliminate omitted-variable bias. The analysis in this paper indicates that a more likely explanation is that these demand variables are significant only because the functional form for MWTP is not correct.
Hedonic vices in selected recent empirical hedonic studies.
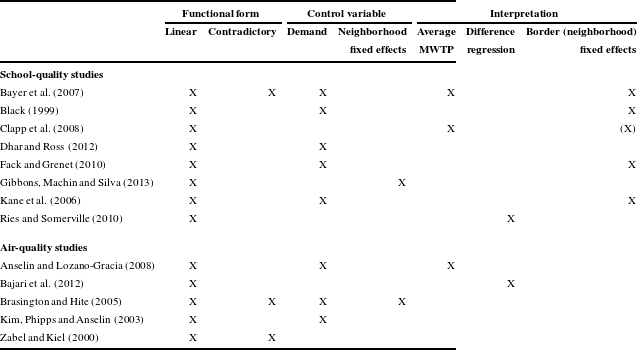
Notes: This table includes all the empirical hedonic articles in the Social Science Citation Index that (a) cover school quality or air quality, (b) were published after 2000, and (c) that were cited at least 10 times. We also include a few articles published since 2010, because it may take some time for a paper to be cited, and selected other well-known papers.
5 Conclusions
The studies reviewed in this paper all make contributions, some of which are important, to the hedonics literature. Bayer et al. (Reference Bayer, Ferreira and McMillan2007) develop a new discrete-choice model of sorting, for example, Chay and Greenstone (Reference Chay and Greenstone2005) develop a new IV method to address problems of omitted variables and to test for sorting, and Bajari et al. (Reference Bajari, Fruehwirth, Kim and Timmins2012) develop an alternative IV procedure to deal with omitted variables. Nevertheless, these studies and the others discussed in this paper have fundamental flaws that undermine the credibility of their empirical work (Table 7) and make their approaches unsuitable for use in benefit-cost analysis, at least not without major revisions.
The research flaws identified in this paper using basic hedonic theory concern issues of functional form, control variables, and interpretation. Our hope is that future research using the hedonic method will build on the strengths of recent studies without any of these hedonic “vices.” Scholars should select functional forms for hedonic regressions that do not rule out sorting and that are consistent with second-step demand estimations; they should recognize that regressions including demand variables as controls may be bid-function regressions, not hedonics, in which case these regressions should include interaction terms and address endogeneity; and they should interpret their results carefully, particularly when comparing their results to those of other hedonic studies or when their regressions include BFEs or when using double-sales data. Once these steps are taken, the new approaches to hedonics will be able to significantly improve estimates of WTP for use in benefit-cost analysis.












