Introduction
The sustainable development objectives of agricultural activities constitute a high priority for agricultural and environmental policies. However, the efficiency of environmental policies may depend on how the producers integrate the environmental objectives in their decision processes. A multitude of factors may influence farmers’ decision processes. For example, the short- and long-term financial constraints (treasury, short- and long-term credit, investment) considerably reduce the productive options of the dairy farmers, and the land pressure restricts the technical options. Among a possible set of options, the farmers could opt for profit, social prestige, well-being (leisure, housing), or even a new agricultural model. Generally, all these objectives coexist at different degrees depending on the financial constraints (they may induce a strong pressure on the farmer, who has to increase his profitability to avoid the risk of bankruptcy), the structure of fixed factors that limit the farming system, the issue of inheritance or the perception of environmental concerns. Therefore, farmers’ decisions are the result of a compromise between adhering to the new environmental objective (e.g. environmental and sanitary standards) and taking advantage of the subsidies without jeopardizing the economic and financial viability of the farm.
Reunion Island, in the Indian Ocean, provides an excellent example of how environmental issues arise in a development scheme. The dairy sector in Reunion Island (which started as a secondary activity in the 1950s) has shown remarkable growth over the last 50 years for three main reasons: (i) institutional and organizational factors (the co-operative was created in 1964 as well as a dairy processing unit in 1972); (ii) policy support for creating infrastructure facilities in the hilly areas, financial support for starting dairy farms, subsidies for milk production; and (iii) the strong will of a group of dairy farmers to develop a remunerative product. In the 1990s, public funding support allowed the development of intensive dairy farms. However, currently, the sustainability of these farms raises new questions in terms of socio-economic development and environmental risk. One of the major environmental damages caused by the dairy sector is soil pollution due to the excessive application of nitrogen (N) to the pastures. Since the end of the 1990s, the decision makers in the Reunion Island have sought measures that may change farmer practices to reduce pollution, without weakening their financial and economic conditions. In this context, different hypotheses were established for formalizing the decision process of farmers and for identifying various ways of creating awareness among farmers about the environmental objectives.
Nitrogen use efficiency and N excess express the farm's resource use and potential environmental impact; these two parameters have been considered as suitable indicators for farm management decisions (Stilmant et al. Reference Stilmant, Fabry, Parache, Lecomte, Koutsouris and Zorini2000; Steinshamn et al. Reference Steinshamn, Thuen, Bleken, Brenøe, Ekerholt and Yri2004). According to these authors, with an increase in N efficiency, farmers maximize the productivity of the imported N (from outside the agro-ecosystem). On the other hand, from the environmental point of view, the ‘best’ system consists of minimizing the N excess per ha. These two objectives (increase of the N efficiency and decrease of the N excess per ha) are not contradictory from the economic point of view. For example, herd genetic improvement may lead to better N efficiency with increase in milk sales and thus export (out of the farm) of higher quantities of N. However, this genetic effect would depend on the whole ‘farm effect’ related to farm management rules for the short term (e.g. feeding practice, manure spreading practice, fertilizer application levels) or for the longer term (e.g. type of housing, choice of crop types) (Nielsen & Kristensen Reference Nielsen and Kristensen2005).
To understand, on the one hand, the complex relations between feeding and livestock management and, on the other hand, the trends of N indicators, a bio-economic model was developed for the dairy sector (Louhichi et al. Reference Louhichi, Alary and Grimaud2004). The model was used to capture the interactive effects between bio-technical management and environmental management related to N balance. However, this model was based on the maximization of an economic function (net income) under resource constraints using linear programming (LP). The realization of environmental objectives, especially the N mitigation objective, was considered as a condition for the sustainability of the system; indeed, the producers often sought solutions that met several objectives. With this in mind, it is proposed to use multi-criteria decision models (MCDM) (Zeleny Reference Zeleny and Zeleny1976; Candler et al. Reference Candler, Fortuny-Amat and McCarl1981; Romero & Rehman Reference Romero and Rehman2003). In the current study, the problem was formalized for a farmer who aimed at both maximizing income and minimizing N excess. Two methods were proposed: (i) goal programming (GP) and (ii) multiple objective programming (MOP). A slight modification of the GP method was also proposed. The objective was to compare different ways of modelling multi-criteria decisions, investigating the problem of N excess mitigation in the intensive dairy systems of Reunion Island. These models aimed at reconciling economic objectives (maximizing income per ha) with environmental objectives (minimizing nutrient excess or maximizing nutrient efficiency).
The transformation of manure into compost for field fertilization appeared as the best technical option. On Reunion Island, the demand for compost in the vegetable and sugarcane sectors is a relevant opportunity for deriving economic value for dairy effluent. This technological option would favour the monetary exchange of N excess and it is promoted by the local dairy co-operative. Therefore, these models were also intended to be used as tools for assessing the best way of controlling dairy effluent without destabilizing the economic and financial adjustment of the different farms.
Materials and Methods
Mathematical programming model
A mathematical programming model was developed for the dairy sector of Reunion Island using the general algebraic modelling system (GAMS). This model integrated a set of bio-physical and agro-climatic constraints that limited the technical options, a set of socio-economic constraints and institutional options (rules of credit access, system of subsidies, etc.) that orient or limit farmer choices. Different constraints were closely linked by casual or conditional relationships. This model was a comprehensive approach to integrate a variety of factors, constraints and internal dynamics to the different productive and economic systems in order to understand the whole farm system. This approach was based on maximization of the farmer's utility function under a set of constraints. The solution provided by the model gave the optimal allocation of resources for the farmer, according to the objectives and considering limited and uncertain information on the available technical and economic options.
In the case of the dairy farming systems, herd and pasture management require a medium- or long-term working calendar, within a planning period of more than 4 years, which is the average productive period of a dairy cow. Additionally, in the planning period, the decisions at a given time depend on previous decisions that modify the system. In order to consider time in the decision process of farmers, a recursive and dynamic model was developed.
Moreover, it was assumed that the farmer did not take decisions that may adversely impact him personally or the farm; a threshold corresponding to the renewal of the farm was set up following Tauer's risk approach (Tauer Reference Tauer1983), named the Target MOTAD approach. The model was formulated as:
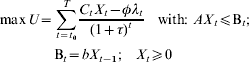
where U is the objective function to be maximized, C t the vector of expected income from productive activities in time t, X t the vector of activities, φ the coefficient of risk aversion according to the Target MOTAD method, λt the sum of negative deviations to an income threshold, T the planning horizon, τ the rate of discounting, A the matrix of technical coefficients and B t the matrix of the available resources that will depend upon decisions taken in year (t−1). The Target MOTAD approach was developed more than two decades ago in order to avoid non-linearity in mathematical modelling. Nowadays it is not commonly used because a number of algorithms are available for solving non-linear problems, in particular quadratic functions, efficiently. For the current study, however, this approach was preferred in order to maintain linearity in view of the size of the model (more than 10 500 equations).
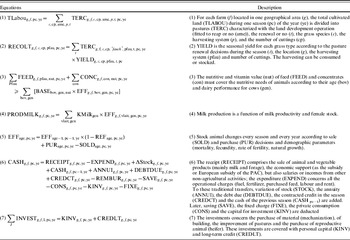
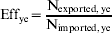
The group of constraints and the model structures are displayed in Table 1. The N efficiency (Eff) for the year (ye) measures the ratio between the quantities of N exported (Nexported) and imported (Nimported) at the farm level, according to the formula:
Main equations of the mathematical programming model

Source: From Louhichi et al. (Reference Louhichi, Alary and Grimaud2004).
Using the usable agricultural area (AA), the annual global N balance residual on the farm called the N excess (NExcess) (in kg/ha/year) can be calculated as follows:

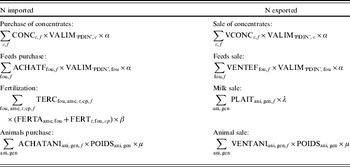
The N balance is described in Table 2 with the details of N imported and exported at the farm level.
Calculation of the N imported and exported at the farm level
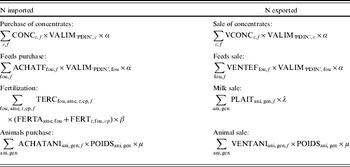
c, type of concentration; f, farm type; fou, type of feed; ame, replacement or not pasture; t, technique of harvest, cp, number of cuttings; ani, animal type according to the physiology stage; gen, potential genetics of animals.
CONC/VCONC, quantity of concentre bought/sold; ACHATF/VENTEF, purchase of feeds; VALIM, PDIN value of foods; TERC, exploited surface; FERTA, fertilization according to whether the pasture is renewed or not at the beginning of season; FERT, fertilization after each cutting according to the exploitation method; ACHATANI/VENTANI, purchase and animal sale; POIDS, weights of animals; PLAIT, milk sale in litres; α, assumed that a MAT unit (total N matter) contains 160 g nitrogen/kg and 0·8 of digestible MAT; β, quantity of nitrogen per kg of fertilizer according to the composition of the fertilizer; λ, quantity of nitrogen per litre of milk (it is assumed 4·5% of protein content in milk and 60·3 g nitrogen per protein content in milk); μ, quantity of imported nitrogen per kg liveweight (it is assumed that 1 kg of liveweight contains 50% muscle to 28% of protein content).
This model was developed and validated with six dairy farming systems, identified among a sample of 36 farms representative of the 150 dairy farms on Reunion Island as highlighted by a factor analysis (Alary et al. Reference Alary, Messad, Taché and Tillard2002). These different farming systems were classified according to initial endowments (land, debts and initial capital, subsidy, etc.), livestock and pasture management, local agro-climatic constraints and personal objectives of the farmers. Calibration and validation of the models were based on a comparison of predicted and actual outcomes (Hazell & Norton Reference Hazell and Norton1986). The results of model validation showed a good representation of reality (Louhichi et al. Reference Louhichi, Alary and Grimaud2004). In order to integrate the different dimensions of sustainability in these systems, especially the environmental dimension, further developments of the model have been tested.
Developments of multiple criteria models
The environmental component of sustainability is closely related to economic and social components. For instance, the N balance is often referred to as an indicator of the environmental sustainability of a system, but it also reveals the economic efficiency of N management in a dairy farm.
One of the easier ways to integrate environmental concerns was to introduce a new constraint into the farm model with an environmental standard, such as a maximum N excess per ha. Using NExcessye, the amount of N excess of the system (kg N/ha/year), and Thresholdye, the standard for N excess (kg N/ha/year), the constraint was formulated as:

However, this formulation did not take into account the integration of environmental objectives in the farmers’ decision process. Therefore different MCDMs were developed.
Goal programming model (GP)
GP, initiated by Charnes & Cooper (Reference Charnes and Cooper1961) and later applied by Lee (Reference Lee1972) and Ignizio (Reference Ignizio1978), aims at resolving the problems comprising several goals to be satisfied. This method allows minimizing of the deviation between the expected levels of each objective, i.e. goals and their realization. Applied to this study objective, it was assumed that the farmer sought a compromise between (1) maximizing income and (2) minimizing N excess. These two objectives were transformed into goals b i (i=1, 2) and incorporated into a GP model. For each goal, it was first necessary to specify the objective values. It was assumed that there were x i,ye activities such that: x 1, ye, purchase of animals; x 2, ye, purchase of concentrate; x 3, ye, purchase of fertilizers; x 4, ye, purchase of fodder; x 5, ye, sale of animals; x 6, ye, sale of fodder; and x 7, ye, sale of milk. Let p i be the price of each item, a i the N intake for each item and AAye the agricultural area. The relative functions for each objective were formulated as follows:
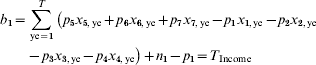

where T income is the annual income target and T nitrogen the N excess target. For each goal, two variables were included: n i (p i) measured the negative (positive) gap between the proposed solution and the value to be satisfied. The principle of this method (GP) is to minimize the deviations from the values to satisfy – in other words, to minimize n i when the objective is to maximize the criteria or to minimize p i when the objective is to minimize the criteria.
In the current study, a variant of the GP model was used: the weighted GP in which the objective (U) used to minimize the sum of deviations was:

If all the criteria were of equal importance in the farmer's decision, the optimum values of deviations n i and p i for α1=αi=αn=1 were calculated. It was possible to analyse the weights or importance of environmental criteria in the decision process by comparing the simulation results with reality. The main drawback of this method is that information related to targets and weights attached to each goal must be provided. Moreover, this technique assumed the existence of an additive and linear multi-attribute utility function (Keeney Reference Keeney1974; Edwards Reference Edwards1977; Huirne & Hardaker Reference Huirne and Hardaker1998; Keeney & Raiffa Reference Keeney and Raiffa2003). The definition of additive multi-attributes functions is: ‘Attributes Y and X are additive independent if the paired preference comparison of any two lotteries, defined by two joint probability distributions on Y∗X depend only on their marginal distribution and not on their joint probability distribution’ (Keeney & Raiffa Reference Keeney and Raiffa2003).
Multi-objective programming methods
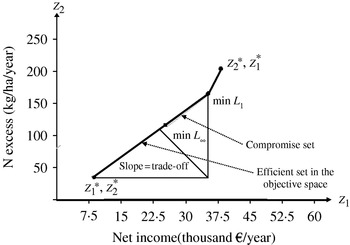
The multi-objective programming (MOP) methods aim at generating a group of efficient solutions that takes into account the multiple objectives instead of generating an optimum solution as with GP (Romero & Rehman Reference Romero and Rehman2003). For generating this group of efficient solutions (Eff z(x)), the formulation is: Eff z(x)=z 1(x), z 2(x) with x∊F and F is the group of possible solutions and z i the objectives such that: (z 1) is the maximized available net income and (z 2) the minimized N excess (Fig. 1).
Representation of the compromise set between the Manhattan solution (L 1) and the Tchebycheff one (L ∞) and the ideal points (z 1*, z 2*) and the anti-ideal points or nadir values (z 1*, z 2*) in the subset of the efficient set in the objective space limited to two objectives: maximizing the net income (z 1), minimizing the N excess (z 2) (from a representation of Romero & Rehman (Reference Romero and Rehman2003) ).

The ideal solution would be to reach the maximum net income when N excess was left out and the minimum N excess when net income was not considered. However, this solution was often difficult or impossible to achieve because of contradictory or conflicting relations between these objectives. The compromise method minimized the distance between this ideal and each point solution (Romero & Rehman Reference Romero and Rehman2003). Thus, the set of compromise solutions minimized this longest geometric distance (Cohon 1978, cited by Piech & Rehman Reference Piech and Rehman1993):
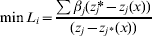
where x is the vector of decisions; z j* and z j* represent the ideal point and the opposite to the ideal point (nadir value), respectively, for the jth objective; z j(x) is the objective function and βj the weight for each objective.
For bi-criteria problems, as the case study proposed, this set was a compromise between the Manhattan solution (metric 1 or L 1) and the Tchebycheff one (metric ∞ or L ∞), as demonstrated by Yu (Reference Yu1973). In other words, a compromise between minimizing the sum of deviational variables and minimizing the largest deviation was sought.
Modified GP method
The modified GP method was the last option explored in the current study. It has been seen that GP minimized the objective function U (Eqn (7)). This formula may be difficult to understand by end-users because of the introduction of p i and n i variables, especially for local agencies such as the dairy co-operative. A slightly modified equation was proposed for the purpose:
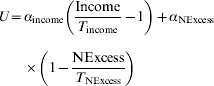
This model was easier to comprehend by the dairy co-operative and can be generalized to an arbitrary number of quantitative objectives. Moreover, the α coefficients were representative of the actual weight of the different criteria (scaling was operated).
Sensitivity analysis
In order to assess the relevance of the different modelling approaches, simulations were performed and the results analysed in terms of net income and N excess. The results were for one specific farm type: a dairy farm of 23 ha (12 ha are managed pastures) with 40 dairy cows. This farm type was representative of the farm model that the dairy cooperative had promoted in Reunion Island. The simulations allowed: (i) different ways of modelling the decision process to be compared and (ii) how modelling of the decision process could help predict the impact of environmental policies to be assessed, according to the technological level of the production sector.
The reference to which the models were compared was the optimization of the income without any N mitigation objective. This reference corresponded to the actual observed value already tested with the LP model (Louhichi et al. Reference Louhichi, Alary and Grimaud2004) without considering N balance issues.
The first model (M1) considered a simple objective (net income) and N excess was constrained to be less than a threshold of N per ha and per year. One of the important steps was to fix the environmental standard for N excess. It was proposed to use the most constraining value for which a solution to the bio-economic model (M1) can be found, where the standard was considered as a constraint. To do that, a series of simulations was carried out where the norm was reduced by 50 kg/ha/year each time and until the model could not find a feasible solution.
The next three models included N excess as an objective: (M2) the GP, (M3) the MOP and (M4) the Modified GP. In all the models, parameters were more or less uncertain. Thus, sensitivity analysis can provide information on: (i) how robust the optimal solution is regarding different parameter values in order to test the robustness of an optimal solution and identify critical values or break-even points where the optimal strategy changes and (ii) how the optimal solution changes in different circumstances in order to understand relationships between the input and output variables. Simulations were performed to test the sensitivity of each model, e.g. measuring how sensitive the optimal basis is to a change in the objective function or in a resource constraint (i.e. the right-hand side of a constraint). Trade-off curves, based on these simulations, were constructed for each model. The sensitivity analysis was conducted for the contrasted models (M3) and (M4). In the Modified GP (M4), this analysis allowed assessment of the sensitivity of the optimal basis to a change in the target values for cumulative N excess and net income in the objective function. In the MOP (M3), the sensitivity analysis allowed assessment of the sensitivity of the optimal basis according to change of N excess and net income in the set of constraints of Eqn (1). The ranges of possibilities issued from the simulations gave information about how much an objective coefficient or a right-hand-side coefficient (resource constraint) can change without changing the optimal basis.
In the simulations with technical innovations, the farmers can transform their manure into compost. However, this composting option is relatively recent in Reunion Island and only a small amount of ‘on-field’ experimental data is available. Different hypotheses were used from the literature (Stilmant et al. Reference Stilmant, Fabry, Parache, Lecomte, Koutsouris and Zorini2000; Lecomte et al. Reference Lecomte, Boval, Guerin, Ickowicz, Huguenin, Limbourg, Roose, De Noni, Prat, Ganry and Bourgeois2004), local station experiments and expert knowledge to approach measurement of technical coefficients. It was calculated that the yearly compost production is around 3 t/livestock unit (LU). The N released from compost application on pasture lands was from 2·1 kg N/t of compost in the first year to 3·5 in the last year of the planning period.
Results
Choice of the N excess standard
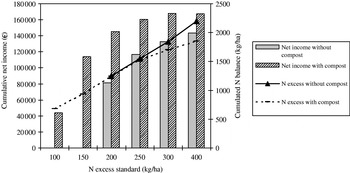
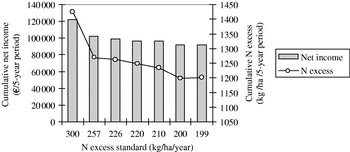
Figure 2 shows the trend of net income and N excess, both cumulated over the 5-year period, according to the allowable maximum value of N excess considered as the standard. As a result of the model output, the link between N excess and net income was non-linear. The simulated N excess tended to follow the increase of the standard (authorized N excess) when no compost was produced. In the case of compost production, the increase slowed down as soon as the standard exceeded 250 kg/ha/year.
Cumulative net income and N excess over the 5-year period according to the value of the N excess standard considered as a constraint in the bio-economical model (M1).

Besides, the empirical analysis of the different N indicators in Reunion Island showed high variations between farms according to farm management, especially feeding practices and fertilizer application levels (Gousseff et al. Reference Gousseff, Grimaud, Tillard, Lecomte and Grimaud2002). The N excess per ha was roughly of the order of 217 (±92) kg/ha/year, compared to 186 kg/ha/year in Northern Europe. The average value of N efficiency (around 0·24±0·11) was comparable to intensive dairy systems of Northern Europe. Nielsen & Kristensen (Reference Nielsen and Kristensen2005) registered a rate of 0·23 for conventional dairy farms between 1997 and 2003.
Considering the empirical and simulation data, the chosen standard was 200 kg/ha/year. This was the most constraining value for which a solution could be found in the (M1) model. This standard is more restrictive than the actual standard fixed by the administration for Reunion Island (which is 300 kg/ha/year).
Comparison of modelling approaches, without technical innovation
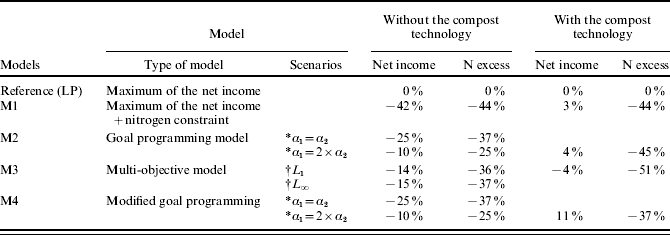
Results for the cumulative 5 years were analysed (Table 3). In every case, the N mitigation objective implied a decrease in cumulative net income over the 5-year period. But there were significant differences according to the chosen model. In (M1), the N excess constraint led to approximately a 40% decrease in both N excess and net income, which would not be acceptable by farmers. The (M2) and (M4) simulations also induced a significant decrease of net income, by about 25% when the net income and nitrogen objectives had the same weight (α1=α2). (M2) and (M4) simulations produced interesting scenarios when the weight of the net income objective was twice the weight of the N excess one (α1=2×α2). The N excess was reduced by 25% and net income was only reduced by 10%. It was observed that the two-fold increase in the weight of the net income criterion in the objective function induced a decrease of net income by a factor of 2·5 (compared to the scenario in which all the criteria were of equal importance in the farmer's decision), while the decrease in N excess was only by a factor of 1·5.
Simulation results on the cumulative net income and N excess over the 5-year period (in % of deviation to the reference) for the different models and with or without the compost technology
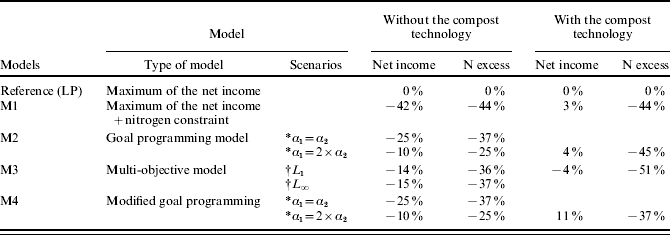
* αi, weight of each criterion in the objective function (α1, net income objective; α2, N excess objective).
† L 1 and L ∞, the Manhattan and Tchebycheff solutions, respectively, of the multi-objective model that delimited the compromise set.
The (M3) simulation seemed to offer a compromise that tended to respect both objectives the best. The N balance was almost at its maximum, while the net income decrease was not.
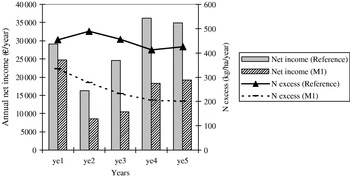
These results aggregated over the 5-year period did not show progressive adaptation of the farmer's behaviour. Figure 3 shows that, in the (M1) simulation, net income never returned to an acceptable level, even though it registered a slow increase after the 3rd year. This increase was explained by a change in feeding practice with the substitution of concentrates with silage and a slow increase in dairy stock (from 44 to 50 animals from the 2nd year to the final year). This suggests that such an evolution would need a longer simulation horizon to assess the final adjustment.
Evolution of the annual net income and N excess for the reference (LP) and the bio-economical model with a constraint for N excess (M1).

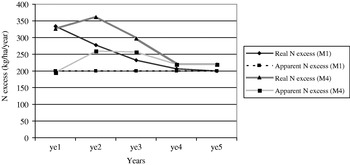
The N excess defined by Eqn (3) induced an ambiguity concerning the usable AA. The usable AA was not necessarily used every year, especially when the herd size decreased. This may lead to an apparent N balance, with the total area as the denominator (Eqn (3)), which respected the standard, whereas the real N balance with the effectively used area as the denominator was higher than the standard. For example, Fig. 4 shows that from year 1 (ye1) to year 3 (ye3) the (M1) simulation produced an apparent N balance equal to the standard, whereas the actual value for the effective surface was higher.
Apparent and real N excess through years for two models: the bio-economical model with a constraint for N excess (M1) and the Modified goal programming (MOP) (M4).

(M1) and (M4) gave contrasting results in terms of net income and implied different advice to policy makers to favour the adoption of more environmental-friendly practices by farmers. Table 3 shows that, in (M1), apparent N balance was constrained to the standard from the 1st year onwards. Nevertheless, the N balance for the effectively used surface was greater than the standard during the first 3 years. In (M4), the adaptation was more progressive but reached the standard within the 5-year period, and without jeopardizing the economic viability of the farm.
Sensitivity analysis of the models
Sensitivity analysis is extremely valuable in taking a decision or making a recommendation. A robust optimal strategy (which is insensitive to changes in parameters) gives confidence in implementing or recommending it. On the other hand, if the optimal strategy is not robust, sensitivity analysis can be used to indicate how important it is to make changes in management to best suit different circumstances.
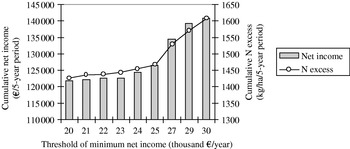
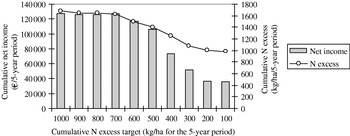
Figures 5 and 6 show the sensitivity of the optimal basis to changes in maximum or minimum values of N excess and minimum net income, respectively, in the right-hand side of the two constraints. One break-even value for N excess (around 250 kg/ha/year) and for the minimum net income (around €25 000/year) were observed, below which the cumulative net income optimal for the 5-year period decreases by 10–15%. Moreover, below 199 kg/ha/year for N excess, no solution can be found. This means that without external changes (such as new technologies or introduction of new feeding management), the farmers cannot find a solution to satisfy the N excess constraint without jeopardizing the economic and financial viability of their farms.
Sensitivity analysis of the optimal solution regarding the cumulative net income and N excess over the 5-year period according to the level of N excess standard in the right-hand side of the N excess constraint in the MOP (M3).

Sensitivity analysis of the optimal solution regarding the cumulative net income and N excess over the 5-year period according to the level of the threshold of the minimum net income in the right-hand side of the risk constraint in the MOP (M3).

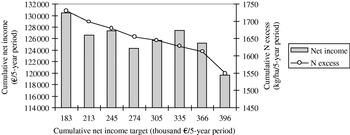
Figures 7 and 8 show the sensitivity of the optimal basis to changes in the target values of N excess and minimum net income, respectively, in the objective function. The objective range in (M4) was larger than the right-hand side range for (M3) and the break-even points were located more at the extreme (around 100 kg/ha/year for N excess and €80 000/year for net income). Surprisingly, the cumulative N excess optimal decreased with increase in net income target and the cumulative net income optimal was quite variable. Therefore the trade-off curve of cumulative net income showed that it would be appropriate to consider all possible solutions with lower N excess and greater net income before formulating recommendations.
Sensitivity analysis of the optimal solution regarding the cumulative net income and N excess over the 5-year period according to the level of N excess target in the objective function in the modified (GP) (M4).

Sensitivity analysis of the optimal solution regarding the cumulative net income and N excess over the 5-year period according to the level of net income target in the objective function in the modified GP (M4).

However, for all models, the integration of an N mitigation objective led to an important decrease in net income that may discourage some dairy farmers. Consequently, technical innovations were much needed to compensate for this loss, especially in the context of liberalization and future reductions in subsidies.
Effect of technical innovations
The treatment and conversion of solid manure into compost was proposed as a technical innovation representative of the technological level of the sector. Table 3 compares the results of the different models with and without composting technology.
The (M1) simulation still induced a 44% decrease in the N excess, compared to the standard, but net income increased by 3%. The (M3) simulation suggested the maximal N mitigation with a slight decrease in income. (M2) results were very close to (M1) (constraint scenario), while results of (M4) showed the maximum increase in income and almost reached the N mitigation objective (stabilizing at a level of 220 kg/ha/year from the 4th year on). These results emphasize the need to introduce new technologies in order to respond to the nitrogen mitigation objective and facilitate the farmers’ adaptation to new environmental concerns.
Discussion
Relevance of MCDMs for testing N mitigation objectives
MCDMs can be useful tools for assessing sustainability in two of its major dimensions: environment and economy. They can also be extended by integrating social externalities or other environmental issues. Firstly, the simulations highlighted the strong interrelations between the N mitigation objective and economic viability. The N mitigation objective can be combined with economically efficient dairy systems. The (M2), (M3) and (M4) models showed that it is possible to find various solutions to reach economic and environmental sustainability. Each of the models represented a different view of the decision-making process of the dairy farmer.
The MOP method evolved from the idea that the farmer would be aware of the best individual solution (ideal value) for each criterion. An attempt was then made to find a solution that would be the closest to each individual expectation. This method proposed a compromise that would best respect both criteria. However, straightforward weighting of these criteria was not always achieved. The GP methods were based on the assumption that the farmer may try to optimize several objectives together and to weigh them according to his priority system. As the scaling of variables occurred before the optimization, this method allowed easier modulation of the weights of the different objectives. GP methods also require that the farmers define targets for each criterion. These targets may result from external recommendations or from personal expectations related to environment perception or personal circumstances. Moreover, these GP methods assume the existence of an additive and linear multi-attribute utility function. In fact, this assumption is difficult to justify in the context of joint production systems that are non-independent.
The method developed in the current study (M4) seemed to allow greater deviations from the target values, and consequently led to the exploration of a larger number of possibilities. Contrary to the (M2) model that minimized only negative deviations (n i) for objective maximization and positive deviations (p i) for objective minimization, the (M4) model integrated the positive and negative deviations for each objective in the objective function. This meant that this model accepted more deviations over the 5-year period.
These differences explain the different results obtained. The GP methods were very sensitive to the weighting of each objective although the MOP method looked for a compromise that could be found with a specific weighting. In this sense, the MCM allowed exploration of a set of solutions that induced different recommendations in terms of policies. Moreover, the sensitivity analysis may help decision makers to elaborate recommendations in terms of the N mitigation objective by analysing the trade-off between the different objectives.
These methods are illustrated in the study with a bi-dimensional objective function, but the approach remains relevant whatever the number of attributes be. Even though further improvements in these models are possible, they can help in understanding the decision processes of farmers and with the elaboration of recommendations to policy makers.
Technical and economic results and policy advice
The model has been used in order to analyse how public policies could regulate the environmental externalities considered, trying to find the best way of controlling dairy farm effluents. In the first set of simulations, the technical alternative, namely composting, was not available. The enforcement of the standard (kg N/ha) led to a dramatic decrease in income. This would probably lead farmers to give up dairying. The GP methods proposed insufficient solutions according to environmental criteria but acceptable solutions for the set of criteria (environmental and economic together). Although the standard was not achieved, the N excess was 25% lower and induced a decrease in income of 10% only. When no particular technical alternative was proposed, complying with a restrictive standard without jeopardizing productive activity appeared to be very difficult. In this case, an extension service for creating awareness among farmers about N pollution could be insufficient.
In the second set of simulations, the farmers may transform their manure into compost and retail it. The difference between transformation costs and selling prices was €8/t (estimate made by the local dairy co-operative). In this situation, the standard appeared more acceptable for farmers, and the (M4) simulation even showed an increase in income. Surprisingly, the results of the (M1) and (M2) simulations were very similar. Therefore, adequacy between the standard and the technological level of the concerned activity may be more important than the way the standard is introduced. If there is an acceptable alternative, the standard may be respected, whether it is imposed or promoted. Without any technical solution, the standard may endanger the economic viability of the system.
In both the cases, the best results were obtained when the priorities of the producers included the recommendation of the standard. This may be achieved by initiating a dialogue between the professionals and the policy makers and by taking into account the priorities of both parties on environmental concerns. These models could be used as tools to discuss the feasibility of different alternatives or to negotiate a local norm of N excess that does not jeopardize the economic viability of the dairy sector. Nevertheless, without incentives, this dialogue may be insufficient for dairy farms which have not achieved economic stability. In the current study, the compost processing technology was suitable as there was a high demand for this product at a remunerative price. This assumed a fair trading situation, especially the adjustment of subsidies for imported organic and mineral fertilizers.
In terms of policy advice, the model raises two major issues. Firstly, supporting the emergence of technical alternatives, i.e. supporting professional organizations, research and development in their innovation processes, is a key for achieving the sustainability. The definition of a standard should not be static and must be relevant to the technological level of the concerned production chain. Secondly, the emerging technologies can be useful only if there is no trade distortion to the benefit of the traditional technology.
The model does not yet provide a quantification of the social benefits of technical innovation. The decrease in bad odour caused by the manure and the general improvement of the image of dairy farming have an impact on the economic relevance of the production system. With improved production systems, a new generation of farmers may be attracted to the dairy sector and this would lead to socio-economic and environmental sustainability of the whole production channel.
Further developments
In conclusion, the current study proposed original means of modelling the decision-making processes of farmers. The different MCDMs reflected different ways of representing the decision processes of the farmers: the GP implied that the farmers consider some targets, while the MOP model implied that farmers sought a compromise between different objectives. The simulations highlighted the necessity to adapt the standards to the technical level of the local farming systems concerned in order to initiate a change in the practices, without jeopardizing the entire local dairy sector.
It would be interesting subsequently to use these models positively to analyse which model is most suitable to simulate farmer behaviour by comparing the results obtained with actual situations. At the time of the study, it was not possible because of the recent emergence of awareness about environmental aspects of the dairy sector.
Adaptation of the standard requires a real dialogue between producers, extension agents, researchers and policy makers. The purpose of the model was to support this dialogue, by supplying tools to help ‘qualify opinions’ and to make the participants concerned grasp the complexity and multi-dimensional aspects of sustainability. A user-friendly interface was developed in order to make this dialogue easier. Development of further models at the regional level has been a response to the multi-scale stakes of sustainability, from the farm level up to the territory. In fact, the transfer of nutrients between lowland sugar cane areas and highland farms could be a major stake of the sustainability of both production sectors at a regional level. The sugar cane sector requires large quantities of fertilizer and produces carbonated organic by-products usable as litter by the dairy sector. The dairy sector produces valuable fertilizer.
The current research highlighted the relevance of MCDM for analysing public policy impact and for helping policy makers determine the best ways of mitigating environmental externalities without jeopardizing the economic and financial viability of the concerned agricultural sectors. In further research, the MCDM could also be relevant for analysing the farmer behaviour regarding the challenge of sustainable development.
This research study has been carried out within the CIRAD-Livestock Pole in Reunion Island. We particularly thank the director of the dairy co-operative (SICA Lait), Y. Evenat, the technicians (J. Lepetit and C. E. Bigot), the farmers and members of the research team from CIRAD Reunion Island for their participation in the discussions.