INTRODUCTION
The olive (Olea europea L.) is native to the coastal areas of the eastern Mediterranean basin. These include south-east Europe, west Asia (including northern Iraq and northern Iran) and north Africa. For several thousand years the olive has been grown in the region surrounding the Mediterranean, mainly as a rain-fed crop. It is referred to several times in both the Bible and the Quran. Traditionally, the leafy ‘olive branch’ is known as a symbol of abundance, glory and peace, while olive oil has long been considered sacred.
Currently, Spain has the largest area (2.09 million ha), and is also the largest producer of table olives and olive oil (total 8.01 million t). It is followed by Italy (1.19 million ha; 3.17 million t), Greece (0.83 million ha; 1.81 million t), Morocco (0.74 million ha; 1.48 million t) and Turkey (0.83 million ha; 1.41 million t). Tunisia has a large area of olives (1.65 million ha), but low productivity (0.88 million t) due to dry conditions. The largest producer in South America is Argentina with 56,000 ha of olive yielding 170,000 t, while the United States with 14,000 ha produces 186,000 t. Of the estimated total of 9.5 million ha of olive orchards in the world today (producing 20.8 million t), two-thirds (6 million ha) are still to be found in the Mediterranean region (FAO, 2012).
The vast majority of olives (over 90%) are grown for oil. This is used in catering and also in the textile industry, in cosmetics and in pharmacy. The trees also provide beautiful wood for carving. They can live for many hundreds of years, and will remain productive if managed well. The waste products after processing for oil are now being considered as a possible source of renewable energy. But, it is the expansion of olive oil production for culinary purposes, driven by health-related benefits, which is now boosting the industry. For centuries, olive oil has been treasured in Greece and other Mediterranean countries for its healing and nutritional properties because of its high levels of monounsaturated fatty acids and polyphenolic compounds (Hu, Reference Hu2003). This expansion is being achieved through both an increase in the planted area and also through intensification (within and beyond the Mediterranean countries), notably by changing from rain-fed to irrigated cropping systems, and by increasing the tree density. Intensification of table olive production began about 150 years ago, but it is only in the last 40–50 years that a more intensive approach has been adopted by the olive oil sector (Barranco et al., Reference Barranco, Fernández-Escobar and Rallo2010).
Although olive is considered to be drought-resistant, it responds well to irrigation. Interestingly, recent bio-archaeological evidence has shown that the olive was being irrigated during the Middle Ages (9th–15th centuries) in southern France and northeastern Spain (Terral and Durand, Reference Terral and Durand2006). In the last 15 years, the area of olives irrigated in Spain has increased from 200,000 ha to more than 400,000 ha, making it the main irrigated crop in that country (Villalobos et al., Reference Villalobos, Perez-Priego, Testi, Morales and Orgaz2012). This has been stimulated in part by the introduction of drip irrigation, but a scarcity of water means that using water to irrigate olives must be justified by good evidence of economic benefits. To this end, recent research has focused on quantifying the yield responses to irrigation and, in particular, identifying the minimum amount of water required, rather than targeting maximum yields per unit area.
Plant densities have generally been increased from 100 trees ha−1 or less up to around 500 trees ha−1, but there are also an estimated 100,000 ha of more densely planted orchards worldwide, where the trees are grown in hedgerows at densities of 1000–2250 trees ha−1. These hedgerow trees can be harvested mechanically, but pruning is essential (Pastor et al., Reference Pastor, García-Vila, Soriano, Vega and Ferere2008). A survey of olive growers in California, where olive oil production is expected to become a major agricultural commodity, revealed that there were about 4900 ha planted at densities between 1100 and 2240 trees ha−1 by the end of 2008. With one exception, all these growers used drip irrigation (Flynn and Mondavi, Reference Flynn and Mondavi2009).
New countries are now joining the olive industry. For example, New Zealand is looking to expand the production of high-quality, boutique-style oil for the export market. Currently, it is a very small producer (c. 250 ha). New olive orchards are being planted in marginal areas (alongside grapes) on light, free-draining soils. Irrigation is being applied to supplement low summer rainfall, but as elsewhere there is competition for the available water resources (Greven et al., Reference Greven, Neal, Green, Dichio and Clothier2009). The olive industry is also expanding in Australia, from virtually nothing in 1995 to 30,000 ha (71,000 t) in 2010 (Mailer and Ayton, Reference Mailer and Ayton2011). Connor (Reference Connor2005) has questioned the ‘transferability to Australian conditions of the information on olive physiology and adaptation that has accumulated in the Mediterranean countries’. Because the majority of the olive orchards in Australia are irrigated, the considered answer from Connor himself was ‘relatively little’.
Because of the problems associated with water scarcity in nearly all the countries producing olives, a large number of (deficit) irrigation experimentsFootnote 1 have been carried out in recent years in Spain (Ruiz-Sanchez et al., Reference Ruiz-Sanchez, Domingo and Castel2010) and elsewhere. Concurrent research has been directed at understanding how the olive responds and adapts to water stress. This activity has led to a proliferation of publications. In this paper, the results of selected experiments are summarised, and an attempt is made to draw generic conclusions. Starting with a description of the stages of development (including roots) of the olive in relation to water availability, this paper reviews plant water relations, water requirements, water productivity and irrigation systems. A similar format has been used in previous published reviews in this series on other fruit crops, including banana (Carr, Reference Carr2009), coconut (Carr, Reference Carr2011), citrus (Carr, Reference Carr2012a) and pineapple (Carr, Reference Carr2012b).
Several excellent reviews on water-related topics specific to the olive have been published, including one on its water use (Fernández and Moreno, Reference Fernández and Moreno1999), its capacity to adapt to dry conditions (Connor, Reference Connor2005), the physiology of yield development (Connor and Fereres, Reference Connor and Fereres2005), and the yield response to water (Fereres, Reference Fereres, Steduto, Hsiao, Fereres and Raes2012). Reference is made to all of these reviews here. In addition, there are two textbooks worthy of mention. The one by Therios (Reference Therios2009) covers all aspects of olive culture, while the second focuses, almost entirely from an Australian perspective, on the production and processing of table olives (Kailis and Harris, Reference Kailis and Harris2007).
CROP DEVELOPMENT
Commercial production of olive is possible throughout the warm temperate regions and especially in the dry subtropical or Mediterranean regions between latitudes 30° and 45°. Land adjacent to the Mediterranean Sea with its dry summers, mild winters (temperatures not less than –8 to –6 °C for any length of time) and proximity to the sea (to protect trees from excessively high or low temperatures) is particularly suitable. Most commercial cultivars require a period of low temperatures to induce flowering (about 10 weeks with mean air temperatures below 12 °C). This prerequisite is known as the chilling requirement. The tree will grow but not fruit in the tropics.
Olive is successfully cultivated without irrigation in areas where the average annual rainfall is >600 mm, but can survive with as little as 200–250 mm (Fereres, Reference Fereres, Steduto, Hsiao, Fereres and Raes2012). Olive growing has recently expanded, for example, into dry areas in northwestern Syria (Khanasser Valley, 35°49′N 37°29′E) where traditional barley–sheep farming systems prevail and the annual rainfall is only 200–300 mm. Enterprising farmers looking to diversify their incomes planted olive trees in the valley. A water harvesting trial was established in 1999 and planted with a local, drought resistant cultivar (Qaisi) on overgrazed, degraded, stony ground at the foot of sloping land. Tree growth was monitored over three years (2003–2005), when the annual rainfall averaged 208 mm, and the annual potential evapotranspiration rate (ETo) was 1850 mm. Two to three rounds of irrigation (total 200–400 L tree−1) were applied during the summer months (July to September) and these were supplemented by rainwater harvested (from run-off) during the rainy season (from October to May). The average annual depth of water ‘harvested’ from the micro-catchments (50 m2 in area) was equivalent to 271 mm of rain. (The ratio of the area of the micro-catchment to the area of the tree basin was c. 32:1). The study confirmed that it was possible, with innovative rainwater management, to produce olives in arid areas on relatively shallow soils (up to 0.90 m deep) with little or no formal irrigation (Tubeileh et al., Reference Tubeileh, Bruggeman and Turkelboom2009).
Vegetative
The olive is a xerophytic evergreen tree that can attain a height of 8–15 m but under cultivation it is kept at 4–5 m by pruning. The small, silvery-green leaves are thick and leathery with a waxy upper surface. The lower surface is protected by a mass of peltate hairs with numerous, sunken stomata (at densities of 420–540 stomata mm−2) with small openings (c. 11 × 5 μm). Cultivars differ in the morphological and structural leaf adaptations to protect against water loss. This does not mean that the olive tree will not respond to irrigation, only that it is adapted to withstand drought (Bacelar et al., Reference Bacelar, Correia, Moutinho, Gonçalves, Lopes and Pereira2004; Beede and Goldhamer, Reference Beede, Goldhamer, Ferguson, Sibbett and Martin1994; Hendrickson and Veihmeyer, Reference Hendrickson and Veihmeyer1949). A detailed review of the photosynthetic processes (C3 pathway), at the leaf and canopy levels, has been prepared by Connor and Fereres (Reference Connor and Fereres2005). The optimum temperature for net photosynthesis is about 28 °C.
The rate of expansion of the tree trunk is particularly sensitive to water stress. This sensitivity increases as the tree ages. Branch length is also sensitive to water stress in both young and mature trees. This means that the number of leaf nodes (which are where the flower buds form) is reduced. The amount of fruit on a tree also influences vegetative growth. For example, in the early years after field planting especially, a large fruit load will reduce both trunk and canopy expansion rates (Martín-Vertedor et al., Reference Martín-Vertedor, Rodríguez, Losada and Castiel2011a). The length of time it takes for a tree canopy to develop depends in part on how the soil surface (whether it is cultivated or not) and any understorey vegetation (weeds, pasture or intercrops) are managed. There is always a risk of soil erosion on sloping land when the area between trees is cultivated. But in a rain-fed orchard the risk of water stress increases with the size of the crop canopy (Connor, Reference Connor2005; Fereres, Reference Fereres, Steduto, Hsiao, Fereres and Raes2012; Martín-Vertedor et al., Reference Martín-Vertedor, Rodríguez, Losada and Castiel2011a; Villalobos et al., Reference Villalobos, Orgaz, Testi and Fereres2000).
Flowering
Flowers are born on inflorescences that, following a period of winter dormancy, develop in the spring from buds in the axils of leaves formed on wood produced during the previous year. The terminal bud on a shoot is nearly always vegetative. The flowers are either ‘perfect’ hermaphrodite, containing both male and female parts, or ‘imperfect’ staminate, capable of only producing pollen. In a controlled water deficit experiment, Rapoport et al. (Reference Rapoport, Pérez-Priego, Orgaz and Martins2011) found that water stress during winter dormancy had no lasting effect on the flowering process, recovery being rapid on re-watering. Water stress during inflorescence development reduced the number of inflorescences, the number of flowers and the number of imperfect flowers, and inhibited ovule development. Water stress during flowering and initial fruit set (spring and early summer) caused flowers to dry and abscise as a unit, exposing senescent stigmas, which were no longer receptive to pollination. The flowers are largely wind pollinated, but less than 2% of the flowers set fruit.
Fruiting
The fruit is a small drupe. It contains a single seed, known as a pit (USA) or stone (UK), which develops from at least one of four ovules present in the ovary. Fruit numbers are reduced when there are fewer flowers and/or fertilization is inhibited. Increased size of individual fruits may not always compensate for any reduction in fruit number (Rapoport et al., Reference Rapoport, Pérez-Priego, Orgaz and Martins2011). Connor (Reference Connor2005) proposed a three-part explanation for successful oil production under severe water stress in Mediterranean environments. First, during the early stages of olive fruit formation (lasting about eight weeks) the tree can tolerate moderate water stress (pre-dawn leaf water potentials between –2 and –3 MPa) without much reduction in its potential to accumulate oil. Second, during the later stages of fruit development, carbon fixation by the fruit itself, together with the inherent capacity of the olive tree to use water efficiently, sustains limited growth, enabling the fruit to survive. Third, following rain in the autumn, the tree water status recovers rapidly, and substantial quantities of new assimilate are produced (when even previously ‘wrinkled’ fruit will recover). It takes about 15–18 months from flower bud initiation to fruit ripening, including four to five months for fruit filling. The pulp to pit ratio is an important quality criterion for both table and olive oil fruit (Connor, Reference Connor2005).
The components of yield for olive oil can be summarised as follows:
 \begin{eqnarray*}
{\rm Oil}\,{\rm yield}\,({\rm kg}\,{\rm tree}^{ - 1} ) &=& {\rm Number}\,{\rm of}\,{\rm fruits}\,({\rm tree}^{ - 1} )\; \times \;{\rm Mean}\,{\rm fresh}\,{\rm fruit}\,{\rm weight}\,({\rm g}) \\
&&\times\, {\rm Oil}\,{\rm content}\,(\% \;{\rm fresh}\,{\rm weight})\; \div \;1000 .
\end{eqnarray*}
Irrigation may increase the fresh weight of an individual fruit, but may reduce the oil concentration of the mesocarp, which depending in part on the cultivar may result in a reduction in the oil yield. Oils accumulate during the late summer and autumn. The final oil content also has implications on the costs of processing. For table olives, fruit size is important. A reasonable commercial yield of fresh fruit from a rain-fed crop is 2–5 t ha−1 and from an irrigated crop 12–15 t ha−1 (averaged over two years, to allow for on–off syndrome, see below). Oils from irrigated orchards are usually less bitter and pungent than those from rain-fed areas (Fereres, Reference Fereres, Steduto, Hsiao, Fereres and Raes2012).
Fruits are distributed irregularly in the canopy. They are formed preferentially on the illuminated sides of the canopy, namely the top and southern sides in the northern hemisphere. Pruning practices in an olive orchard are designed to allow light to penetrate into the canopy and to promote fruiting sites (Barranco, et al., Reference Barranco, Fernández-Escobar and Rallo2010). The design of hedgerow systems to facilitate mechanisation, while optimising the interception and distribution of incident solar radiation over the canopy, has been the subject of detailed research by Connor (Reference Connor2006) and Connor et al. (Reference Connor, Gómez-del-Campo and Cornas2012).
Olive has an alternate bearing pattern whereby fruit production fluctuates between large and small yields in alternate years. These are often called ‘on’ and ‘off’ years. Cultivars differ in the degree to which biennial bearing occurs. As fruits are formed on last year's wood, excess vegetative growth in one year can lead to a high fruit yield the next, but less vegetative growth (because of competition for assimilates). This, in turn, means a low yield in the following year. In this way biennial bearing is initiated. The issue is further complicated when mature trees are pruned to reduce vegetative growth. Without management interventions the ‘yield ratio’ (ratio yield in ‘on’ years to that in ‘off’ years) can be as much as 10:1 (Martín-Vertedor et al., Reference Martín-Vertedor, Rodríguez, Losada and Castiel2011a).
Roots
Little research into the root distribution and root activity of olive trees has been reported. In general terms, Fereres (Reference Fereres, Goldhamer, Sadras, Steduto, Hsiao, Fereres and Raes2012) described the root system of olive as being ‘extensive and vigorous’, with most roots found in the top 1 m of soil, although they can extend to depths of 2–3 m in deep alluvial soils. In California (USA), Hendrickson and Veihmeyer (Reference Hendrickson and Veihmeyer1949) recorded water extraction by roots of unirrigated olive trees (cv. Manzanillo; 25-year old, spaced 9.1 × 9.1 m or 120 trees ha−1), growing in a sandy loam soil, from depths of at least 1.8 m.
Apart from observations such as these, very little systematic research on the actual distribution and dynamics of the root system of the olive tree appears to have been published. Exceptions include a detailed investigation by Fernández et al. (Reference Fernández, Moreno, Cabrera, Arrue and Martín-Aranda1991) in Spain. They traced roots of previously unirrigated, 20-year-old trees (cv. Manzanillo) to depths of 2 m and at distances of more than 2.5 m away from the trunk (trees spaced 7 × 7 m, sandy loam soil). Root densities with drip irrigation were recorded, but the data, as presented, are not easy to interpret or summarise. The greatest root density occurred in the wetted areas, down to a depth of 0.6 m, the most abundant being roots with a diameter <0.5 mm. Root length densities were also monitored in three commercial orchards in north-west Argentina in relation to different drip irrigation emitter arrangements. Approximately 70% of the root system (cv. Manzanillo) was concentrated in the 0–0.50 m (sandy) soil layer, and most of the roots were within 0.50 m of the drip line. The total root length per unit leaf area averaged 1.8–3.5 km m−2 across the three sites (Searles et al., Reference Searles, Saravia and Rousseaux2009). This research was done in an area with very low rainfall so that the soil away from the influence of the emitters was dry, which explains why there were so few roots outside the wetted zone.
A recent paper by Polverigiani et al. (Reference Polverigiani, Lodolini and Neri2012) describes the results of observations made in a rhizotron (a glass window 0.8 m deep and 1.3 m wide, situated 0.5 m away from the trunks of four drip-irrigated trees) over a 10-month period (November 2007 to August 2008) in central Italy (43°29′N 13°07′E). Root growth (extension) continued throughout the winter (November to mid-March). The growth of very fine (<0.2 mm) roots peaked in February, and fine roots (>0.2 mm), to a lesser extent, in April/May. (For the same mass, very fine roots have 1.55 times the surface area of fine roots). During the summer, from mid-June to late August, root growth virtually ceased. At this time, the average daytime temperature was 25.4 °C, shoot extension was rapid and the fruits were expanding and ripening. Both shoot and root processes were competing with the roots for assimilates. Root mortality was first observed in late April, peaking in May. Mortality declined with increase in soil depth.
The proportion of the total biomass partitioned to the roots has been estimated to be about 0.26–0.30 (Connor and Fereres, Reference Connor and Fereres2005).
Cultivars
There are at least 2000 recognised olive tree cultivars, but only a few are grown on a large scale (Barranco et al., Reference Barranco, Fernández-Escobar and Rallo2010). The ones listed in Box 1 have been the subject of research summarised in this paper (see FAO, 2005; Oliveaustralia, 2012 for details).
Summary: crop development
1. The olive is an evergreen, xerophytic tree, well adapted to survive dry conditions. Stomata are only found on the lower surface of leaves.
2. Commercial production of olive is possible throughout the warm temperate regions and especially in the dry subtropical or Mediterranean regions. The olive is responsive to irrigation.
3. For successful cultivation the minimum average annual rainfall needed is about 600 mm. Olives can survive with 200–250 mm. Rainwater harvesting is an alternative to formal irrigation.
4. A period of low temperatures (c. 10 weeks at less than 12 °C) is required to induce flowering.
5. Flowers are born in the spring on inflorescences that develop from buds in the axils of leaves formed on wood produced the previous year. Less than 2% of flowers set fruit.
6. It takes from 15–18 months from flower bud induction to fruit ripening.
7. The olive tree is prone to biennial bearing, which complicates experimentation.
8. There has been little research reported on root systems of the olive tree, but roots can extend to depths of at least 2 m: root growth virtually ceases during the summer.
PLANT WATER RELATIONS
Olive leaves are well designed to control water loss. Morphological characteristics allow minimum radiation load (small size, high reflectivity and dominant vertical display) and maximum heat exchange, while the stomata, which are covered by a dense network of trichomes, provide a very effective control of transpiration (T) (Connor, Reference Connor2005).
Additional safeguards that protect the olive tree against the adverse effects of drought include the following:
Olive cultivars referred to in the text (abstracted in part from oliveaustralia (2012) and FAO (2005))
• Arbequina: Commonly grown in north-east Spain, good for eating and for oil.
• Barnea: A modern, dual-purpose cultivar, bred in Israel.
• Chemlali de Sfax: Grown for oil, from north Africa; very popular in Tunisia.
• Coratina: Grown for oil, popular in Italy.
• Cordovil: Table olive, popular in Portugal.
• Frantoio: Grown for oil, popular in Tuscany, Italy.
• Kalamata: A large, black table olive from Greece.
• Koroneiki: A small olive, source of high-quality oil, from Crete, Greece.
• Leccino: Widely grown for oil, originated in Tuscany, Italy.
• Manzanillo: Widely grown, large purple green olive, rich taste, prolific yielder, from southern Spain.
• Meski: Grown for the table, popular in Tunisia.
• Morisca: One of the most important cultivars in south-west Spain and Portugal; it is very biennial (bearing fruit in alternate years); it is also very vigorous, producing excessive vegetative growth, which is controlled by pruning.
• Muhasan: Grown on a wide scale in Israel, Palestine and Jordan under both irrigated and dry land conditions; prone to biennial bearing.
• Picual: One of the most widely cultivated table olives in Spain.
• Picholine: Grown in the south of France, green fruit.
• Proline: Sensitive to salinity.
• Qaisi: Drought-tolerant, from Syria.
• Sevillano: High-quality table olive; takes second place to Manzanillo in both Spanish and Californian table markets.
• Verdale: From the south of France; found in many different forms around the world. Popular in Australia.
• Narrow xylem vessels with low hydraulic conductivity reduce risk of embolism (cavitation created from micro-bubbles).
• Osmotic adjustment allows a positive pressure (turgor) to be maintained in the cells.
• Abscisic acid (a phytohormone) may play an important role as an endogenous messenger influencing the response of the tree to drought.
• Aquaporins (proteins) may facilitate the flow of water across cell membranes by increasing their hydraulic conductivity.
• Proline (an amino acid) is an important component of the response mechanism of the olive to water stress.
• In addition, the following attributes of the leaf all contribute to the protection against water loss: low water content when a leaf is saturated, large wax content that increases diffusion resistance of the cuticule, specialised cells at the base of the peltate (trichome) stalks and the dense packing of mesophyll cells (Fernández et al., Reference Fernández, Moreno, Girón and Blázquez1997; Sebastiani, Reference Sebastiani2011).
The results of some of the many recent experiments on the water relations of the olive are summarised below under the subheadings: plant water status and gas exchange, trunk diameter variability (TDV), and osmotic regulation. Each country where research is undertaken is considered in turn, beginning with Spain, the lead country, under these headings, followed by the other countries in alphabetical order.
Plant water status and gas exchange
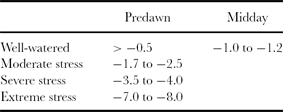
The leaf (or stem) water potential is commonly measured with a pressure bomb, with readings taken immediately before dawn and/or at midday. Leaf water potential is measured on exposed leaves, while for stem water potential the leaves are shaded. The stem water potential is a much more stable indicator of the water status of mature trees than leaf water potential (Fereres, Reference Fereres, Goldhamer, Sadras, Steduto, Hsiao, Fereres and Raes2012). Sap flow sensors are used to monitor changes in sap speed, which is an indirect measure of transpiration in individual trees. Displacement sensors (dendrometers) are used to monitor trunk diameter fluctuations, which are considered to be early indicators of water stress. All three of these techniques (pressure bomb, sap flow sensors and dendrometers, together with leaf diffusion porometers) have been used in research projects with the olive tree. Typical reference values of stem water potentials are listed in Table 1.
Typical values of stem water potential (MPa) at different levels of water stress on sunny, summer days (ETo = 5–6 mm d−1) (based on Fereres, Reference Fereres, Goldhamer, Sadras, Steduto, Hsiao, Fereres and Raes2012).
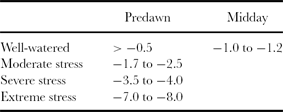
Spain: Diurnal measurements of leaf water potential and stomatal conductance at different times during the season in south-west Spain (37°17′N 06°03′W; alt. 30 m) showed how olive trees (26-year-old; cv. Manzanillo) conserved water under conditions of high evaporative demand (saturation deficit up to 3.5 kPa) by closing their stomata (Fernández et al., Reference Fernández, Moreno, Girón and Blázquez1997). The stomata on young leaves exhibited better water use control than those on leaves that had been on the tree for a year. Maximum stomatal conductances occurred at relatively low photon flux densities (c. 500 μmol m−2 s−1). At similar radiation levels and saturation deficits, the stomata were wider open in the morning than in the afternoon. In well-irrigated trees, pre-dawn leaf water potentials never fell below –0.50 MPa, but reached –2.47 MPa at midday late in the season. The corresponding values for unirrigated trees were less than –1.60 MPa and –3.63 MPa respectively. After watering, both these variables matched those of irrigated trees within two days.
In order to characterize with greater precision the gas exchange processes of olive trees at various levels of water stress, Moriana et al. (Reference Moriana, Villalobos and Fereres2002) took measurements within a deficit irrigation experiment in Cordoba (38°N 4.8°W; alt. 110 m) during 1998 (trees spaced 6 × 6 m = 280 trees ha−1). Both leaf photosynthesis and stomatal conductance responded diurnally and seasonally to changes in the tree water status and to the evaporative demand in similar ways (there was a close linear correlation between these two variables, r2 = 0.92). Maximum values again occurred in the morning, followed by a continuous decline throughout the afternoon. As water stress increased, both the daily maximum and minimum values fell. In the absence of water stress, midday photosynthesis rates and stomatal conductances were high during the autumn and low on days when the air was dry (large saturation deficits). Transpiration efficiencies (mmol CO2 mol H2O−1) followed a diurnal course similar to those for photosynthesis and stomatal conductance. At stem water potentials greater than –4 MPa, an inverse hyperbola described the relationship with the saturation deficit of the air (R 2 = 0.91). Stem water potentials fell to –8 MPa in the rain-fed treatment, which is a much lower value than those observed in most crop plants subjected to drought (Moriana et al., Reference Moriana, Villalobos and Fereres2002). This capacity of the olive tree to reduce its stem water potential so low explains why it was able to extract water from the 2.4 m deep soil profile (192 mm) in the rain-fed plots at water contents below the conventionally accepted definition of permanent wilting point (soil matric potential = –1.5 MPa), also known as the lower limit of extraction (available water holding capacity = 150 mm).
As part of a modelling study to predict photosynthesis under drought conditions, the photosynthesis capacity was observed to decline over the growing season in both irrigated and unirrigated olive trees (cv. Manzanilla). The seasonal reduction in leaf nitrogen content (on a leaf area basis) was used in the model to predict photosynthesis under drought conditions (Díaz-Espejo et al., Reference Díaz-Espejo, Walcroft, Fernández, Hafidi, Palomo and Girón2006).
Previously, Jorba et al. (Reference Jorba, Tapia and Sant1985) had described the results of a container experiment at the University of Barcelona, Spain. In well-watered plants, leaf water potentials fell from –0.7 MPa at sunrise to –2.5 MPa at midday. Under dry conditions, values as low as –4.0 MPa were recorded. There was a linear relationship between the net photosynthesis rate and leaf water potential over the range of –1.0 to –3.5 MPa. The three cultivars studied (Arbequina, Manzanillo and Sevillana) all responded to dry conditions in similar ways. In another container experiment leaf conductance was found to be more sensitive to water stress than vegetative growth (Gómez-del-Campo, Reference Gómez-del-Campo2007).
At the same site in south-west Spain referred to above, Fernández et al. (Reference Fernández, Díaz-Espejo, Infante, Durán, Palomo, Chamorro, Girón and Villagarcía2006) subsequently compared the effects of ‘partial root zone drying’ and ‘regulated deficit irrigation’ on various water status indicators, including leaf water potential, stomatal conductance and net CO2 assimilation rates. No evidence could be found to show that partial root zone drying, which involved keeping half the root zone dry for two to three weeks prior to switching the irrigation from one side of the tree to the other, had a positive effect on any of these variables compared with regulated deficit irrigation. In many species, for example the vine, allowing part of the root zone to dry in this way initiates a signalling mechanism. This triggers partial stomatal closure, which in turn reduces water loss by transpiration, without a proportional loss in yield. For olive, sap flow measurements confirmed that daily water consumption was similar in both deficit irrigation treatments on most days throughout the irrigation period. There was no evidence to show that alternating the water application (by drip) from one side of a tree to the other had any advantages compared with conventional regulated deficit irrigation.
As a result of small reductions in stomatal conductance, trees with part of the root system in a drying soil maintained midday leaf water potentials at levels similar (c. –1.5 MPa) to those in trees in which the whole soil profile was kept close to field capacity (Torres-Ruiz et al., Reference Torres-Ruiz, Fernández, Diaz-Espejo, Martin-Polemo, Morales-Sillero, Muriel and Romero2011). However, in rain-fed trees, large reductions in stomatal conductances did not prevent midday leaf water potentials (between –3.5 and –5 MPa) from falling below those of the irrigated trees (–1 to –2 MPa).
In a complex study, conducted at two contrasting sites, Moriana et al. (Reference Moriana, Pérez-López, Prieto, Ramírez-Santa-Pau and Pérez-Rodriguez2012) attempted to evaluate the possibility of using stem water potential as a guide for scheduling irrigation. The results are not easy to summarise, since the responses varied with site and season. This was an ambitious project, but the practical outcomes are not immediately obvious.
The presence of fruit on an olive tree influences its water status. For example, in an experiment in south-west Spain, mid-morning, stomatal conductances (cv. Morisca) were about 17% higher during the late summer and early autumn, that is from a few weeks after fruit set until harvest, in trees with fruits than in those without fruits. This response was observed at all levels of water supply (Martín-Vertedor et al., Reference Martín-Vertedor, Rodríguez, Losada and Castiel2011a). The lowest midday leaf water potentials recorded were about –4.0 MPa in young trees, and –3.0 MPa in mature trees, both recorded in the early autumn. Leaf water potential values were less in trees with a medium/heavy fruit load than in those without fruit.
In recent years, the so-called ‘magnetic leaf patch clamp pressure probe’ has been successfully used to measure the pressure potential (turgor pressure) within a leaf. A series of papers demonstrate how this new sensor (known commercially as a ZIM probe) has the potential to monitor on a continuous basis the water status of olive trees in an orchard (Fernández et al., Reference Fernández, Rodriguez-Dominguez, Perez-Martin, Zimmerman, Rüger, Martin-Palomo, Torres-Ruiz, Cuevas, Sann, Ehrenberger and Diaz-Espejo2011b; Rodriguez-Dominguez et al., Reference Rodriguez-Dominguez, Ehrenberger, Sann, Rüger, Sukhorukov, Martin-Palomo, Diaz-Espejo, Cuevas, Torres-Ruiz, Perez-Martin, Zimmerman and Fernández2012).
Italy: In southern Italy (41°06′N 14°43′E; alt. 250 m), Tognetti et al. (Reference Tognetti, d'Andria, Morelli, Calandrelli and Fragnito2004) made a sequence of measurements in a field experiment. Diurnal changes in sap flow (compensation heat pulse technique), leaf water potential and stomatal conductances were recorded between May and October 2002 in an 11-year-old orchard (cv. Kalamata grafted on DA121 rootstock; tree spacing 3 × 6 m = 555 trees ha−1) on irrigated and rain-fed trees. Pre-dawn leaf water potentials never fell below –0.5 MPa in irrigated trees, or below –2.5 MPa at midday. Both these values were very close to those reported in Spain. Sap flow rates for irrigated trees peaked at midday, reaching maximum values of 4–5 kg h−1 in June before progressively declining until October. Mean daily stomatal conductance also declined as the summer progressed. There was a positive linear relationship (r2 = 0.83, irrigated trees) between hourly sap flow rates and the saturation deficit of the air (range 0 to 3.5 kPa). Similarly, there was a linear correlation (r2 = 0.72) between daily sap flow and daily estimates (Penman–Monteith equation) of reference crop ETo (range 0 to 6 mm d−1). The hydraulic conductivity of a tree (represented by the slope of the line relating xylem water potential and sap flow) declined from June onwards, more in the rain-fed trees than in those that were irrigated. A polynomial quadratic curve represented the close relationship between the photosynthetic rate and stomatal conductance (R 2 = 0.87).
Morocco: In a ‘partial root-zone drying’ field experiment in Morocco (31°38′N 08°04′W) with mature olive trees (spaced 6 × 6 m = 280 trees ha−1), Centritto et al. (Reference Centritto, Wahbi, Serraj and Chaves2005) found, when similar depths of water were applied, that the leaf water status in trees (irrigated on alternate sides) was similar to that recorded in the control trees (irrigated on both sides). By contrast, applying half that quantity of water on one side of the tree only and switching sides every two weeks, reduced the leaf water potential, but only marginally relative to the 50% water saving. The relative water contents of the leaves were similar, and their photosynthetic capacity was maintained. Wahbi et al. (Reference Wahbi, Wakrim, Aganchich, Tahi and Serraj2005) have described the yield responses in this experiment (see below).
New Zealand: In New Zealand, Greven et al. (Reference Greven, Neal, Green, Dichio and Clothier2009) investigated the impact of short-term water stress on some physiological processes in five-year-old trees (cv. Verdale) growing in a stony silt loam soil with a water-holding capacity of only about 70 mm m−1. Roots did not extend below a depth of 1 m. Using the compensation heat-pulse technique, sap flow rates were monitored regularly over a two-month period. On warm, sunny days, these peaked in irrigated trees at about 3 L h−1, equating to 30 L d−1 tree−1, while the corresponding flow rates in adjacent trees without irrigation, or significant rainfall, for two months declined to 0.4 L h−1. Leaf water potentials in irrigated trees varied between –0.4 MPa at dawn and –2.1 MPa at noon, while stem water potentials did not fall below –1.4 MPa. In unirrigated trees, pre-dawn leaf water potentials declined to less than –4.0 MPa, a very low value that was below the limit of measurement. Upon re-watering, the recovery in sap flow rates was rapid (within seven days), while, because of variability between leaves on the same tree, it took up to 10 days for leaf water potentials to return to pre-drought levels. This is unusual for tree crops, as normally it is the opposite way round, with recovery in water status preceding the recovery in transpiration rates.
Tunisia: In southern Tunisia (34°N 10°E), Masmoudi et al. (Reference Masmoudi, Ayachi, Gouia, Laabidi, Reguaya, Amor and Bousnina2010) recorded midday leaf water potentials and stomatal conductances in five cultivars of six-year-old olive trees over a summer season. There were three deficit irrigation treatments (20, 50 and 100% ETc replacement, where ETc is the potential water use by olives). Due to variability in the data, it is not easy to interpret the results presented. Although there were seasonal and cultivar differences, the responses to the irrigation treatments were inconsistent. Early in the summer, cv. Pincholine had the highest leaf water potentials under both wet (–0.97 MPa) and dry (–1.5 MPa) soil conditions. The corresponding values for the other cultivars were lower (range –1.63 to –2.13 MPa). Later in the season, the leaf water potentials were least for cv. Coratina (–4 MPa) compared with –3 MPa for the other four cultivars. Masmoudi et al. (Reference Masmoudi, Ayachi, Gouia, Laabidi, Reguaya, Amor and Bousnina2010) stated that the recommended threshold stem water potentials at midday for initiating irrigation of olives in central Spain were –1.2 MPa during ‘on’ years and –1.4 MPa during ‘off’ years. It is not clear on what evidence this assertion was based.
Surprisingly, diurnal changes in leaf conductance were judged to be more consistent than leaf water potentials (since sometimes it was difficult to judge when the end point occurred in the pressure bomb). In all cases (cultivars and watering levels), there was evidence of (partial) midday stomatal closure. Conductance fell during the morning, reaching minimum values around midday, before increasing again during the afternoon. There were significant differences in stomatal conductance between cultivars and also between the irrigation deficit treatments (Masmoudi et al., Reference Masmoudi, Ayachi, Gouia, Laabidi, Reguaya, Amor and Bousnina2010). This was not an easy paper to follow.
The main observation that came out of another deficit irrigation experiment in an arid region of Tunisia (34°43′N 10°41′E) was the adverse effects of high temperatures during the summer on photosynthetic rates for both irrigated and rain-fed trees (cv. Chemlali). Mean monthly maximum daily temperatures were 34.5 °C (June), 37 °C (July) and 39 °C (August). It was not until the weather cooled in September and October (31 °C) that the gas exchange processes (stomatal conductance, photosynthesis and transpiration) in the irrigated trees returned to values recorded in the spring. The more severe the water stress experienced the slower the rate of recovery. On a diurnal basis in June, the stomata were partly open early in the morning, but from 0800 h onwards there was progressive stomatal closure for the remainder of the day. A detailed analysis showed that for an irrigated tree the optimum temperature for photosynthesis was 30 °C (corresponding to a photosynthetically active radiation intensity of 1250 μmol m−2 s−1), declining rapidly to almost zero at 40 °C. For a severely water-stressed tree the temperature response curve was largely flat, at a low photosynthetic rate, before peaking at about 28 °C. Ahmed et al. (Reference Ahmed, Rouina and Boukhris2007) refer to the response of the olive to conditions in the summer period as ‘a rest phase’.
Trunk diameter variability (TDV)
Reports of olive TDV use a number of terms that are defined in Box 2 in an attempt to minimise confusion.
Definitions of terms used when monitoring variability in tree trunk size
Trunk diameter variation: The generic term from which other indicators of water stress are derived.
Maximum daily shrinkage: Maximum trunk diameter minus minimum diameter, calculated on a daily basis.
Daily recovery: Maximum trunk diameter on a particular day minus minimum diameter on preceding day.
Trunk growth rate: Usually measured over a series of days; can be expressed as daily growth.
Daily growth rate: Equates to trunk growth rate.
Signal intensity: Actual daily shrinkage divided by reference daily shrinkage.
Sensitivity: A measure of precision; in this case, signal intensity divided by coefficient of variation.
Actual/reference values: Actual value of variable for deficit-irrigated trees divided by reference value for well-watered control trees.
Spain: During 2009, the usefulness of maximum trunk diameter measurements to detect water stress in mature, 12-year-old olive trees (cv. Arbequina), heavy with fruit, was studied in a commercial orchard in south-west Spain (37°30′N 05°44′W; alt. 60 m) by Fernández et al. (Reference Fernández, Torres-Ruiz, Diaz-Espejo, Montero, Alvarez, Jiménez, Cuerva and Cuevas2011c). There were two treatments: One in which the soil was irrigated to field capacity twice a week, and another in which the soil was allowed to dry until the fruits were observed to shrivel, whereupon the same cumulative total quantity of water was applied as in the first treatment. In addition, there were two control trees that were supplied with excess water (1.5 ETc) to ensure that they were never short of water. The potential ETc was determined using the following relationship:
 \begin{equation*}
{\rm ETc} = {\rm Kc}\; \times \;{\rm Kr}\; \times \;{\rm ETo},\end{equation*}
The ‘trunk diameter variations’ were analysed by Fernández et al. (Reference Fernández, Torres-Ruiz, Diaz-Espejo, Montero, Alvarez, Jiménez, Cuerva and Cuevas2011c) in a number of different ways with the overall aim of identifying an index that could usefully and reliably identify water stress in an orchard in south-west Spain. They found that the most useful approach was to calculate, on a daily basis, the difference between the maximum trunk diameter in a control well-watered tree and that of the tree under comparison. This is referred to as the ‘maximum trunk diameter difference’. Its value mimicked closely changes in the water status of the soil and plant, in contrast to the so-called signal intensity for ‘maximum daily shrinkage’ (=actual value/reference value) with which it was compared. For each comparison, four instrumented trees were enough to provide reliable data from which to detect the onset and severity of water stress for olive trees with a heavy fruit load (cv. Arbequina).
In a similar comparison, again in Spain, of the different ways in which ‘trunk diameter variations’ can be expressed (Box 2), Cuevas et al. (Reference Cuevas, Torres-Ruiz, Álvarez, Jiménez, Cuerva and Fernández2010) came to the conclusion that, for trees with large root zones (low/medium planting density, old trees), the various derived indices were of little value where the aim was to keep the soil profile close to field capacity. However, the ‘maximum daily shrinkage’ and ‘daily recovery’ indices could be useful indicators to avoid fruit shrivelling, since this can adversely affect oil quality. In the same study, good relationships (linear) were obtained, for well-watered trees, between ‘maximum daily shrinkage’ and maximum daily air temperature (r2 = 079–0.81), and also with the maximum daily saturation deficit of the air (r2 = 0.74–0.80).
According to Moriana et al. (Reference Moriana, Fereres, Orgaz, Castro, Humanes and Pastor2000), the relationship between the maximum daily shrinkage and stem water potential had two components. Under conditions of mild water stress (stem water potential at midday above –1.5 MPa) the response was linear, i.e. the maximum daily shrinkage increased as the stress level increased. But at stress levels greater than –1.5 MPa, the maximum daily shrinkage got less. In other words, there was not a straightforward relation between these two parameters. However, maximum daily shrinkage and weather variables such as temperature (in particular) and the saturation deficit of the air were correlated. Moriana et al. (Reference Moriana, Moreno, Girón, Conejero, Ortuño, Morales, Corell and Torrecillas2011) analysed daily weather and trunk shrinkage data, collected over four successive years (2005–2008), from fully irrigated, 37-year-old trees (cv. Manzanillo). Data from the fifth year (2009) were used to validate the relationships. The best correlations (all were linear) were between the maximum daily shrinkage of the trunk and the air temperature at midday (very highly significant, r2 = 0.85; range c. 16 to 40 °C)) and between the maximum daily shrinkage and the saturation deficit of the air (range 0 to 6 kPa), also at midday (r2 = 0.81). There were seasonal differences in the relationships; the slope and/or intercept varied. But for years when the fruit loads (‘on’ years and ‘off’ years) were similar, the correlations were also similar. It was expected that benchmarks of this nature would help facilitate the use of plant-based indicators as tools to improve irrigation water management.
In a further attempt to develop plant-based indices for detecting the onset and severity of water stress in mature olive trees with a heavy fruit load, Fernández et al. (Reference Fernández, Moreno, Martin-Palomo, Cuevas, Torres-Ruiz and Moriana2011a) analysed the relations between sap flow, trunk diameter variation, midday stem water potential, relative soil water content and atmospheric demand. The measurements were made in a deficit irrigation experiment during an ‘on’ year (2006) in an orchard planted with large, 38-year-old trees (cv. Manzanillo de Sevilla, spaced 7 × 5 m = 285 trees ha−1). The main conclusion from this detailed analysis was that the water needs of an orchard like the one described could be best assessed through the simultaneous use of the daily difference in the maximum trunk diameter of a stressed tree and a control well-watered tree, together with the corresponding difference in the daily water use (sap flow, L tree−1 d−1). Using other derivatives such as signal intensity offered no advantages. The number of instrumented trees still needed to be assessed.
Cuevas et al. (Reference Cuevas, Martín-Palomo, Díaz-Espejo, Torres-Ruiz, Rodriguwez-Dominguez, Perez-Martin, Pino-Mejías and Fernández2012) extended the search for a suitable indicator to a high-density hedgerow olive orchard (1667 trees ha−1; cv. Arbequina). Based on measurements made in a regulated deficit irrigation experiment with four-year-old trees with a heavy fruit load in south-west Spain (37°15′N 5°48′W), they concluded that the daily difference in water use was a better indicator of when to irrigate than the daily difference in maximum trunk diameter. This could either be used alone (although care was needed in interpreting the data), or in association with the daily difference in the maximum trunk diameter. The maximum daily shrinkage was not a reliable water stress indicator. The search goes on! But, since even relatively simple irrigation scheduling techniques are not being widely used by irrigators in commercial orchards, it can be questioned whether any of these sophisticated techniques is likely to be taken up in practice.
Osmotic regulation
Greece: Previously, Chartzoulakis et al. (Reference Chartzoulakis, Bosabalidis, Patakas and Vemmos2000) had demonstrated in a pot (volume 50 L) experiment lasting two years in Crete (Greece) the occurrence of osmotic regulation in severely stressed olive plants (cv. Koroneiki; pre-dawn leaf water potential down to –4.8 MPa). This was a result of solute accumulation (mainly mannitol and to a lesser extent glucose). There were also increases in the cell wall elasticity and reductions in the volume of intercellular spaces. All of these attributes contributed to drought tolerance by maintaining cell turgor.
Tunisia: In a well-written paper, Ennajeh et al. (Reference Ennajeh, Tounekti, Vadel, Khemira and Cochard2008) reported the results of an experiment in southern Tunisia (33°50′N 10°05′E) in which the responses to drought of two contrasting cultivars, Meski and Chemlali, were compared. In a shaded, greenhouse study, the relative contributions to drought tolerance of osmotic adjustment and resistance to xylem cavitation (embolism) were assessed over a 60-day period. Several studies (cited by Ennajeh et al., Reference Ennajeh, Tounekti, Vadel, Khemira and Cochard2008) had shown that osmoregulation (by means of the synthesis and accumulation of solutes in cells) occurs in olive. By maintaining a positive pressure potential in the cell, the water potential gradient between the soil and the leaf is maintained, thereby facilitating water uptake from the soil. Another drought adaptation of olive trees is the capacity of the leaves to release about 60% of the water stored in their tissues at full turgor to transpiration.
The value of osmotic adjustment can however be negated during a drought by cavitation in the xylem vessels, which reduces the hydraulic conductivity of the xylem. Ennajeh et al. (Reference Ennajeh, Tounekti, Vadel, Khemira and Cochard2008) found that cv. Chemlali had a greater capacity than cv. Meski for osmotic adjustment and that both cultivars exhibited embolism. The xylem potential inducing a 50% loss of stem conductivity approached –7 MPa in cv. Meski but was slightly less (more negative) than this in cv. Chemlali, suggesting that cv. Meski was more vulnerable to embolism than cv. Chemlali. In addition, cv. Meski maintained a slightly higher stomatal conductance and transpiration rate than cv. Chemlali throughout the period of severe drought. There was also a close (linear) relationship between pre-dawn leaf water potential and soil water potential (at a depth of 0.20 m) for both cultivars, with a small divergence from linearity for cv. Chemlali under very dry conditions. Although the differences were all small, they confirmed the superior drought resistance of cv. Chamlali compared with cv. Meski as previously reported by Ennajeh et al. (Reference Ennajeh, Vadel, Khemira, Ben Mimoun and Helali2006). Measurement of resistance to embolism may provide an effective way for screening cultivars suited to dry areas (Ennajeh et al., Reference Ennajeh, Tounekti, Vadel, Khemira and Cochard2008).
Summary: plant water relations
1. Olive trees conserve water under conditions of high evaporative demand by closing their stomata.
2. Stomatal conductances (generally) peak in the morning and then progressively decline during the remainder of the day.
3. Rates of photosynthesis and transpiration (and instantaneous transpiration efficiencies) follow a similar diurnal trend, except under conditions of high evaporative demand when transpiration peaks later in the day than photosynthesis.
4. Mean daily stomatal conductances decline as the summer progresses.
5. In well-watered trees, rates of photosynthesis decline rapidly at temperatures greater than 28–30 °C, reaching zero at 40 °C.
6. In well-irrigated trees, pre-dawn leaf water potentials remain above –0.5 MPa, and at midday above –2.5 MPa.
7. Under dry conditions, midday stem water potentials can fall as low as –8 MPa, which is much lower than those experienced by most crop plants subjected to drought. The presence of fruit on a tree reduces the midday leaf water potential.
8. There is a positive linear relation between rates of sap flow and the saturation deficit of the air.
9. The hydraulic conductivity of a tree declines as the summer progresses, more so in rain-fed trees than in those that are irrigated.
10. There is no evidence that partial root zone drying offers any advantages over regulated deficit irrigation in terms of tree water status.
11. There have been many attempts to develop ways of exploiting the sensitivity of trunk expansion to water availability as a means of scheduling irrigation. No clear consensus has yet emerged.
12. Maximum daily trunk shrinkage is correlated with maximum/midday daily temperature and maximum/midday daily saturation deficit.
13. Among all the tree indicators related to water status, the most promising for detecting water stress in an olive orchard are the difference in the maximum trunk diameter of a stressed tree and a control well-watered tree, and the corresponding difference in sap flow rates, after calibration of the sensors (both calculated on a daily basis).
14. Osmotic regulation (due to solute accumulation) and resistance to cavitation (due to narrow xylem vessels) contribute to the capacity of the olive to withstand drought. Cultivars differ in these attributes.
CROP WATER REQUIREMENTS
Since the pioneering work undertaken by Hendrickson and Veihmeyer (Reference Hendrickson and Veihmeyer1949) in California, many attempts have been made to measure/estimate/model the actual water use of olive trees at different scales (see Fereres et al., Reference Fereres, Villalobos, Orgaz and Testi2011 for a succinct review). At the level of a leaf, measuring instantaneous transpiration is now an important component of fundamental studies of plant water relations (as described above). Following its successful evaluation by Moreno et al. (Reference Moreno, Fernández, Clothier and Green1996) in Spain, the sap flow approach has been widely used to estimate transpiration rates for individual olive trees. Alongside this approach, the micro-meteorological, aerodynamic method has been used, together with micro-lysimeters, in parallel studies to measure evapotranspiration (ET), together with its two principal components, evaporation (E) and transpiration (T), from a population of trees within an orchard. The aim of this research is to improve the precision of estimates of ETc by identifying appropriate crop coefficients that can be used for project planning and/or for day-to-day scheduling of irrigation in an individual orchard.
As Villalobos et al. (Reference Villalobos, Orgaz, Testi and Fereres2000) and, more recently, Fereres et al. (Reference Fereres, Villalobos, Orgaz and Testi2011) have highlighted, it is not appropriate, or indeed possible, to specify a single value of Kc for a widely spaced, evergreen tree crop like the olive. Its value varies among locations, and even between years, in response to changes in the saturation deficit of the air (due to the enhanced control of canopy conductance by the stomata) and evaporation from the soil surface. The complexity of the problem is exasperated by the structural changes occurring in the industry. These are leading to a mosaic of olive orchards with, for example, differences in tree densities creating a wide range of crop cover.
In this section, two levels are considered: transpiration by a single tree and ET by a plantation or an orchard. Since the contexts for the research at a national level will differ, selected examples of the results of research on these topics are again presented under the headings for individual countries: Spain, Portugal, Morocco (all Mediterranean countries), Argentina and Australia (two relatively new producers).
Transpiration
Spain: In southern Spain (37.85°N 4.80°W; alt. 110 m), Villalobos et al. (Reference Villalobos, Perez-Priego, Testi, Morales and Orgaz2012), using large closed chambers in an olive orchard, monitored carbon exchange and transpiration of individual trees (cv. Arbequina, spaced 3.5 × 7 m = 408 trees ha−1) during 2006 and 2007. Canopy conductance peaked in the early morning (0800–0900 h GMT) and then declined until sunset in both well-watered and the deficit-irrigated trees. By contrast, transpiration by the well-watered trees reached a maximum in early afternoon (1300–1400 h GMT) and declined from 1600 h onwards. Daily transpiration rates equated to 0.6 to 3.4 mm d−1. For deficit-irrigated trees, transpiration was virtually constant at a lower level (0.4 to 2.9 mm d−1) from 0900 to 1600 h. For comparison, ETo varied between 1.1 and 7.1 mm d−1. Net assimilation peaked early in the morning (0800–0900 h), before declining steeply from about 1500 h. Daily total assimilation varied from 10.8 to 21.3 g CO2 d−1. Instantaneous water-use efficiency, which was inversely related to the saturation deficit of the air (range 0 to 5.8 kPa), declined throughout the day, from about 30 g CO2 L−1 at sunrise down to 4–7 g CO2 L−1 at sunset.
Argentina: The olive industry is developing rapidly in Argentina, particularly in the arid areas in the north-west of the country. In the past 15–20 years, large (>100 ha) commercial olive orchards have become common (Rousseaux et al., Reference Rousseaux, Benedetti and Searles2008). By contrast to the Mediterranean region, there is no winter rainfall in this part of Argentina. During the summer, the total rainfall received is 100–400 mm. In Rioja province, irrigation is practised throughout the year with water obtained from subsurface aquifers 100–200 m below the surface. It is not known whether recharge of the aquifers is sufficient to replace the water being used for irrigation. Meanwhile, global climate change models predict a reduction in precipitation in this region (Rousseaux et al., Reference Rousseaux, Figuerola, Correa-Tedesco and Searles2009).
This is the context in which Rousseaux et al. (Reference Rousseaux, Benedetti and Searles2008) began to investigate the leaf level responses of olive (cv. Manzanillo) to irrigation over a 40-day period in the winter (La Rioja province, 28°33′S 66°49′W; alt. 800 m). During this time period, there were only small reductions in transpiration rates and leaf conductances in the unirrigated trees compared with those that were well irrigated. Reference crop ETo (FAO, Penman) during the first four weeks averaged 2–3 mm d−1, increasing to 4–5 mm d−1 towards the end of the experiment when the soil profile to a depth of 0.90 m was close to permanent wilting point. Irrespective of the irrigation regime there was a strong curvilinear relationship between leaf conductance and the saturation deficit of the air, with conductance declining rapidly as the saturation deficit (recorded at midday) increased from 2 to 3 kPa, and declining less rapidly from 3–6 kPa. The stomata of both well-irrigated and dry trees behaved in identical ways.
Evapotranspiration
Spain: Recognising the need for a methodology that would allow reasonable estimates of Kc to be determined for a range of practical situations, Testi et al. (Reference Testi, Villalobos, Orgaz and Fereres2006) developed a model for determining monthly Kc values that took into account four components: tree transpiration, direct evaporation of water intercepted by the crop canopy, evaporation from the soil surface and evaporation from the areas wetted by drip irrigation emitters. The model was validated against actual measurements of ET made over three years (1998–2000) in a young olive orchard (4 ha) in Cordoba, Spain, using both the eddy correlation technique and the water balance method (Testi et al., Reference Testi, Villalobos and Orgaz2004). The model was then used to simulate the water use (and its principal components) by an olive orchard at two sites, Cordoba and Fresno, in California, and for two hypothetical case studies, a traditional low-density (100 trees ha−1) orchard converted to irrigation, and an intensive (300 trees ha−1) modern orchard. The annual average values for Kc were 0.57 (low density) and 0.63 (high density), and monthly values for July (mid-summer) were 0.49 and 0.53. These are comparable with those values obtained by direct measurement in a young orchard (trees were from one to four years old): for a ‘typical’ summer day, without irrigation, Kc = 0.15, when the crop cover was about 5%, and 0.3 at 25% ground cover. When the wet soil surface patches associated with drip irrigation were taken into account the corresponding values for Kc were 0.22 and 0.35 respectively (Testi et al., Reference Testi, Villalobos and Orgaz2004). In the winter, when the soil surface was frequently wetted by rain, Kc sometimes reached 0.8.
In addition to the standard, representative weather data needed to calculate ETo, to run the model it is necessary to know the tree density and canopy volume, the ground area wetted by the emitters and the frequency of irrigation/rainfall events. Using 20 years of daily data from Andalusia, Spain, the same researchers (Orgaz et al., Reference Orgaz, Testi, Villalobos and Fereres2006) presented examples of the model's outputs for five different scenarios: a traditional olive orchard at immature and mature stages of development, a semi-intensive orchard (spacing 7 × 7 m = 204 trees ha−1) also at two stages of development and a modern, highly intensive orchard (spacing 7 × 3.5 m = 408 trees ha−1). The range of values for the four components of the annual water requirements covering these five simulations were as follows: tree transpiration 156–708 mm (32–65% of total ETc), soil surface evaporation 223–283 mm (25–53% of total ETc), evaporation from wet soil 23–63 mm (5–7% of total ETc) and intercepted rainfall evaporation 19–72 mm (4–10% of ETc). For irrigation scheduling purposes, the model could be used to predict water use by using long-term average weather data, adjusted as necessary at the end of the month.
Over a six-year period (2002–2007), the impact that the number of fruits on an olive tree (the crop load) had on its crop water status, ETc and productivity was studied in south-west Spain (38°51′N 6°40′W; alt. 200m) by Martín-Vertedor et al. (Reference Martín-Vertedor, Rodríguez, Losada and Castiel2011a, Reference Martín-Vertedor, Rodríguez, Losada and Castielb). There were two experiments, one with young trees and another with more mature, annually pruned trees (both cv. Morisca), in which deficit irrigation (including excess irrigation) was imposed (experiment 1: 75, 100 and 125% of ETc; experiment 2: 60, 100 and 115% of ETc). Crop loads were added as a variable varied, either artificially by thinning the fruit, or by comparing ‘on’ and ‘off’ years. The following observations were made:
• The FAO method (Doorenbos and Pruitt, Reference Doorenbos and Pruitt1974), with Kc proposed by Pastor et al. (Reference Pastor, Orgaz, Vega, Hidalgo and Castro1998) and Kr taken from Fereres et al. (Reference Fereres, Martinich, Aldrich, Castel and Schulbach1982), underestimated ETc in the control (100% replacement) treatment.
• A better estimate of ETc was obtained by using the method proposed by Orgaz et al. (Reference Orgaz, Testi, Villalobos and Fereres2006).
• Over the period from flowering to fruit colour change, ‘on’ year trees depleted more water from the soil profile (to a depth of nearly 1.0 m) than ‘off’ year trees.
• The absence of fruits reduced ETc compared with medium and high crop loads, but canopy size was a much more important determinant of orchard water requirements than crop load.
Run-off and run-on: As Castro et al. (Reference Castro, Romera, Gómez and Fereres2006) showed, rainfall redistribution in an orchard could be substantial because of localised run-off and run-on induced by the spatial variability of infiltration rate, rainfall interception by the trees and surface roughness. A physically based model, calibrated locally (Cordoba, southern Spain, average annual rainfall of about 550 mm), predicted annual cumulative infiltration differences of 40 to 100 mm between the area beneath the trees (olive) and the adjacent bare soil inter-row area. Such differences could represent fruit yields equivalent to 40 mm × 25 kg ha−1 mm−1 (=1000 kg ha−1) and 100 mm × 25 kg ha−1 mm−1 (=2500 kg ha−1) (see below). These yield gains are sufficiently large to justify developing rainwater run-off structures for rain-fed olive orchards.
Argentina: Following the previous work by Rousseaux et al. (Reference Rousseaux, Benedetti and Searles2008), summarised above, the same team undertook a detailed study of the actual water use of drip-irrigated olives (cv. Manzanillo fina, spaced 4 × 8 m = 312 trees ha−1; crop cover 23%) over a 12-month period with the aim of specifying appropriate values for Kc for use in north-west Argentina (28°33′S 66°49′W; alt. 800 m) (Rousseaux et al., Reference Rousseaux, Figuerola, Correa-Tedesco and Searles2009). Transpiration was monitored using the sap flow (heat balance) method. Values obtained ranged from highs of 2.0 mm d−1 in the mid-spring and summer to 0.23 mm d−1 in the winter. Direct evaporation from the soil surface (based on data from micro-lysimeters) varied between 0.2 and 0.6 mm d−1, depending on the area of soil surface that was wetted and the frequency and duration of wetting. For a well-irrigated orchard, transpiration represented 0.45–0.60 × ETo (except in the winter when values were close to 0.15), and evaporation from both the tree zone and the inter-row areas averaged about 0.20 × ETo. These values were based on Penman–Monteith estimates of ETo using weather data collected over a bare soil (i.e. not grass). On average, transpiration represented about 70–80% of potential crop evapotranspiration (ETc), except when the soil surface was kept exceptionally wet. Daily transpiration per unit of leaf area was linearly related to daily ETo values (range 2 to 10 mm d−1; r2 = 0.84) and solar radiation (range 10 to 30 MJ m−2 d−1; r2 = 0.80), but exponentially related to average daily saturation deficits of the air (range 0.5 to 3.5 kPa; R 2 = 0.85). There was a suggestion that the relationship with daily mean temperature was two-stage linear, with no transpiration at temperatures below 13 °C but linear from 13 to 30 °C (r2 = 0.93). There was good agreement between estimated transpiration rates based on sap flow measurements and values calculated from the model proposed by Orgaz et al. (Reference Orgaz, Villalobos, Testi and Fereres2007).
Australia: In Australia, the olive industry has to compete with established irrigated crops such as grape vines for the scarce water resource. Prudent management of water is essential for a viable olive industry. This was the context in which the water use by four, carefully selected commercial olive orchards (groves) was monitored over two growing seasons (1999/2001) in South Australia (c. 34°S 140°E; alt. 300–500 m) (Nuberg and Yunusa, Reference Nuberg and Yunusa2003). The trees were >10 years old and densities varied between 133 and 204 trees ha−1. The soil textures varied between deep sandy, sandy loam over clay, clay loam over clay and clay loam over silty clay. Changes in soil water content (measured by using a neutron probe), from which ET was determined by using a simple water balance equation, light interception (leaf area index and ceptometer) and sap flow (heat pulse sensors, on one site over one season only), were monitored. Transpiration was estimated using an energy balance, micro-meteorological approach together with calculated values for stomatal conductances. The Priestley–Taylor equation was used to estimate evaporation from an open water surface (Eo) for the whole district using local weather data. The validity of the sap flow data was confirmed by a linear regression between sap flow and daily estimates of transpiration. In mid-summer, when daily average maximum temperatures and saturation deficits of the air reached 30 °C and 2 kPa respectively, Eo peaked at close to 10 mm d−1. Across the three irrigated orchards, total water use over a season (ET) was in the range 490–670 mm. By comparison on the rain-fed orchard, ET averaged only 316 mm. It was judged that not enough water was applied during mid-summer by the irrigators to match potential transpiration rates and that the orchard had been under-irrigated by about 15%. The full water requirement was probably 900 mm at one orchard where there was a permanent cover crop, and 700 mm at the two orchards where drip irrigation was used.
On average, where microsprinklers were used, transpiration represented 0.63 × ET, but 0.76 × ET where drip irrigation was practised and there was less surface evaporation. Peak rates of transpiration reached 120–147 L tree−1 day−1. Crop coefficients based on the Priestley–Taylor estimate of Eo averaged 0.38 on the irrigated estates and 0.23 on the rain-fed estate. (Note that in this case Kc = ET/Eo, not ETc/ETo as used elsewhere). Soil water extraction did not occur below 2 m depth. There was evidence that the stomata closed from midday onwards on hot, dry days. Estimates were provided of the monthly water requirements, and corresponding Kc values, for a drip-irrigated orchard at different stages of development (10, 20, 40 and 60% ground cover) (Nuberg and Yunusa, Reference Nuberg and Yunusa2003). This was an interesting approach to obtaining useful information in situations where funds and facilities did not exist for conventional field experiments.
Morocco: In a semi-arid area region of Morocco (31.601°N 7.974°W), Er-Raki et al. (Reference Er-Raki, Chebouni, Boulet and Williams2010) evaluated the FAO-56 dual approach (Allen et al., Reference Allen, Pereira, Raes and Smith1998) for estimating separately the soil evaporation and crop transpiration components of actual ET in a large (275 ha), flood-irrigated olive orchard (240-year-old trees, density 225 trees ha−1). In a detailed comparison over two years (2003 and 2004), model simulations were compared with measured values of ET (eddy correlation technique), and transpiration (scaled-up from sap flow measurements). The agreement between the two approaches was considered to be good. The value so derived for the basal crop coefficient (Kcb, transpiration component only) was 0.54 × ETo (where ETo was calculated from the Penman–Monteith equation). Using this dual approach, Er-Raki et al. (Reference Er-Raki, Chebouni, Boulet and Williams2010) evaluated the irrigation scheduling practices used by one farmer on the project. This suggested that although twice as much water was being applied in a growing season (800 mm) than was needed (411 mm), the olive trees still experienced water stress during the summer when ETo values were at their peak.
Portugal: In Portugal, the olive is traditionally a rain-fed crop and plays an important role in the rural economy. Existing orchards are now being irrigated and new ones created. The questions to be answered include how best to schedule irrigation in an orchard that for many years previously had been rain-fed only. This was the justification for a deficit irrigation experiment in southern Portugal described initially by Santos et al. (Reference Santos, Valverde, Ramos, Reis and Castanheira2007). Sap flow was measured at 30-minute intervals for four months in 2005 and for eight months from March to the end of August in 2006 in a low-density (12 × 12 m = 70 trees ha−1), previously rain-fed orchard planted with mature (cv. Cordovil, >80-year-old) trees. The results for individual trees were scaled up in order to estimate transpiration from an equivalent orchard by monitoring the sapwood and canopy areas of randomly chosen trees and comparing these values with those of the sampled trees. In 2006, transpiration in the fully irrigated treatment totalled 700 mm, in the 60% sustained deficit replacement treatment the total was 750 mm, in the regulated deficit treatment the total was 650 mm and in the rainfall-only control the total was 400 mm. Rainfall over the eight months totalled 240 mm, the ETo total was 1000 mm, while the depths of irrigation water applied were 880, 450 and 70 mm respectively (Ramos and Santos, Reference Ramos and Santos2009). In the well-irrigated trees the T/ETo ratios declined over the summer months from 0.75–0.8 in March/April to 0.6 in June/July, before increasing to 0.9 in September. This reflected the effect of the high-potential ETo (=7–8 mm d−1) experienced in mid-summer, which exceeded the capacity of the trees to transfer water from the wet soil to the sites of evaporation in the leaf at the needed rate (Santos et al., Reference Santos, Valverde, Reis, Ramos and Castanheira2012). The implications of the results of this experiment in terms of yield are considered below.
Summary: crop water requirements
The principal source for each summary statement is given at the end of the sentence.
(a) Transpiration
1. For a well-watered crop, the canopy conductance is low early in the morning, reaches a peak in mid-morning and then progressively falls for the remainder of the day (Spain).
2. Because of strong coupling between the olive tree and the bulk atmosphere, the aerodynamic conductance is many times greater than the canopy conductance.
3. Transpiration reaches a maximum in the early afternoon and then declines from 1600 h onwards; net assimilation of CO2 peaks early in the morning, and declines steeply from mid-afternoon onwards (Spain).
4. Instantaneous water-use efficiency declines throughout the day; it is inversely related to the saturation deficit of the air (Spain).
5. There is a close relationship (linear, Spain, Moriana et al., Reference Moriana, Villalobos and Fereres2002; curvilinear, Argentina) between leaf conductance and the saturation deficit of the air irrespective of the irrigation regime.
6. After re-watering droughted trees, stomatal conductance and leaf water potential usually return to pre-drought levels within two days (Spain), but it has taken longer elsewhere (New Zealand). Sap flow rates can take up to seven days.
(b) Evapotranspiration
7. It is not appropriate or indeed possible to specify a single value of Kc for a widely spaced, evergreen tree crop like the olive.
8. When estimating ET, it is necessary to take into account tree transpiration, direct evaporation of water intercepted by the leaf canopy, evaporation from the soil surface and evaporation from the areas wetted by the drip or sprinkler systems.
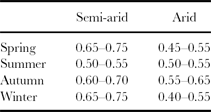
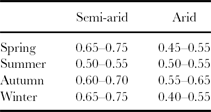
9. The seasonal values of Kc to be used as a first approximation for the computation of ETc for mature olive orchards with a crop cover of 50–60% in semi-arid areas with Mediterranean-type climatesFootnote 2 and arid locations are listed in Table 2 (Fereres et al., Reference Fereres, Villalobos, Orgaz and Testi2011).
10. Trees with a heavy fruit crop deplete more water from the soil profile than low yielding trees (Spain).
11. Because of localised run-off and run-on, rainfall redistribution in an orchard can be substantial (Spain).
12. In a well-irrigated orchard, transpiration represents 0.70–0.80 × ETc, or 0.45—0.60 × ETo (except in the winter) (Argentina, Morocco).
13. The T/ETo ratio can change over the growing season (in the northern hemisphere) from as low as 0.4–0.5 up to 0.75–0.80 in March/April to 0.60 in June/July before increasing to 0.90 in September. This reflects the effect of high evaporative demand on stomatal conductance (Portugal and others).
14. Total water use (ET) over a season (depending on how this is defined) is in the range 490–750 mm; of which transpiration is 0.76 × ET with drip irrigation, and 0.63 × ET with micro-sprinklers (Australia, Portugal).
Values of Kc for olive orchards in semi-arid and arid locations (figures from Fereres et al., Reference Fereres, Villalobos, Orgaz and Testi2011).
WATER PRODUCTIVITY
Tree density, or the plant population density, is of critical importance when assessing productivity, and complicates attempts to compare the results of experiments across sites. Some of the issues are considered here.
The olive tree is transplanted early in the growing season (after up to two years in the nursery) at a density that is dependent on rainfall and the pruning regime. This can be as little as 15–20 trees ha−1 under poor rain-fed conditions, and in excess of 2500 trees ha−1 when irrigated. According to Pastor et al. (Reference Pastor, García-Vila, Soriano, Vega and Ferere2008), the optimum (sustainable density) is probably about 400 trees ha−1 (7 × 3.5 m). Plant population studies for tree crops are not easy, but the results are fundamental to the success of a crop. They are particularly important in the case of the olive tree where the planting densities cover such a wide range. How a crop responds to irrigation/drought and how we interpret the results of irrigation experiments are strongly influenced by the plant density.
For example, Guerfel et al. (Reference Guerfel, Ouni, Boujnah and Zarrouk2010) compared the responses of cv. Chemlali (planted in 1988) to four tree densities (51, 69, 100 and 156 trees ha−1) over three years (2005–2007). The experiment was sited in a very dry area of Tunisia (35°49′N 10°30′E) where the average annual rainfall is only 250 mm. Because of weaknesses in the design of the experiment, the authors were unable to identify the optimum planting density for that location. This was partly because two of the three years that the experiment lasted were ‘off’ years in terms of yield. There are however three other lessons that can be learnt from this experience. First, with a long-term tree crop, three years is not long enough to monitor the cumulative effects of water management treatments on crop productivity (especially a biennial bearing crop like olive). Second, it is always wise to include in experiments of this type what may be regarded by others as crazy treatments. In this example, the spread of densities is very narrow (51–156). Why weren't tree densities of 200, 500, 1000 or even 2000 trees ha−1, for example, included in order to obtain a response curve, or better a series of response curves depending on the rainfall in a particular year? We can learn more by extending the boundaries beyond what we recognise as being ‘normal’. Third, the optimum density will not only vary with the age of the trees but also with the water regime (rainfall amount and distribution/irrigation): water therefore should also ideally be a variable so that it is the water/density interaction that becomes the focus for the study, not density alone. In that way we may make progress.
When Salter and Goode (Reference Salter and Goode1967) reviewed the literature, virtually no research had been reported on the irrigation requirements of olive. It is only in the last 15–20 years that research has been undertaken. For example, of the 10 irrigation experiments on olive in Spain cited in a review by Ruiz-Sanchez et al. (Reference Ruiz-Sanchez, Domingo and Castel2010), all of the papers reporting the results had been published after 1996. Similarly, virtually all of the 17 papers reporting experiments on water productivity summarised below have been published since 2005. Here they are again reported under the country in which the research was undertaken in the following order: Spain, then Argentina, Australia, Israel, Italy, Morocco, New Zealand, Portugal, Tunisia and the United States.
Spain: In Spain, new irrigation developments are under close scrutiny because of chronic water shortages in many regions. If new water is to be allocated for the irrigation of olives, it is necessary to demonstrate the economic advantages of changing from rain-fed to irrigated cropping. To provide such evidence, Moriana et al. (Reference Moriana, Orgaz, Pastor and Fereres2003), in an excellent paper, described the results of an experiment in Cordoba, Spain (38°N 4.8°W; alt. 110 m) in which various deficit irrigation regimes were compared with rainfall-only and fully irrigated control treatments. The experiment was conducted between 1996 and 1999 in a mature 18-year-old olive orchard (cv. Picual, spaced 6 × 6 m = 278 trees ha−1), which had previously been rain-fed but which was irrigated from 1995 onwards. The annual rainfall totals over the five years, beginning in 1995, were 478, 1095, 1043 and 468 mm respectively. The soil was an alluvial sandy loam, over 2 m deep, with an available water capacity of 120 mm m−1. The trees were irrigated (drip) on five days each week. Detailed supporting measurements were made of actual ETc (ET; neutron probe), reference ETo (Penman–Monteith equation; daily weather data), stem water potential (pressure bomb), TDV (linear variable differential transformer), abaxial leaf conductance (transient porometer) as well as fruit and oil yields. The following observations were made:
• Actual water use (ET) varied between <500 mm (rain-fed) and about 900 mm (well-irrigated).
• Depending on the year and the season, ET in the deficit treatments varied between 0.60 × ETc and 0.80 × ETc for the well-irrigated treatment.
• Relative (to the well-irrigated control) maximum daily shrinkage of the trunk was a sensitive indicator of tree water status (for trees with a large fruit load).
• Stem water potentials at midday fell as low as –8 MPa in the rain-fed treatment, and to –7 MPa in the (regulated) deficit treatment (in which water was withheld during mid-summer, from 15 July to 15 September).
• By comparison, in the (sustained) deficit treatment in which the same cumulative deficit was applied progressively over a season the stem water potential never fell below –3.8 MPa.
• Virtually complete midday stomatal closure occurred during the summer/late summer in the rain-fed and regulated deficit treatments, respectively, especially in 1999.
• The maximum trunk diameter of well-irrigated trees with a low fruit load expanded more or less at a constant rate over a season, while the trunks of trees with a large fruit load grew at variable but slow rates. Trunks of trees in the deficit treatments actually shrank slightly.
• As a result of the biennial yielding habit of olive, yields for two years were combined to develop curvilinear relationships between yields (t ha−1) and ET (mm):
 \begin{eqnarray*}
{\rm For}\,{\rm oil} \\
\,\,\,Y &=& - 2.78 + 0.011{\rm ET} - 0.006 \times 10^{ - 3} {\rm ET}^2 , \\
R^2 & =& 0.59,\,{\rm n} = 23,\;p\,{<} \,0.001. \\
{\rm For}\,{\rm fruit} \\
\,\,Y &=& - 16.84 + 0.063ET - 0.035\, {\times} \,10^{ - 3} {\rm ET}^2 , \\
R^2 &=& 0.71,\,n = 23,\,p \,{<}\, 0.001.
\end{eqnarray*}
• Connor (Reference Connor2005) has re-plotted these data.
• Despite major differences in the levels of water stress experienced by trees in the two deficit irrigation treatments, there were no differences in yield between regulated (summer-concentrated) and sustained (progressive) stress. Both treatments were equally effective in reducing ET without a corresponding loss in yield.
• There was no evidence to support the idea of withholding irrigation in the alternate years when there is little or no fruit (an ‘off’ year), and concentrating the water in the productive year (an ‘on’ year).

Similarly, Iniesta et al. (Reference Iniesta, Testi, Orgaz and Villalobos2009) reported the results of a detailed, follow-up experiment at the same site in southern Spain. This time three treatments were compared, a control (fully irrigated) and two deficit treatments. These were as follows: (1) Sustained deficit irrigation: 25% of the quantity of water applied to the control was distributed proportionally throughout the irrigation season. (2) Regulated deficit irrigation: The same total quantity of water was applied overall, but irrigation was withheld from 1 July to 10–15 September (mid-summer). As in the experiment reported by Moriana et al. (Reference Moriana, Orgaz, Pastor and Fereres2003), the trees (cv. Arbequina: spaced 7 × 3.5 m = 408 trees ha−1) were irrigated (using drip irrigation) for five days a week. The experiment continued for three years, 2004–2006. The principal findings were as follows:
• Midday leaf water potentials did not fall below –1.7, –2.9 and –3.6 MPa in the control, sustained deficit and regulated deficit treatments respectively. The amount of water applied to the control treatment was based on the product of ETo (calculated from the Penman–Monteith equation) × Kc.
• In all three years, deficit irrigation reduced vegetative growth (shoot length by up to 50%, and number of leaves); deficit irrigation also reduced the rate of increase in canopy volume.
• Although the rate of increase in fruit volume was reduced during the dry season in both deficit treatments, compensatory growth occurred after the autumn rains began or when irrigation was resumed.
• Fruit yields were maximum in the fully irrigated control treatment, and were about 25% less in the deficit treatments (the result in particular of fewer fruit following a reduction in the number of leaf pairs and associated flower initiation points).
• Oil yields from both deficit treatments were similar, being 13–20% below those of the control. This reduction was less than that for fruit yield. The oil concentration was higher in the fruits harvested from the deficit treatments than from the well-watered control.
• Annual evapotranspiration (ET) totals were reduced by 30–35% in the two deficit treatments (from c. 1000 mm, the control, to 600–700 mm, both deficit treatments). The corresponding transpiration (T) totals were 700 mm and 350–380 mm, a reduction of 45–50%.
• By comparison, intercepted solar radiation was reduced by only 18–20%, which implies that there was stomatal closure to conserve water.
• The amount of oil produced per unit of intercepted solar radiation was similar for all treatments, averaging 0.16 g MJ−1.
• For the control treatment, water productivity, based on the averages for two years (2004–2005 and 2005–2006) was 4.5–5.0 kg (olive oil) ha−1 mm−1 (irrigation water applied). The corresponding values for the two deficit treatments were about three times greater, at between 13 and 17 kg ha−1 mm−1.
• When based on ET, water productivities, for 2005–2006 only, were 2.4 kg (oil) ha−1 mm−1 (the control) and 3.0 kg ha−1 mm−1 (both deficit treatments), an increase of 25%.
• The corresponding values for transpiration alone were 3.4 (the control) and 5.5 kg (oil) ha−1 mm−1 (both deficit treatments), an increase of 62%.
• Alternate bearing and the initial variability in canopy volume and fruit load complicated a similar analysis of fruit yields. Deficit irrigation delayed fruit ripening.
In the two deficit irrigation experiments reported by Martín-Vertedor et al. (Reference Martín-Vertedor, Rodríguez, Losada and Castiel2011b), and described above, water stress reduced average yields of fruit in direct proportion to the reduction in transpiration:
 \begin{equation*}
{\rm Y} = 1.23{\rm T} - 21.2,\end{equation*}
A linear relationship was also obtained between fruit yield (y) from individual ‘on’ trees (range 5–45 kg tree−1) and the estimated annual transpiration (t) of each tree (range 200–500 mm):
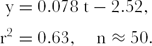 \begin{eqnarray*}
{\rm y} &=& 0.078\;{\rm t} - 2.52, \\
{\rm r}^2 &=& 0.63,\quad {\rm n} \approx 50.
\end{eqnarray*}
A long-term (nine-year, 1998–2006) irrigation experiment in southern Spain (37.28°N 4.26°W) failed to show significant yield responses to irrigation (applied daily by drip) in individual years (Melgar et al., Reference Melgar, Mohamed, Navarro, Parra and Benlloch2008). But when fruit yields (cv. Picual, spaced 7 × 7 m = 204 trees ha−1) were aggregated over nine years, there was a significant 25% yield benefit over the rain-fed control treatment. This was equivalent to an average yield increase of about 10 kg tree−1 each year. There was no additional benefit from applying 20% more water than the estimated soil (clay loam) water deficit indicated. ETc was estimated using the Doorenbos and Pruitt (Reference Doorenbos and Pruitt1974) method with appropriate values for Kc and Kr (based on the area of soil shaded by the canopy). There was little evidence of biennial bearing with cv. Picual. Since the yield benefits were small (the trees had a relatively small canopy), the authors did not consider irrigation to be justified in this location where the average annual precipitation was 700 mm and ETo was 1250 mm.
Argentina: In a follow-up experiment to that reported by Rousseaux et al. (Reference Rousseaux, Figuerola, Correa-Tedesco and Searles2009), and described above, the growth and yield responses of six-year-old trees to five sustained deficit irrigation treatments (Kc = 0.50, 0.70, 0.85, 1.0 and 1.15 × ETo) were monitored by Correa-Tedesco et al. (Reference Correa-Tedesco, Rousseaux and Searles2010) over two years, 2005–2007. The aim was to specify a locally derived value for Kc which could be used to calculate ETc. The experiment was conducted in the same commercial context, and on the same site in north-west Argentina, with the same cultivar (Manzanillo fina) planted at the same density (312 trees ha−1) as described by Rousseaux et al. (Reference Rousseaux, Figuerola, Correa-Tedesco and Searles2009).
Vegetative growth increased with the quantity of water applied (up to Kc = 1.0 to 1.15), while the yield of fresh fruit peaked with less water, Kc = 0.7 to 0.85. When Kc was below 0.7, fruit yields were reduced following a reduction in fruit number. Since excess vegetative growth can cause management problems in the orchard, it is preferable to avoid excessively large trees. These are difficult to harvest, and need to be pruned frequently. As a result of this research, the advice offered to growers in north-west Argentina by Correa-Tedesco et al. (Reference Correa-Tedesco, Rousseaux and Searles2010) was to plan irrigation assuming a Kc value of 0.70 in the main growing season of September to May. In this way fruit yields would be maximised without creating excess vegetation. The water productivities (irrigation water applied) for fresh fruit obtained in the second year of the experiment ranged between 14 and 21 kg ha−1 mm−1.
Australia: In their study of water use on four commercial olive orchards in South Australia, Nuberg and Yunusa (Reference Nuberg and Yunusa2003) calculated the water productivity (fresh fruit) of all four orchards. Yields varied considerably from site to site and from year to year (from 1600 to 20,700 kg ha−1). The corresponding water productivities varied accordingly, from 2.2 to 32 kg ha−1 mm−1 (based on ET), and from 3.6 to 49 kg ha−1 mm−1, when based on transpiration. For individual trees, water productivities varied from 0.4 to 2.1 g L−1 (ET) and from 0.9 to 2.8 g L−1 (T).
Israel: On the coastal plain of Israel, the effects of the timing of water applications, relative to the stage of growth, on fruit and oil yields were evaluated in a four/five-year study (Lavee et al., Reference Lavee, Honoch, Wodner and Abramowitch2007). There were nine treatments, the two extremes being full irrigation (537 mm applied), and rain-fed only (no irrigation). The other seven regulated deficit treatments all had half the maximum amount of water applied (264 mm), but the timing varied during the season (from 14 April to 15 December), according to the pre-determined schedule. When water was needed, it was applied at weekly intervals by drip irrigation, the soil was a sandy loam and the cultivar (Muhasan) was five-year old at the start of the experiment, spaced at 4 × 7 m (=357 trees ha−1).
Irrigation increased the annual yield of fresh fruit, averaged over four years, which included two ‘on’ years and two ‘off’ years, from 7.2 kg tree−1 (rain-fed) to 39.2 kg tree−1 (fully irrigated). The yields from the deficit treatments were all similar at 25–26 kg tree−1. The best of these was the one in which all the water was applied between mid-July (after pit (stone) hardening had ended) and mid-October (two weeks prior to harvest), which yielded 32 kg tree−1. Full irrigation increased the individual mean fresh fruit mass from 1.8 to 5.1 g. The figures for oil yield were 1.1 (rain-fed), 4.4 (full irrigation), 3.7 (average of six deficit treatments) and 3.9 kg tree−1 (the best deficit treatment). The oil content figures were 15.1, 11.3, 13–14 and 12% of the fresh weight respectively. Note that the reduction in oil concentration in the well-irrigated treatment was more than compensated for by the increase in fresh weight of the individual fruit. Irrigation delayed ripening (Lavee et al., Reference Lavee, Honoch, Wodner and Abramowitch2007). These conclusions are very similar to those reached nearly 50 years earlier, also in Israel, by Samish and Spiegel (Reference Samish and Spiegel1961).
In summary, a 50% reduction in the amount of water applied only reduced fruit yield by 19% and oil yield by 13%. This implies that it is ‘better’ to plant twice the area of land and apply half the theoretical quantity of water needed to obtain maximum total yield than to irrigate fully a smaller area. The success or otherwise of this approach to improving water productivity in this or similar locations is dependent on the amount and timing of winter rainfall, and the water storage properties of the soil (Lavee, et al., Reference Lavee, Honoch, Wodner and Abramowitch2007).
Italy: In a brief paper, Sebastiani et al. (Reference Sebastiani, Michelazzo, Morelli, Lavini and Tognetti2012) summarised the results of a trial in southern Italy (41°06′N 14°43′E; alt. 250 m) in which deficit irrigation (drip) was applied over the period from the beginning of pit hardening (when the fruit had reached half its final size) to when it had achieved its final size and started to change colour (known as veraison). Yields of dry fruit over two seasons (2006 and 2007) increased with the increase in the depth of water applied, up to 100% replacement of ETc. Yields from cv Frantolo were greater than those from cv. Leccino at all four watering levels (rain-fed, 0.33, 0.66 and 1.0 × ETc). Yield differences were due to larger individual fruits. The percentage oil content was similar at all watering levels. The main advantage of deficit irrigation scheduling was the improved control of vegetative growth without a corresponding reduction in fruit yield. Tognetti et al. (Reference Tognetti, d'Andria, Lavini and Morelli2006) had earlier reported similar results from experiments conducted in 2003 and 2004 with the same treatment combinations.
The long-term effects of deficit irrigation on vegetative growth, flowering and yield components of young olive trees grown in a high-density orchard for oil production were investigated by Caruso et al. (Reference Caruso, Rapoport and Gucci2011) at the University of Pisa (43°01′N 10°36′E). Different irrigation regimes were imposed from the fourth year after planting (in 2003) through the onset of fruit production (2006) until the trees had reached full production (2009). The trees (cv. Frantoio) were planted at a density of 513 trees ha−1. All were uniformly irrigated (drip irrigation) from 2003 until 2006 when differential treatments were first imposed from July to October. The key observations over the course of this experiment were as follows:
• Water applications to the fully irrigated treatment were calculated as follows: ETc = Kc × Kr × ETo, where Kc = 0.55 and Kr = 0.60, 0.80, 0.90 and 1.00 in 2006, 2007, 2008 and 2009 respectively.
• Applying about 50% less water (0.5 × ETc) than was applied to the fully irrigated treatment (1.0 × ETc) reduced the yield of fresh fruit over the four years by about 32%, but the oil by only 18%. These relative values are similar to other values cited by Caruso et al. (Reference Caruso, Rapoport and Gucci2011).
• The oil content declined at very high water stress levels but not at low stress levels (pre-dawn leaf water potentials down to –5.2 MPa and at 50% depletion down to –2.8 MPa). Citing others, the researchers noted that the oil content of the fruit is also influenced by the number of fruit on the tree, a condition that seems to interact with the irrigation level.
• When yield per tree was expressed as the ratio of tree yield to the cross-sectional area of the trunk, the fully irrigated treatment and the 50% deficit treatments were judged to have similar yield efficiencies.
• Vegetative growth was reduced by about 10% in the 50% deficit treatment. No delay was observed in the onset of fruit production. Trees produced a full crop in 2006.
• The researchers concluded that, starting from the onset of fruiting, deficit irrigation is a sustainable practice that can be used for oil production. The effect on tree size is important for modern olive growing. Deficit irrigation for table olives is not recommended.
Morocco: In a companion paper to Centritto et al. (Reference Centritto, Wahbi, Serraj and Chaves2005), the effects of partial root-zone drying on growth, yield and water productivity of olive trees (cv. Picholine marocaine) at the same arid site in southern Morocco were described by Wahbi et al. (Reference Wahbi, Wakrim, Aganchich, Tahi and Serraj2005). The experiments covered two years, one of which was an ‘off’ year (2002) and the other an ‘on’ year (2003). Yields of fresh fruit in both years were similar to those in the control drip-irrigated treatment (1.0 × ETc replacement, where ETc = 0.7 ETo – derived from a USWB Class A pan), and in the treatment in which the same quantity of water (1.0 × ETc) was applied every two weeks, but on alternate sides of the tree. Both these treatments out-yielded the two other partial root-zone drying treatments. In these two other treatments, both of which also had similar yields, only half the quantity of water was applied (0.5 × ETc) either alternating every two weeks or every four weeks on each side of the tree. Average yields in year 1 in the control treatment were 35 kg tree−1 compared with 27 kg tree−1 for 50% replacement, and in year 2 these were 90 kg tree−1 and 77 kg tree−1 respectively. The total volumes of water applied (including 57 mm rain) over the growing seasons were 23 m3 tree−1 year−1 (1.0 × ETc) and 11.5 m3 tree−1 year−1 (0.5 × ETc). The corresponding water productivities as presented were 16 and 24 kg ha−1 mm−1 (year 1) and 40 and 67 kg ha−1 mm−1 (year 2). The yield advantage was mainly due to an increase in fruit number. There were no differences in the percentage oil content. Since there was no direct comparison with a regulated deficit irrigation treatment, it is not possible to judge the effectiveness of partial root-zone drying, as was the intention in this experiment.
Portugal: Ramos and Santos (Reference Ramos and Santos2010) reported the results of another regulated deficit irrigation experiment, this time with the emphasis on quantifying the likely commercial risk to farmers of converting low-density (<100 trees ha−1), rain-fed, traditional (80+ years old) orchards to a higher tree density, irrigated orchard. The risk to the Alentejo region of southern Portugal (38°05′N 07°17′W; alt. 75 m) was perceived by the olive industry to be a reduction in quality leading to a loss of the ‘protected designation of origin’ seal of quality status within the European Union and the benefits that went with that attribute. In a comparison of four treatments (cv. Cordovil; 70 trees ha−1) over two years (2006 and 2007), the sustained deficit treatment (0.60 × ETc) yielded about 50% more oil (year 1, 970 kg ha−1; year 2, 200 kg ha−1) than the fully irrigated treatment (650 and 120 kg ha−1) despite receiving 49% less water. Biennial bearing is self-evident in these figures: it was even more pronounced in the two drier treatments. The corresponding water productivity values in 2006 and 2007 were 2.2 and 0.4 kg (oil) ha−1 mm−1 (irrigation), and 0.7 and 0.1 kg ha−1 mm−1 for the sustained deficit and fully irrigated treatments respectively. There was no significant adverse effect of any of the three irrigation treatments, compared with the rain-fed control, on the numerous chemical and sensory characteristics of the oil nor on its commercial value, which could still be classified as ‘extra virgin’. The regulated deficit irrigation treatment, in which water was only applied before flowering, at the beginning of pit hardening, and before crop harvesting, was less successful than expected. The timing of the irrigation in this treatment resulted in a net accumulation of leaves and fewer flowers in one year, which limited production in the following year (Ramos and Santos, Reference Ramos and Santos2010).
Ancillary measurements made during the course of the experiment showed that the pre-dawn leaf water potential fell just below –1.0 MPa in both the well-irrigated and the sustained deficit treatment. Midday values for both these treatments were in the range –2.35 to –2.85 MPa. A decline in stomatal conductance during the middle of the day, even when the soil was wet, was associated with large saturation deficits of the air. These sometimes reached 5.5 kPa.
Tunisia: The effect of irrigation on the quality of the olive fruit and its oil (cv. Arbequina) was evaluated in some detail by Dabbou et al. (Reference Dabbou, Chehab, Faten, Dabbou, Esposto, Selvaginni, Taticchi, Servili, Montedoro and Hammami2010) in northwestern Tunisia (36°18′N 09°07′E; alt. 500 m), where the average annual rainfall is 450 mm. Three irrigation regimes were compared: 0.5 × ETc, 0.75 × ETc and 1.0 × ETc. The fresh weight of individual fruits was similar across the three treatments. In the case of the oil, the irrigation regime had little effect on free acidity or peroxide values. Irrigation increased the palmitic acid content, but reduced the content of oleic and linoleic acids. These are all fatty acids. Differences were observed in the content of phenolic compounds in the oil, but the concentration of alpha-tocopherol was unchanged. In general, irrigation had a positive effect on fresh fruit quality and oil content.
United States (California): A deficit irrigation experiment, with seven drip-irrigated watering treatments (ranging from 0.15 to 1.40 × ETc) was conducted over two seasons (2002 and 2003) in the Sacramento Valley (39°30′N 121°34′W; Grattan et al., Reference Grattan, Berenguer, Connell, Polito and Vossen2006). The plant density was very high (1700 trees ha−1; cv. Arbequina). Fruit yields increased with the depth of irrigation water applied (range 50–600 mm) in the second-order relationship (R 2 = 0.79–0.99). By contrast, the oil content of the fruit (% fresh weight) declined linearly with the quantity of water applied. This meant that there was a broad plateau in the oil yield response curve to water applied (from 200–500 mm; 0.40–0.90 × ETc) for oil. All the irrigation treatments produced oil of very high quality.
In an advisory leaflet for growers in California, where olives are grown primarily for the table, Wheeler et al. (Reference Wheeler, Grattan, Goldhamer, Schwankl and Vossen2008) interpreted the results of a regulated deficit irrigation experiment conducted over four years in the San Joaquin Valley (cv. Manzanillo; density 239 trees ha−1) and reported by Goldhamer (Reference Goldhamer1999). When grown for the table, individual fruit size is as important as yield. The recommendation was, if possible, to provide enough water to replace all the water lost by transpiration and evaporation (1.0 × ETc, where ETc = 0.75 × ETo).
There were no yield or financial benefits from applying extra water. If there was insufficient water (mild deficit) available for irrigation, the recommendation was to reduce the quantity of water applied by 50% through mid-summer (that is from mid-June to the end of July), a water saving of 13%. If the deficit was greater than this (moderate deficit), the duration of 0.5 × ETc deficit irrigation could be extended by four weeks from the beginning of June to mid-August, a saving of 21% (equivalent to about 200 mm water ‘saved’ each year). If the water shortage was even greater (severe deficit), the period of deficit irrigation (50%) could then be extended from mid-May to mid-September, but with even less water applied (only 25% of the full water requirement) between mid-June and mid-August (a 40% saving, or 400 mm). The severe deficit treatment resulted in a 10% reduction in yield, and a 25% reduction in the gross revenue, following a substantial reduction in fruit size. This made it uneconomic to produce table olives under these conditions in California. This is an example of the practical application of regulated deficit irrigation. It is assumed that when the crop cover reaches 50%, potential ET (1.0 × ETc) is reached.
In contrast, growers of olives intended for oil who are short of water for irrigation are advised not to exceed a 30% reduction in the water applied (0.70 × ETc). Applying less water than this may reduce oil yields to the point that production in California becomes uneconomic, although oil quality is maintained.
Summary: water productivity
1. Numerous experiments have been done to compare the effect of sustained deficit irrigation and regulated deficit irrigation with rainfall only and/or fully irrigated control treatments.
2. This is in response to the international need for evidence to justify using scarce water supplies to irrigate olives, traditionally a rain-fed crop.
3. A confounding factor in this work is the wide disparity in the tree densities (from <100 to >1000 trees ha−1) represented.
4. No one appears to have looked systematically at the interaction between soil water availability and tree density in olive orchards.
5. Other complications include biennial bearing, and initial variability in tree size, canopy volume and fruit load. For comparative purposes, trees with similar properties need to be selected.
6. With deficit irrigation experiments it is always necessary to specify the control (100% replacement of ETc) treatment with precision, as this defines the benchmark against which other treatments are judged.
7. Deficit irrigation (when supply is less than ETc) limits vegetative growth; this is particularly important for tree management (Spain, Argentina and Italy).
8. Deficit irrigation also slows the rate of fruit expansion. Fruit yields peak with less than full replacement of water (when Kc = 0.7–0.85). Compensatory fruit growth occurs when the rains begin or when irrigation is resumed. Fruit number is reduced when Kc < 0.7. (Argentina and Spain).
9. Oil yield is reduced less than fruit yield for a given irrigation deficit. The quantity of oil produced per unit of intercepted solar radiation is the same regardless of treatment (Spain).
10. There is no convincing evidence that the timing of regulated deficit irrigation is important; fruit yields are proportionate to the amount of water applied (Israel).
11. Similarly, there is no evidence (from one experiment only) that there are any benefits from partial root-zone drying (Morocco).
12. Fruit yields under sustained deficit irrigation are similar to those from regulated deficit irrigation (mid-summer): deficit irrigation delays ripening compared with full irrigation.
13. There is no evidence of an adverse effect of irrigation on oil quality (Portugal) and there can be a net benefit (Tunisia). Reduction in oil concentration in well-irrigated fruits is more than compensated for by increase in fresh weight (Spain, Israel and USA). Sometimes, the oil concentration does not change (Italy and Morocco).
14. Water productivities are summarised in Table 3. Curvilinear relations were developed between yields of both fresh fruit and oil (Y, t ha−1) over two years and ET (mm) (Spain).
Summary table showing yield (oil and fresh fruit) responses to water (kg ha−1 mm−1) in terms of total depth of irrigation water applied (I), or the equivalent totals for evapotranspiration (ET) and transpiration (T).

Water productivity: FAO reconciliation
In the FAO Irrigation Drainage Paper 33, Doorenbos and Kassam (Reference Doorenbos and Kassam1979) gave a value for water productivity of fresh olives (30% water content) of 15–20 kg ha−1 mm−1. The corresponding figures for oil were 0.3–0.5 kg ha−1 mm−1. In the recent FAO Paper 66, the (relative) fruit yield response curve to (relative) ET developed in Spain by Moriana et al. (Reference Moriana, Orgaz, Pastor and Fereres2003) was found, within the margins of error, to fit data for other cultivars and locations (Fereres, Reference Fereres, Goldhamer, Sadras, Steduto, Hsiao, Fereres and Raes2012). For relatively small applications of water (100–150 mm), the water productivity was about 30 kg ha−1 mm−1, for example at replacements between 0.5 × ETc and 0.8 × ETc, but the yield response then tapered off rapidly between 0.8 × ETc and 1.0 × ETc.
IRRIGATION SYSTEMS
The following topics are considered under this heading: irrigation water quality and salinity, irrigation strategies when water supplies are restricted, irrigation scheduling and irrigation methods. The emphasis is on new or novel approaches specific to olives.
Water quality
The olive tree is traditionally considered to be moderately tolerant of salinity (e.g. Ayers and Westcot, Reference Ayers and Westcot1985; Maas and Hoffman, Reference Maas and Hoffman1977), a view that has been largely confirmed by the results of a long-term (1998–2006) field experiment in Spain (37.28°N 4.26°W). This was designed to assess the effect of low-quality irrigation water on the growth and yield of the olive tree. Irrigation water with three levels of salt concentration (0.5, 5 or 10 dS m−1, mixtures of sodium chloride and calcium chloride) was applied to mature olive trees (cv. Picual; spacing 7 × 7 m = 204 trees ha−1) by daily drip irrigation during the summer months for nine years (Melgar et al., Reference Melgar, Mohamed, Serrano, García-Galavís, Navarro, Parra, Benlloch and Fernández-Escobar2009). In addition, there were two irrigation regimes, one in which the soil was maintained close to field capacity and another in which 20% extra water was applied (a leaching fraction) to wash out any salts from the soil.
Numerous growth parameters were monitored throughout that extended period but no differences between treatments were identified. The only exception was that the oil content (on a fresh weight basis) increased (significantly) by two to three percentage points with the increase in salt content of the irrigation water in four of the nine years. It was considered that in areas with similar rainfall amounts (long-term average c. 700 mm) and distribution (mainly during the winter, only c. 30 mm from June to September, inclusive) it is possible to use saline water (up to 10 dS m−1) to irrigate olive trees. The wisdom of this advice is constrained by the view that the cultivar used in this experiment (cv. Picual) is relatively salt-tolerant compared with the many other genotypes that are grown commercially (Melgar et al., Reference Melgar, Mohamed, Serrano, García-Galavís, Navarro, Parra, Benlloch and Fernández-Escobar2009).
A great deal of research has been undertaken on the mechanisms of salt tolerance in olive, and why cultivars differ in their responses. Much of the work has been done on seedlings under controlled conditions (e.g. see Cimato et al., Reference Cimato, Castelli, Tattini and Traversi2010; Gucci and Tattini, Reference Gucci and Tattini1997) and its relevance to long-term field conditions is uncertain. A recent paper described the responses of two contrasting mature cultivars (Barnea, salt tolerant, and Proline, salt sensitive) to the application of saline water (drip irrigation) over a period of 11 years. The tolerance of cv. Barnea to salinity was believed to be associated with the relatively large mass of fine roots that developed around the emitters (compared with cv. Proline). This enabled water uptake to occur under high evaporation rates despite the saline conditions (Rewald et al., Reference Rewald, Rachmilevich, McHue and Ephrath2011).
Another aspect of water quality as it affects olives involves its role in disease transmission. A recent study in southern Spain has confirmed that irrigation water plays a part in the dispersal of the Verticillum wilt disease of olive (García-Cabello et al., Reference García-Cabello, Pérez-Rodriguez, Blanco-López and López-Escudero2012). This threatening disease (Verticillium dahliae Kleb) is particularly prevalent in the Guadalquivir Valley where there are 1.5 million ha of olive orchards, of which about 240,000 ha are irrigated. Verticillium is a threat to the olive industry worldwide as a result of the conversion of rain-fed orchards to irrigation. The pathogen survives in the sediment and is distributed in soil and plant particles suspended in the irrigation water. It has been found in all the components of the irrigation water distribution system, from the pumping station, through the main canal to the soil surrounding the emitters on a drip irrigation lateral pipe. Other crops within the irrigation schemes (e.g. cotton) act as hosts to the disease.
Irrigation strategies
There are three ‘deficit irrigation’ strategies that have been used successfully with olives (Fereres, Reference Fereres, Goldhamer, Sadras, Steduto, Hsiao, Fereres and Raes2012): First, ‘sustained deficit irrigation’, in which the planned deficit is spread evenly over the season; second, ‘regulated deficit irrigation’, when the deficit is concentrated in the summer months (e.g. from pit hardening to the end of the summer); third, alternating short cycles of water stress and relief depending on the growth stage. As Fereres (Reference Fereres, Goldhamer, Sadras, Steduto, Hsiao, Fereres and Raes2012) stated, and as this review confirms, there is no evidence of the superiority of one strategy over another, it all depends on local circumstances and the need to limit the amount of water used. Where the irrigation system is the limiting constraint, any one of these strategies could be implemented. For soils with low water availability, regulated deficit irrigation is likely to work better than sustained or continuous deficit irrigation. This is also probably the most appropriate strategy in years with well-distributed late summer rainfall, or when there is a shortage of water delivered to the farm. In general, and particularly in years with no summer or early autumn rainfall (as can often occur in southern Portugal, for example) the sustained deficit irrigation regime may be the better option for scheduling irrigation (Ramos and Santos, Reference Ramos and Santos2009). A contributing factor to decision-making is the capacity of olive trees to extract substantial quantities of water early in the season, where there is winter rainfall, from inter-row areas away from the strips of land wetted by drip irrigation.
Irrigation scheduling
Fereres et al. (Reference Fereres, Villalobos, Orgaz and Testi2011) expressed their surprise that olive tree growers had not used the water budget method more widely for irrigation scheduling despite its simplicity. One difficulty is in quantifying the volume of available water within the extensive root zone and, with that knowledge, specifying the allowable soil water deficit. This challenge is due in part to the spatial variability in soil physical properties, and in particular to the largely unknown depth and distribution of the effective roots of olive trees. Fereres et al. (Reference Fereres, Villalobos, Orgaz and Testi2011) also made the point that the olive has the capacity to extract water from soils at water potentials below the generally accepted lower limit of available water (permanent wilting point). This could be significant in fine textured soils but not in sands. The allowable soil water deficit probably also varies with the stage of crop development, with the flowering and fruit set stages being particularly sensitive to water stress.
Monitoring the changes in the maximum daily shrinkage of the trunk of a tree with a dendrometer has been proposed as a possible way of automating the irrigation scheduling of trees, including olive. For this method to work, baseline reference values for trees well supplied with water are a prerequisite so that the influence of other climatic variables can be taken into account. Moreno et al. (Reference Moreno, Canejero, Martin-Palomo, Girón and Torrecillas2006) undertook such an analysis over 104 summer days during 2005 in southern Spain. For mature well-irrigated trees (cv. Manzanillo), the maximum daily shrinkage was closely correlated with the reference crop ETo (range maximum daily shrinkage 0.2–0.9 mm d−1, ETo 3–9 mm d−1; r2 = 0.55, n = c. 90), with the saturation deficit of the air and temperature recorded at midday being the most important individual weather variables (range saturation deficit 1–6 kPa, r2 = 0.83; temperature 24–38 °C, r2 = 0.79).
In an interesting comparison of how sap flow measurements and models of plant transpiration could be best used to schedule irrigation in four fruit crops, including olive, Fernández et al. (Reference Fernández, Green, Caspari, Diaz-Espejo and Cuevas2008) concluded that the transpiration ratio method offered the best approach. This is defined as the ratio of the actual daily water use divided by the potential daily water use of similar plants under non-limiting soil water conditions. Actual water use could be measured using sap flow techniques, while potential water use was best estimated using a modelling approach, provided that it could be simplified so that it became a realistic practical option in commercial orchards. They dismissed the use of the ‘sap velocity profile’ method, proposed by Fernández et al. (Reference Fernández, Palomo, Diaz-Espejo, Clothier, Green, Girón and Moreno2001) and Nadezhdina et al. (Reference Nadezhdina, Nadezhdin, Ferreia and Pitacco2007), as it was too insensitive to be a reliable indicator of when to irrigate.
In order to determine the potential for variations in stem diameter to be used for scheduling irrigation in commercial orchards, Fernández and Cuevas (Reference Fernández and Cuevas2010) undertook a comprehensive review of the research literature. They urged caution for the following reasons: stem diameter variability is affected by many other factors other than water stress, including seasonal growth patterns, weather, crop load and plant age and size, which all require expert interpretation; the relationship between stem diameter variability and stem water potential is not always straightforward; there is considerable plant-to-plant variation, which may not always be compensated for by sensitivity analysis. The installation and maintenance of sensors must also be of the highest standards to avoid erroneous readings. Although the reliability of this method can be improved if it is combined with other plant stress indicators, such as sap flow in the case of olive, variation in stem diameter is not yet robust enough to be used as the primary indicator of when to irrigate a commercial orchard.
Irrigation method
Given the scarcity of water in most olive growing areas, and the variable tree densities that exist, the choice of irrigation method is limited to those methods that can apply water (and nutrients) uniformly, close to the tree with minimum waste. Both drip (trickle) and micro-sprinklers have the potential for precision irrigation, provided they are well managed. In nearly all the experiments reported in this paper, one of these two methods, usually drip, has been used with apparent success.
Practical issues associated with the planning and selection of irrigation systems suitable for olive orchards are well described in a report by the International Olive Council (IOC, 2007).
CONCLUSIONS
After being grown as a subsistence crop for several thousand years in dry areas around the Mediterranean basin, the humble olive tree has suddenly become the centre of attention. This renewed interest is in response, in part, to the perceived health benefits of olive oil, which has increased demand and improved the profitability of the crop. As a result, the crop is now being promoted and grown in countries away from the Mediterranean where the climate is different, in particular rainfall amount and distribution. This includes countries in the so-called ‘New World’, including Argentina, Australia, California, Chile and New Zealand. These producers as well as progressive growers in the traditional areas of production are prepared to review and revise the crop husbandry practices normally associated with the crop. This has led to fundamental changes in field agronomy, including increases in tree densities, the introduction of irrigation and the development of novel ways of training the tree in order to facilitate mechanical pruning and harvesting. This intensification has all occurred in the last 20 years or so (out of the last 5000 years!). It has been supported by the contributions from international scientists who have not only evaluated the practical implications of these changes in traditional orchard management systems but have also been able to obtain the resources needed to research the basic science, which is important for the longer term future of the industry. Perhaps the most important driving force to innovation has been the introduction of mechanical harvesting.
Interest in the crop by scientists in recent years has resulted in a proliferation of publications. For example, of the 100 plus publications reviewed in this paper, about 70 (70%) have been published since 2004, and this is not a complete list. A common theme has been the priority given by researchers (and their paymasters) to finding ways of minimising the amount of irrigation water needed given the scarcity of water in many of the regions where olives are grown. The concept of regulated deficit irrigation has been the subject of much research in several countries. Indeed, it has become a fashion or ‘scientific bandwagon’, resulting in some unnecessary duplication of effort, and not just for olive trees. The quality control of some peer-reviewed journals has to be questioned. Even after all this work, it is not immediately clear from this review what is the best water management practice for growers to adopt under specific conditions, although micro-irrigation allows the control, in time and space, which precision irrigation of this type requires. Perhaps the proliferation of papers has confused the situation more than it has been enlightened. This is not to underestimate the significant advances made in our understanding of water management in olive orchards in the last three decades.
The olive has many of the physiological attributes that allow plants to survive for many years and to remain productive in environments with low and variable rainfall. Some of these processes are understood, others less so. No doubt, low input, low output systems of production will continue alongside the intensive orchards, and the research priorities for each system will differ. For low input systems the priorities will continue to be to identify cultivars, and orchard management practices, that are outstanding in terms of water productivity. As Connor (Reference Connor2005) stated, ‘strategic decisions are the selection of cultivar, tree density and canopy size, together with surface management as tilled soil or as cover crop of selected species’. Alongside these decisions are the tactical day-to-day adjustments needed on tree pruning and understorey management. These will depend on the rainfall amount and its distribution, especially after dry winters and during dry summers.
Perhaps high-density (hedgerow), irrigated olive orchards, formed to suit mechanical pruning and harvesting, are the future. To quote Connor et al. (Reference Connor, Loomis and Cassman2011), ‘the challenge is to optimize the structure of new olive orchards, modify existing suboptimal orchards and to develop canopy management systems to maintain the optimal structure once it has been defined’. Water management research will play an essential role in this process as the industry continues to develop from its 5000-year-old historic roots.
Acknowledgements
I thank Professor Elias Fereres for his valuable contribution to the draft of this paper, and two anonymous referees for detailed and constructive advice.