1. Introduction
At the end of the Permian Period, the largest extinction event occurred in Phanerozoic history (Renne et al. Reference Renne, Black, Zhang, Richards and Basu1995; Erwin, Reference Erwin2006; Chen & Benton, Reference Chen and Benton2012; Fan et al. Reference Fan, Shen, Erwin, Sadler, MacLeod, Cheng, Hou, Yang, Wang, Wang, Zhang, Chen, Li, Zhang, Shi, Yuan, Chen, Zhang, Li and Zhao2020). The Permian extinction marked the end of the Palaeozoic Era, when an estimated 95% of marine species and 75% of terrestrial species completely disappeared, accompanied by dramatic changes in the global environment, climate and even life on Earth (Jin et al. Reference Jin, Wang, Wang, Shang, Cao and Erwin2000; Erwin, Reference Erwin2006; Burgess et al. Reference Burgess, Bowring and Shen2014). As one of the areas with the most intact and abundant Permian–Triassic marine stratigraphic records and fossil records, the Yangtze Platform attracts considerable scientific research interest (Nicoll et al. Reference Nicoll, Metcalfe and Wang2002; Tong & Yin, Reference Tong and Yin2002; Tong et al. Reference Tong, Zhang, Zuo and Xiong2007; Weidlich & Bernecker, Reference Weidlich and Bernecker2007). The Yangtze Platform contains not only the Global Stratotype Section and Point (GSSP, ‘Golden Spike’) for the Permian–Triassic Boundary (PTB) but also intact PTB sedimentary sequences and distinct facies belts, thus providing an opportunity to clarify biological evolution under different environmental conditions (Yin et al. Reference Yin, Zhang, Tong, Yang and Wu2001).
Microfacies analysis and sedimentary environments of Permian–Triassic carbonates have been the subject of previous studies in various parts of the Upper Yangtze Platform of SW China (Wignall et al. Reference Wignall, Hallam, Lai and Yang1995; Wang et al. Reference Wang, Tong, Wang and Zhou2005; He et al. Reference He, Wang, Yang, Liao and Weng2010). For example, in the altered ash beds of the Upper Yangtze Hong et al. (Reference Hong, Algeo, Fang, Zhao, Ji, Yin, Wang and Cheng2019) distinguished four facies associations (lacustrine facies, mixed marine–terrestrial and swamp facies, shallow-marine and littoral facies, and deep-marine facies). Shao et al. (Reference Shao, Liu, Tian and Zhang1998) analysed the facies changes on the carbonate platform of the Changhsingian Upper Yangtze Platform and described six depositional environments: tidal flat of restricted platform, subtidal zone of restricted platform, open platform, platform margin shoal, platform margin reef and aulacogenic basin. Chen et al. (Reference Chen, Lu, Fu, Xing, Wang and Luo2017 b) noted that Permian reef complexes on the northern margin of the platform evolved into oolitic shoal complexes during the Early Triassic Epoch and presented two facies associations, including the centre and flanks of the shoal complexes.
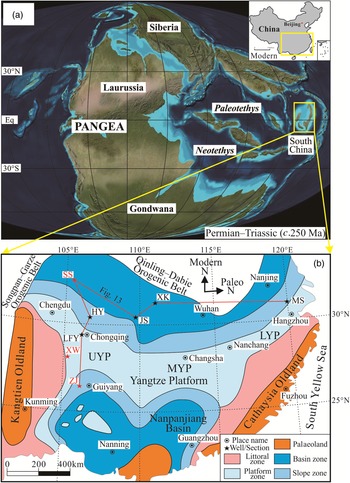
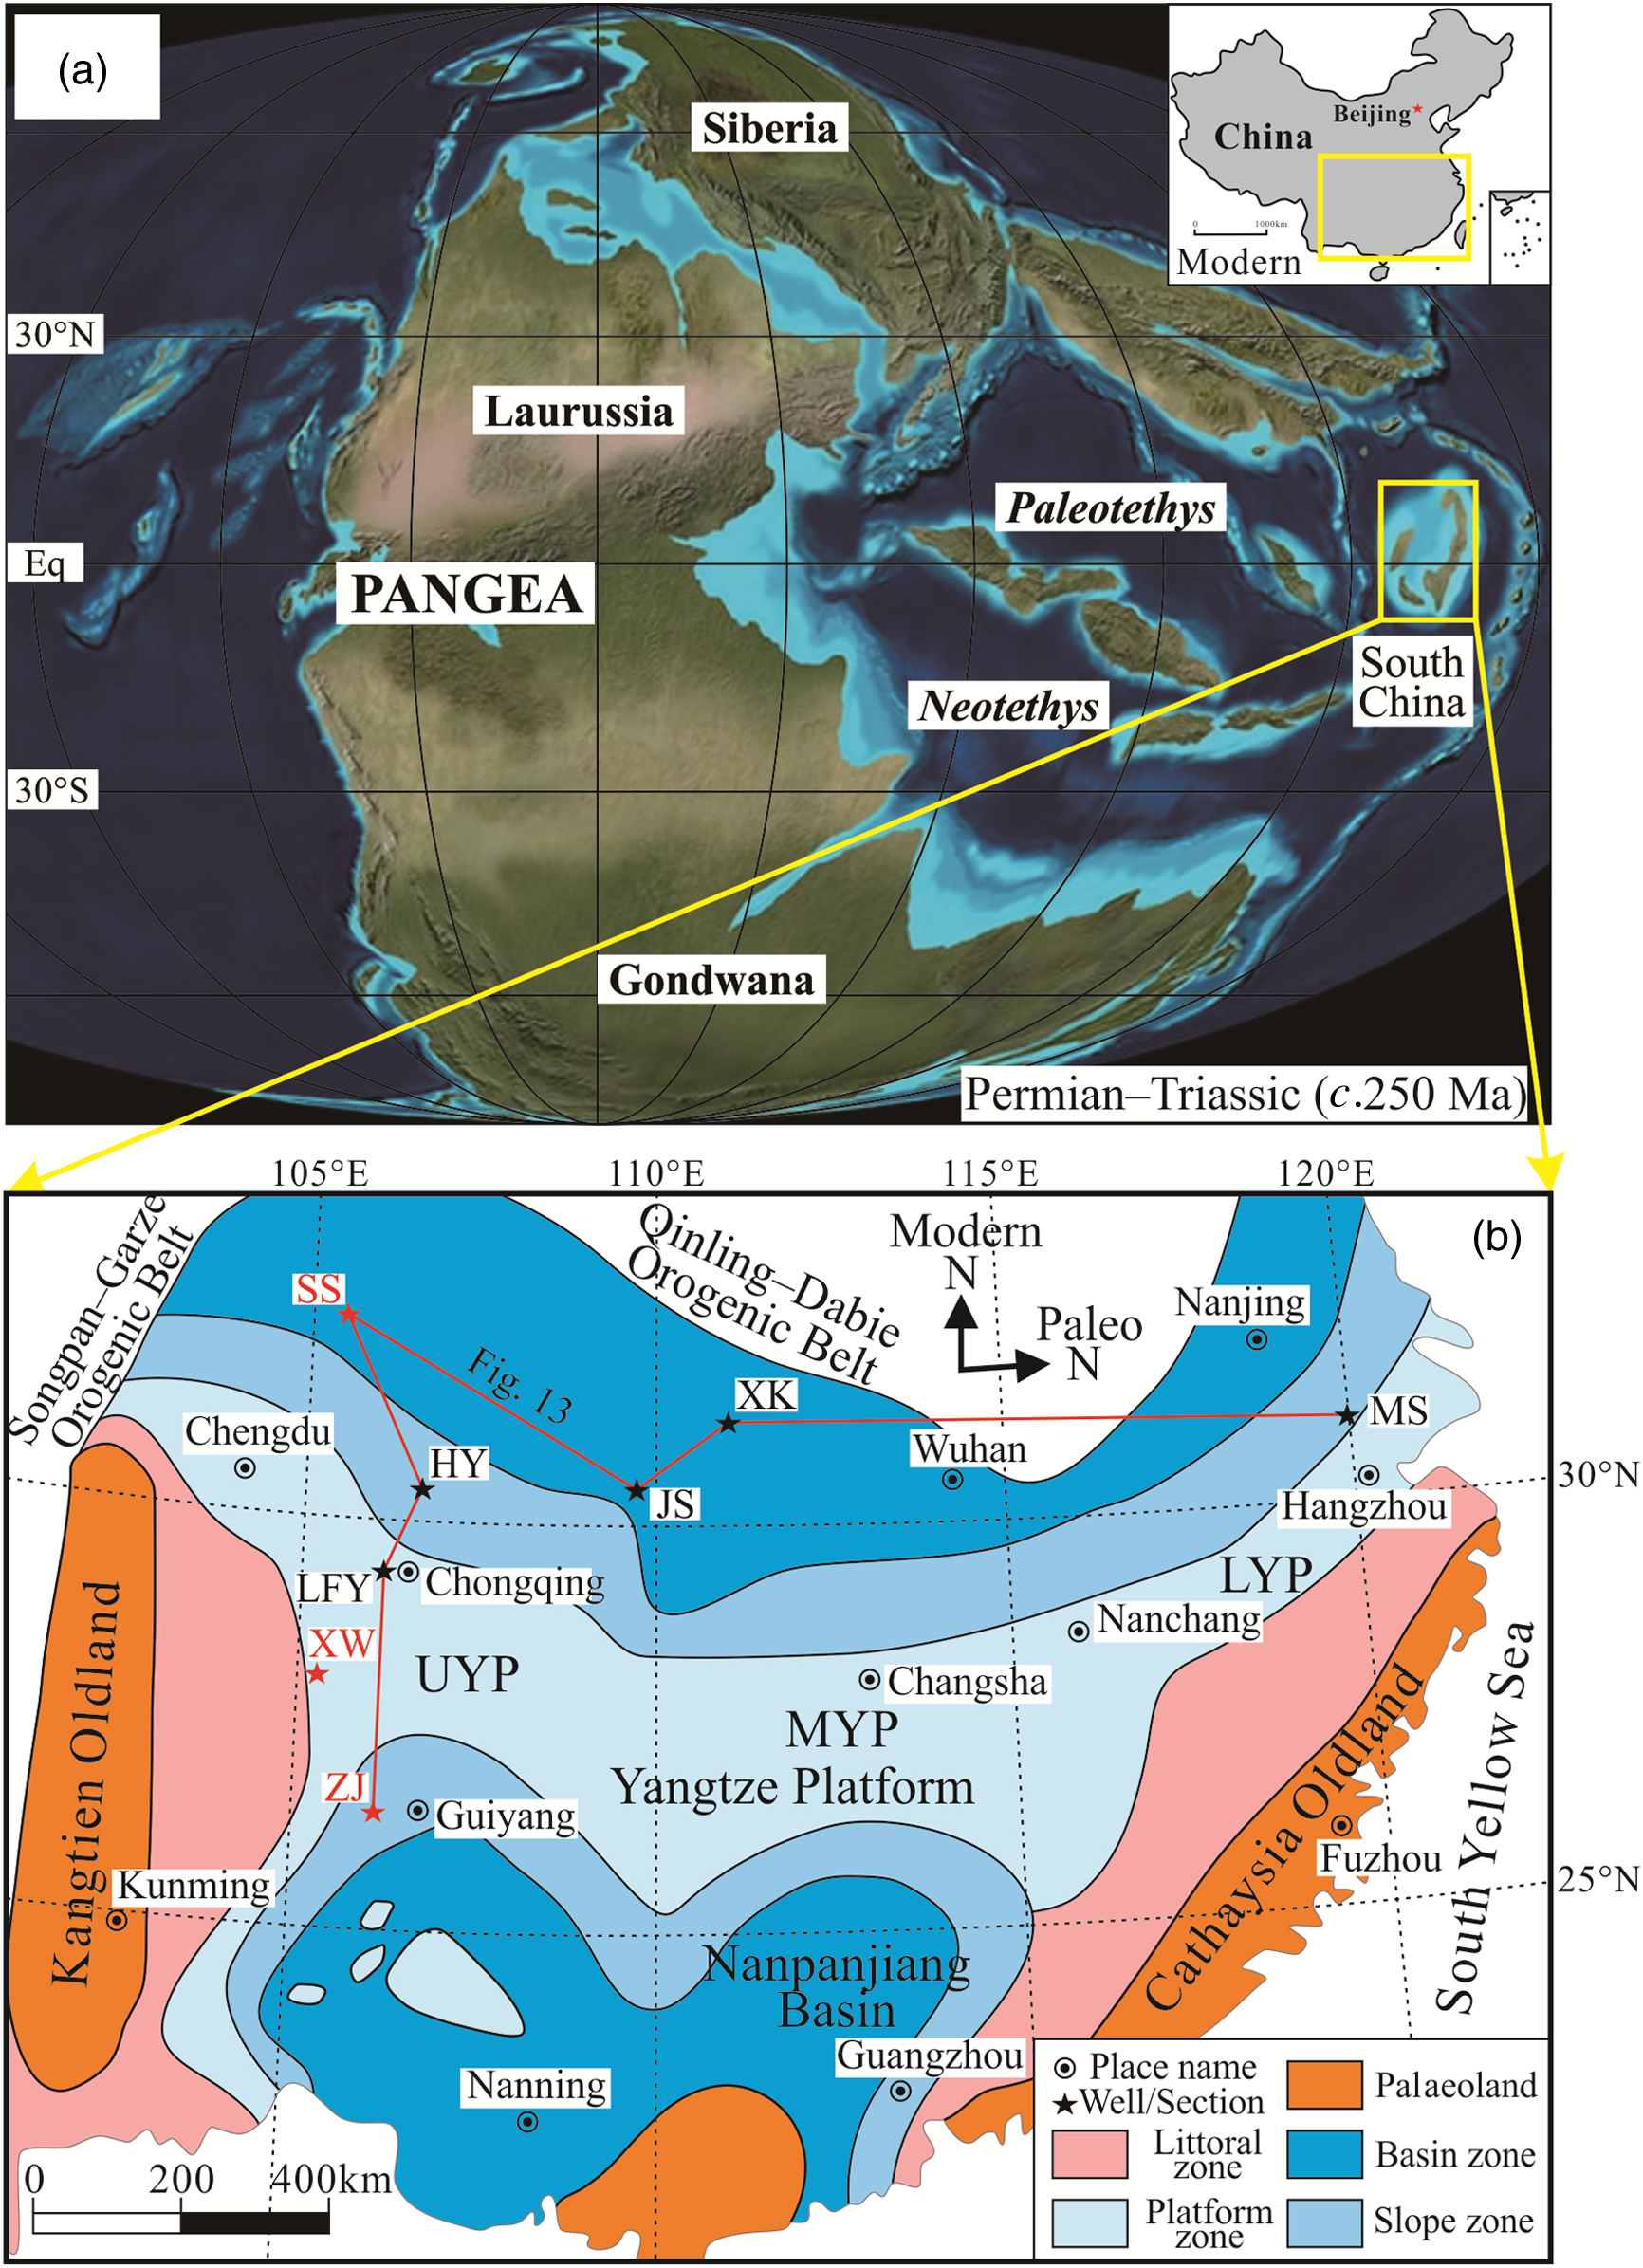
This study focused on carbonate microfacies and biological evolution of the Yangtze Platform and equivalent off-platform successions. In South China (Fig. 1a), the Permian–Triassic-associated deep-water facies sections have a more complete stratigraphic sequence than those of shallow water and contain more complete geological information. Shallow-water facies demonstrated more dramatic ecological responses than in deep-water facies during the Permian–Triassic interval, and contain more complete ecological information (Wang et al. Reference Wang, Tong, Wang and Zhou2005). Based on the above, three boundary sections were selected, representing platform (shallow), toe-of-slope (semi-deep) and basin (deep) sequences (Fig. 1b). The first aim of this study was to compare facies in different depositional settings identified across the PTB. The second aim was to develop a new understanding of biological evolution and sedimentary transition during this time interval.
Palaeogeographic maps of (a) the Pangea and (b) the South China Craton during the latest Permian – earliest Triassic transition. Sections: HY – Huaying; LFY – Liangfengya; XW – Xingwen; ZJ – Zhijin; SS – Shangsi; JS – Jianshi; XK – Xiakou; MS – Meishan. The Xingwen, Zhijin and Shangsi sections analysed in this paper are shown in red in map (b). Platform: UYP – Upper Yangtze Platform; MYP – Middle Yangtze Platform; LYP – Lower Yangtze Platform. Map (a) is adapted from Ron Blakey (http://jan.ucc.nau.edu/rcb7/), and map (b) is modified after Yin et al. (Reference Yin, Jiang, Xia, Feng, Zhang and Shen2014) and Yuan et al. (Reference Yuan, Shen, Henderson, Chen, Zhang, Zheng and Wu2019). Note that the South China Craton has rotated 86° clockwise since the PTB, and drifted from the low palaeolatitudes in the eastern Tethys to its present position.
2. Geological setting
The Yangtze Platform is bounded by the Qinling–Dabie and Songpan–Garze orogenic belts to the north, the Cathaysia Oldland to the south, the Kangtien Oldland to the west, and the South Yellow Sea to the east (Cai et al. Reference Cai, Huang, Xia and Xiang2016; Wu et al. Reference Wu, Fan, Jiang and Yang2017 b) (Fig. 1b). The major boundary structures resulted from (i) the collision between the Yangtze Platform and the Cathaysia volcanic arc during the Silurian Period, and (ii) the collision with the North China Craton during the Early Triassic Epoch (Wang & Li, Reference Wang and Li2004; Wu et al. Reference Wu, Fan, Jiang and Yang2017 b). The Yangtze Platform is split into three parts, namely: the Upper Yangtze Platform (UYP), the Middle Yangtze Platform (MYP) and the Lower Yangtze Platform (LYP) (Cai et al. Reference Cai, Huang, Xia and Xiang2016). The regional stratigraphy of the Yangtze Platform shows that the marine succession lasted until the Late Triassic Epoch (Wu et al. Reference Wu, Fan, Jiang and Yang2017 b). The overall succession is several kilometres thick and moderately folded (Wu et al. Reference Wu, Fan, Jiang and Yang2017 b).
The UYP is located in the western part of the Yangtze Platform and experienced only weak tectonic activity during Permian–Triassic time, with no major faulting or folding (Cai et al. Reference Cai, Huang, Xia and Xiang2016; Chen et al. Reference Chen, Jiang, Liu, Tan, Gao and Wang2017 a). The development of lithofacies was affected by vertical crustal movements as well as sea-level changes, submarine topography and sediment supply (Cai et al. Reference Cai, Huang, Xia and Xiang2016). Marine sediments covered the platform after the late Palaeozoic Era, including a very thick limestone succession. During this period, the UYP was interpreted as a passive marginal basin comprising a central carbonate platform, adjacent slopes, and basins to the north and south (Jiang et al. Reference Jiang, Shi, Zhang, Wang and Xiao2011 a; Och et al. Reference Och, Shields-Zhou, Poulton, Manning, Thirlwall, Li, Chen, Ling, Osborn and Cremonese2013; Wu et al. Reference Wu, Fan, Jiang and Yang2017 b) (Fig. 1b).
3. Materials and methods
The studied samples were collected from measured stratigraphic sections in Sichuan and West Guizhou in three key locations of the middle Upper Yangtze area (Fig. 1b). A total of 15 samples (no claystone) were taken from the Xingwen well with a spacing of 0.2–0.5 m and reduced to 0.05–0.10 m within the PTB interval. A total of 20 samples (no volcanic ash beds) were taken from the Zhijin section with a spacing of 0.05–0.30 m, and 23 samples (no claystone) were taken from the Shangsi section with a spacing of 0.5–0.8 m and reduced to 0.2–0.3 m across the boundary. The stratigraphy and palaeontology of the Xingwen well have not yet been studied, so the PTB at this section is only defined by the volcanic claystone sequences and extinction periods in this paper.
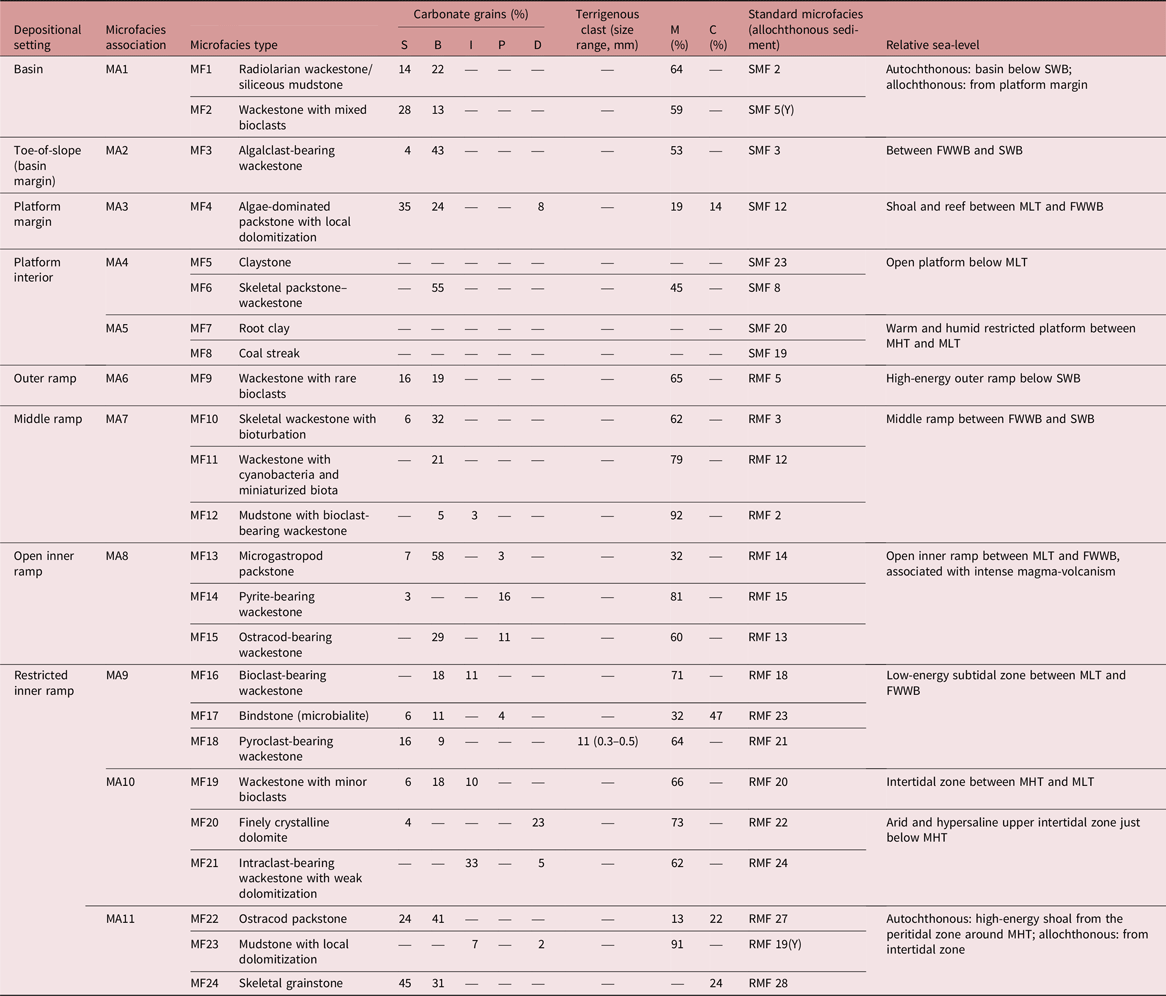
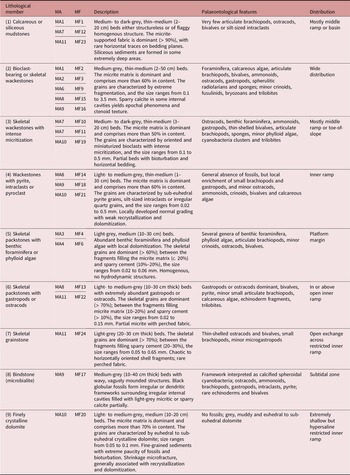
Detailed petrographic analysis was carried out on the 100 thin-sections obtained from these samples, identifying a range of microfacies on the basis of sedimentary structure, texture, grain composition and fossil content. Quantitative analysis of average composition for all microfacies types was conducted with the visual comparison charts of Flügel (Reference Flügel2010) (Table 1). Microfacies were grouped into microfacies associations, which were arranged and summarized as lithological members (Table 2). Carbonate sediments were represented using the nomenclature of Dunham (Reference Dunham and Ham1962), partially modified and adjusted by Embry & Klovan (Reference Embry and Klovan1971). All these microfacies are interpreted primarily from both macro- and micro-observations according to their palaeontology and lithology, and compared with the standard microfacies of Flügel (Reference Flügel2010).
Average composition, corresponding standard microfacies (SMF – rimmed carbonate platform; RMF – homoclinal carbonate ramp) and relative sea level of each microfacies. B – bioclasts; C – cement; D – dolomite; FWWB – fair-weather wave base; I – intraclasts; M – matrix; MHT – mean high tide; MLT – mean low tide; P – pyrite; S – sparite; SWB – storm wave base. The mean composition of MF13–MF24 was only calculated for tempestite intervals.

Specific lithological members and their characteristics of the carbonate successions in the PTB sections from South China. MA – microfacies association; MF – microfacies.

A detailed statistical examination of fossil data across the PTB was carried out over several metres of section at each of the three study sites. The interval represents a duration of c. 1 Ma. Four main lithofacies groups can be recognized: skeletal packstones, disturbed wackestones (Permian), microbialites and shelly grainstones (Triassic). The community composition of the upward succession of these lithofacies groups is documented in terms of the percentage of fossil fragments, micrite, sparite and intraclasts.
Bathymetric interfaces from shallow to deep contain mean high tide (MHT), mean low tide (MLT), fair-weather wave base (FWWB) and storm wave base (SWB) (Flügel, Reference Flügel2010). The sections are correlated on the basis of biozonation and ash-bed stratigraphy to try to reveal the distribution of depositional environments and facies belts. Based on the collected evidence from our microfacies studies, facies distribution, sedimentary evolution, fossil statistics, shelly organisms and microbialite palaeoecology, the distribution characteristics of major ecosystems were proposed.
4. Results
4.a. Sedimentary characteristics
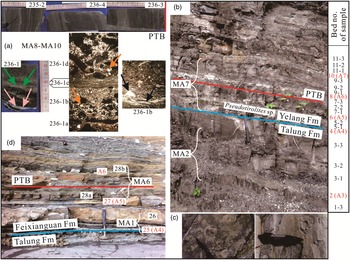
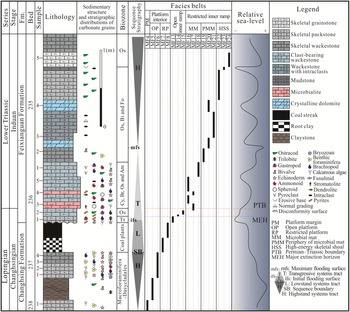
A 12.9-m-thick section was examined from the Xingwen well, which is located in the central UYP (28° 00ʼ 18ʼʼ N, 105° 18ʼ 20ʼʼ E, Fig. 1b). The core section (Fig. 2a) reveals the Changhsing and Feixianguan formations. The Changhsing Formation is divided into five distinct units and is dominated by thick-bedded (0.5–0.7 m) claystones, with some skeletal wackestones or mudstones interbedded in the upper part. The skeletal limestones contain abundant benthic foraminifera and phylloid algae. The sedimentary structures include irregular bedding, subparallel bedding, lenticular bedding, wavy bedding and extensive bioturbation. The Feixianguan Formation is divided into nine distinct units and is characterized by medium-bedded (0.2–0.4 m) bioclast-bearing wackestones and mudstones in the basal part and medium-bedded (0.1–0.3 m) skeletal packstones and grainstones in the upper part.
Core and outcrop photographs of the three study areas near the PTB. (a) The Xingwen well (burial depth increases to the right), calcite vein (pink arrow), pyrite beds (green arrow), chondrites-dominated ichnofabric (orange arrow) and the bored intraclast (black arrow) between the Changhsing and Feixianguan formations; the PTB is indicated by a red line. (b) The Zhijin section, the uppermost Talung Formation and the lowermost Yelang Formation are indicated by a cyan line; the PTB is indicated by a red line. (c) Pseudotirolites sp. was found in bed 5-2 at the Zhijin section. (d) The Shangsi section, the upper Talung Formation and the lower Feixianguan Formation are represented by a cyan line; the PTB is indicated by a red line. MA – microfacies association; PTB – Permian–Triassic boundary. The numbers in different figures (e.g. 236-1, 9-1, 28a) indicate the beds of samples taken.

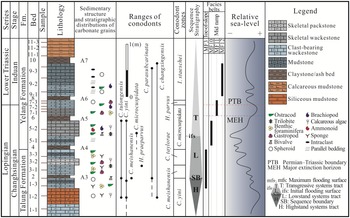
A 10.4-m-thick section was examined from the Zhijin outcrop, which is located in the southern UYP (26° 33ʼ 43ʼʼ N, 105° 49ʼ 9ʼʼ E, Fig. 1b). The lithostratigraphy comprises the Lopingian Talung and the Lower Triassic Yelang formations (Fig. 2b). The Talung Formation is divided into seven units, mainly composed of siliceous limestones and mudstones mixed with thin-bedded (0.01–0.04 m) volcanic ash beds or claystones. The strata have largely littoral benthos, including ostracods, gastropods, bivalves and phylloid algae. The Yelang Formation is divided into nine units and characterized by the appearance of common thin-bedded (0.02–0.06 m) mudstones. The diagnostic conodont fossil Hindeodus parvus (Kozur and Pjatakova in Kozur, Reference Kozur1975) was not found in the Lower Triassic strata, whereas the crucial ammonoid of the Changhsingian stage, Pseudotirolites sp., was found in bed 5-2 (Fig. 2c). By comparison with the Meishan section, the line of the PTB was drawn between beds 7-2 and 7-3 (Fig. 2b).
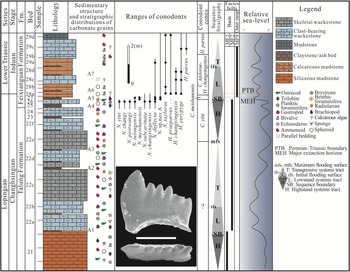
A 14.7-m-thick section was examined from the Shangsi outcrop, which is located in the northern UYP (32° 17ʼ 42ʼʼ N, 105° 30ʼ 24ʼʼ E, Fig. 1b). The Shangsi section was considered a candidate GSSP of the PTB (Yang et al. Reference Yang, Yin, Wu, Ding and Xu1987; Lai et al. Reference Lai, Yang, Hallam, Wignall and Yin1996). The facies and faunas of this section were studied and described in detail by Wignall et al. (Reference Wignall, Hallam, Lai and Yang1995) and Wignall & Twitchett (Reference Wignall and Twitchett1999). The Shangsi section consists of the Lopingian Talung and the Lower Triassic Feixianguan formations (Fig. 2d). The Talung Formation is divided into 13 units, dominated by thick-bedded (0.6–0.9 m) biosiliceous mudstones with abundant radiolarians in the lower part, and medium-bedded (0.3–0.5 m) skeletal wackestones with foraminifera, ostracods and gastropods in the upper part. The Feixianguan Formation is divided into 11 units and is mainly thin-bedded (0.04–0.09 m) mudstones with few bivalves, calcareous algae and ammonoids.
4.b. Microfacies analysis
A total of 24 microfacies were identified from the Lopingian (Changhsing and Talung formations) and Lower Triassic (Feixianguan and Yelang formations) strata in the Xingwen, Zhijin and Shangsi sections. Among those microfacies, 17 were identified in the Xingwen well (Fig. 3), four in the Zhijin section (Fig. 4) and three in the Shangsi section (Fig. 5).
Vertical sequence of the carbonate microfacies and bioassemblages around the PTB in the Xingwen well. Fossils: Fo – foraminifera; Tr – trilobite; Os – ostracod; Bi – bivalve; Br – brachiopod; Am – ammonoid; Cy – cyanobacteria. Note that these biozones are bioassemblage zones rather than conodont zones, and that the quantity of carbonate grains decreases gradually from left to right (and for Figs 4 and 5).

Vertical sequence of the carbonate microfacies and bioassemblages around the PTB in the Zhijin section. Conodonts: C. – Clarkina; H. – Hindeodus; I. – Isarcicella. Conodont ranges are after Wang et al. (Reference Wang, Bao and Kong2017).

Vertical sequence of the carbonate microfacies and bioassemblages around the PTB in the Shangsi section. Conodonts: N. – Neogondolella, H. – Hindeodus, C. – Clarkina. Plate: Hindeodus parvus (Kozur and Pjatakova in Kozur, Reference Kozur1975), the lateral and upper view. Sample SS 29c. Scale bar is 0.15 mm. Conodont ranges and plate after Jiang et al. (Reference Jiang, Lai, Yan, Aldridge, Wignall and Sun2011 b).

4.b.1. Basin microfacies association (MA1)
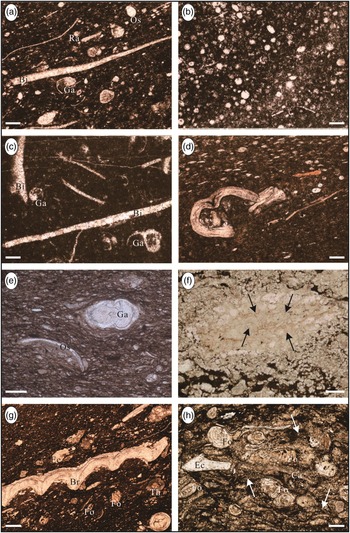
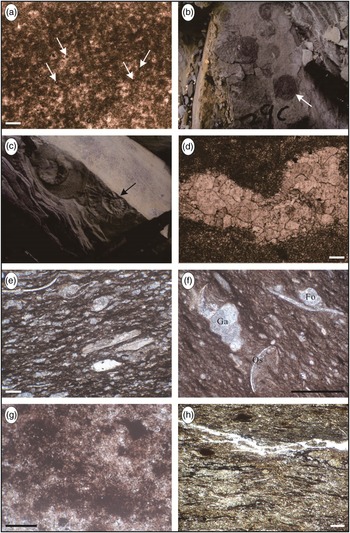
The association contains radiolarian wackestone/siliceous mudstone (MF1, Fig. 6a) and wackestone with mixed bioclasts (MF2, Fig. 6b–d). Sand-sized, mixed bioclasts (10–20%) are composed of autochthonous grains (e.g. spherulitic radiolarians, fecal pellets, ostracods) and allochthonous fragments (larger benthic foraminifera (LBF), crinoids, bryozoans) within a micrite-dominated or mixed micritic-siliceous matrix.
Microfacies features of basin, toe-of-slope, platform margin and interior (all micrographs were taken under plane-polarized light, unless otherwise specified). See Table 1 for details on the depositional facies. (a) Skeletal wackestone yielding thin-shelled bivalves (Bi), ostracods (Os), gastropod (Ga), spherulitic radiolarian (Ra) fragments (MF1), Sample SS 21. (b) Radiolarian wackestone displaying densely distributed siliceous radiolarians (MF2); sample SS 22. (c) Bioclast-bearing wackestone with abundant fragments of gastropods (Ga) and bivalves (Bi) (MF2); sample SS 24. (d) Articulate brachiopods with parallel lamellar texture in skeletal wackestone (MF2); sample SS 26. (e) Bioclast-bearing wackestone, ostracods (Os) coexisted with gastropod (Ga) (MF3); sample ZJ 3. (f) Algae-dominated packstone with dolomitization, phylloid algae fragment with intense recrystallization and dolomitization (black arrow) (MF4); sample WX 238-1. (g) Skeletal packstone–wackestone, the coarse-grained debris dominated by brachiopods (Br), while the fine-grained debris dominated by foraminifera (Fo) and echinoderm (Ec) fragments with occasional thorns of brachiopods (Th) (MF6); sample WX 237-4. (h) Skeletal packstone, dense foraminifera (Fo) associated with echinoderms (Ec) and calcareous algae (Ca) fragments, the small and foggy grains from phylloid algae (white arrow) possibly (MF6); sample WX 237-1. Scale bars are 0.25 mm.

4.b.2. Toe-of-slope (basin margin) microfacies association (MA2)
The major algalclast-bearing wackestone (MF3, Fig. 6e) contains a variety of bioclasts (c. 43%) such as ostracods, calcareous algae, sponges and foraminifera. Bioclasts range in size from 0.2 to 0.3 mm. The sparry calcite (c. 4%) is smooth and sub-angular, and the pore-filling matrix is micrite.
4.b.3. Platform-margin reef and shoal microfacies association (MA3)
The major algae-dominated packstone (MF4) with local dolomitization consists of well-sorted bioclasts (20–25%), sub-rounded sparry calcite (35%), micrite matrix (c. 20%), minor dolomite (c. 10%) and cement (10–15%). Bioclasts include fragments of phylloid algae (Fig. 6f), echinoderms and benthic foraminifera. The size of sparry calcite ranged between 0.02 and 0.06 mm, and some calcite is altered by dolomitization.
4.b.4. Platform-interior–open-platform microfacies association (MA4)
The association comprises claystone (MF5) and skeletal packstone–wackestone (MF6). The latter is richly fossiliferous. Bioclasts occur in a mud-supported fabric with two distinct grain sizes (Fig. 6g): fine-grained (0.3–1.0 mm in size) and coarse-grained (2.5–3.5 mm in size). The fine-grained bioclasts are composed of foraminifera (c. 13%), echinoderm fragments (c. 7%) and bivalves (3%) (Fig. 6h). The coarse-grained bioclasts are mainly brachiopods (c. 21%) and calcareous algae (11%). Mud-filled burrows are common.
4.b.5. Platform-interior–restricted-platform microfacies association (MA5)
The association consists of root clay and coal streak (MF7, MF8). Marked fractures and facies changes occur at the top of the coal streak, which represents a disconformity surface. A 10-mm-thick calcareous mudstone layer, which is penetrated by a 1-mm-thick calcite vein, develops between the underlying coal streak and the overlying disconformity (Fig. 2a).
4.b.6. Outer-ramp microfacies association (MA6)
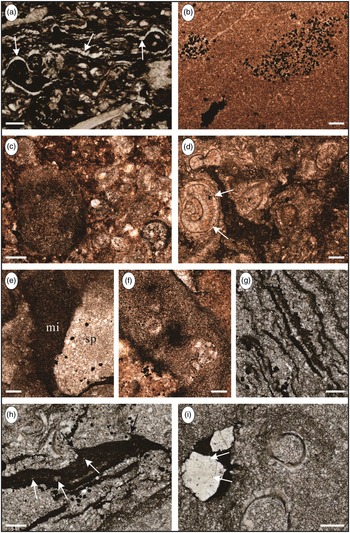
Wackestone with rare bioclasts (MF9) contains relatively few bioclasts, such as Claraia sp. and spheroidal cyanobacteria (individual size of 10–15 μm), which are filled by matrix or calcite (Fig. 7a). The increase in clay content and complete absence of siliceous rocks are the most distinctive features. This association, extending for c. 3 m, was only observed in the Shangsi section overlying the PTB (beds 28a, 28b). The upper part of the strata contains Claraia sp. (Fig. 7b) and Ophiceras sp. (Fig. 7c, d).
Microfacies features of the outer and middle ramps. See Table 1 for details on the depositional facies. (a) Wackestone with rare bioclasts, containing cyanobacteria and matrix or calcite (arrow) filled with them (MF9); sample SS 28. (b, c) Skeletal wackestone with Claraia sp. (white arrow), Ophiceras sp. (black arrow) (MF9); sample SS 29c. (d) Skeletal wackestone with ammonoid fragments (MF9); sample SS 29e. (e) Disturbed wackestone with multiple and oriented bioclasts (MF10); sample ZJ 5. (f) Bioclast-bearing wackestone, the miniaturized biota including ostracods (Os), gastropods (Ga), benthic foraminifera (Fo) (MF11); sample ZJ 7-2. (g) Cyanobacteria clusters in wackestone (MF11); sample ZJ 7-3. (h) Bioclast-bearing wackestone sandwiched in the mudstone (MF12); sample ZJ 9. Scale bars are 0.25 mm.

4.b.7. Middle-ramp microfacies association (MA7)
This association comprises skeletal wackestone with bioturbation (MF10), wackestone with cyanobacteria, miniaturized biota (ostracods, gastropods and benthic foraminifera) (MF11) and mudstone with bioclast-bearing wackestone (MF12). The distinctive features of skeletal wackestones are the multiple oriented fragments of resurrected biota and extensive bioturbation in the micrite-dominated matrix. Bioclasts of trilobites, ostracods and brachiopods are usually 0.2 mm in size but can be as large as 0.4–0.5 mm (Fig. 7e). MF11 is characterized by miniaturized biota in beds 7-1 and 7-2 of the Zhijin section (Fig. 7f), and cyanobacteria clusters in bed 7-3 (Fig. 7g). The miniaturized biota (0.1–0.3 mm) consists of ostracods, gastropods and benthic foraminifera. The mudstones with a thin wackestone interlayer (Fig. 7h) are dominated by mud-supported fabric, rounded silt-sized intraclasts and rare bioclasts. Brachiopod and ostracod fragments ranging in size from 0.3 to 0.5 mm make up most of the bioclasts.
4.b.8. Open inner-ramp microfacies association (MA8)
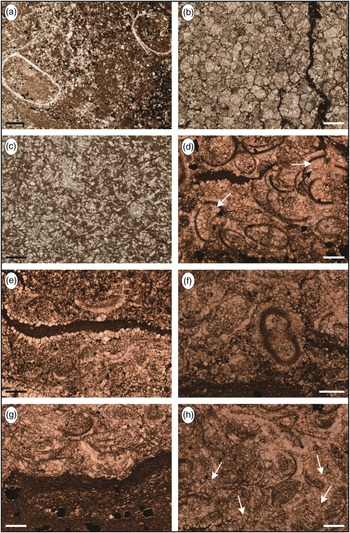
This association is composed of microgastropod packstone (MF13), pyrite-bearing (MF14) and ostracod-bearing wackestone (MF15). Packstones of thickness 6 cm mainly comprise the micrite infill (25–35%) and skeletal grains, including bioclasts of gastropods, trilobites, bivalves and brachiopods in a grain-supported fabric. Only the first-generation sparry calcite with ctenoid texture occurs in micropores inside the wall (Fig. 8a), with a crystal size of 0.10–0.15 mm diameter. The pyrite-bearing wackestones (Fig. 8b) contain no fossils, and the pyrite grains (< 20%, individual size 15–25 μm) possess insignificant crystal habits. Bioclasts (25–35%) within the ostracod-bearing wackestones are dominated by ostracods and cyanobacteria clusters (Fig. 8c) associated with minor gastropod and brachiopod clasts in the micrite-supported fabric. Intact and abundant ostracod shells (0.1–0.2 mm diameter) are common.
Microfacies features of the open inner ramp and the lower segment of the restricted inner ramp. See Table 1 for details on the depositional facies. (a) Microgastropod packstone, developing the first-generation sparry calcite (arrow) with ctenoid texture (MF13); sample Xingwen 236-1. (b) Pyrite-bearing wackestone displaying pyrite grains (MF14); sample XW 236-2. (c) Ostracod-bearing wackestone, miniaturized ostracod coexisted with cyanobacteria clusters (MF15); sample XW 236-2. (d) Bioclast-bearing wackestone with incomplete microgastropods (arrow) (MF16); sample XW 236-3. (e) Stromatolite with intermixing of micritic (mi) and sparry calcite (sp) patches (MF17); sample XW 236-3. (f) Cyanobacteria clusters (MF17); sample XW 236-4. (g) Dendrolite yielding nearly parallel to bedding plane (MF17); sample XW 236-4. (h) S-shaped texture (black arrow) and irregular mesh structure (white arrow) (MF17); sample XW 236-5. (i) Pyroclast-bearing wackestone, gaseous inclusions (arrow) on surface of quartz grains (MF18); sample XW 235-1. Scale bars are 0.25 mm.

4.b.9. Microbial mat microfacies association (MA9)
MA9 consists of bioclast-bearing wackestone (MF16), bindstone (microbialite) (MF17) and pyroclast-bearing wackestone (MF18). The bioclast-bearing wackestones (Fig. 8d) are dominated by mud, associated with minor silt-sized intraclasts and well-preserved bioclasts, typically including bivalves, brachiopods and ostracods. The essential feature of bioclasts is the appearance of abundant but incomplete microgastropods (30–40%, 0.5–1.0 mm) with parallel lamellar texture (Fig. 8d). The calcite grains in some microgastropod cavities develop epochal phenomena and ctenoid texture.
Bindstones composed of stromatolites and dendrolites appear patchy and lamellar in well cores (Fig. 2a). In stromatolites (c. 60%) (Fig. 8e), abundant spheroidal cyanobacteria (individual size of 0.01–0.03 mm) occur in clusters (Fig. 8f). The dark clasts comprise fine-grained calcite, and the bright clasts are coarse-grained calcite. These are arranged laminately in dendrolites (Fig. 8g) with a few fossils in the dark laminae, and ostracods and pyrite grains in the bright laminae. Fossils in these bindstones are cyanobacteria and algae, accompanied by minor ostracod, echinoderm and brachiopod clasts. Some planation on the surface and intraformational structures, such as S-shaped texture and mesh structure (Fig. 8h), are observed. MF18 is mainly crystalline limestones containing allochthonous sediments known as pyroclasts, which consist dominantly of irregular, euhedral and angular quartz grains (size of 0.3–0.5 mm) (Fig. 8i) with rare silt-sized inclusions.
4.b.10. Periphery of microbial mat microfacies association (MA10)
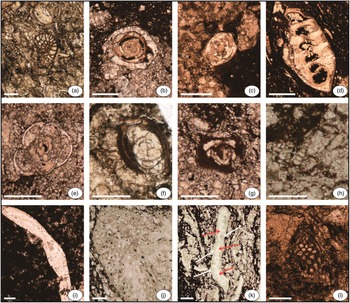
This association comprises wackestone with minor bioclasts (MF19), finely crystalline dolomite (MF20) and intraclast-bearing wackestone with weak dolomitization (MF21). The mud-dominated wackestones contain common, broken, intensely micritized bioclasts (e.g. bivalves, ostracods and foraminifera) (Fig. 9a) and minor silt-sized intraclasts. Gray, muddy crystalline dolomite (0.05–0.10 mm in size) without bioclasts is observed (Fig. 9b). The clast-bearing wackestones associated with recrystallization and dolomitization show normal grading and silt-sized intraclasts (Fig. 9c). Rounded and oriented intraclasts are poorly sorted, reaching up to 0.2 mm in size.
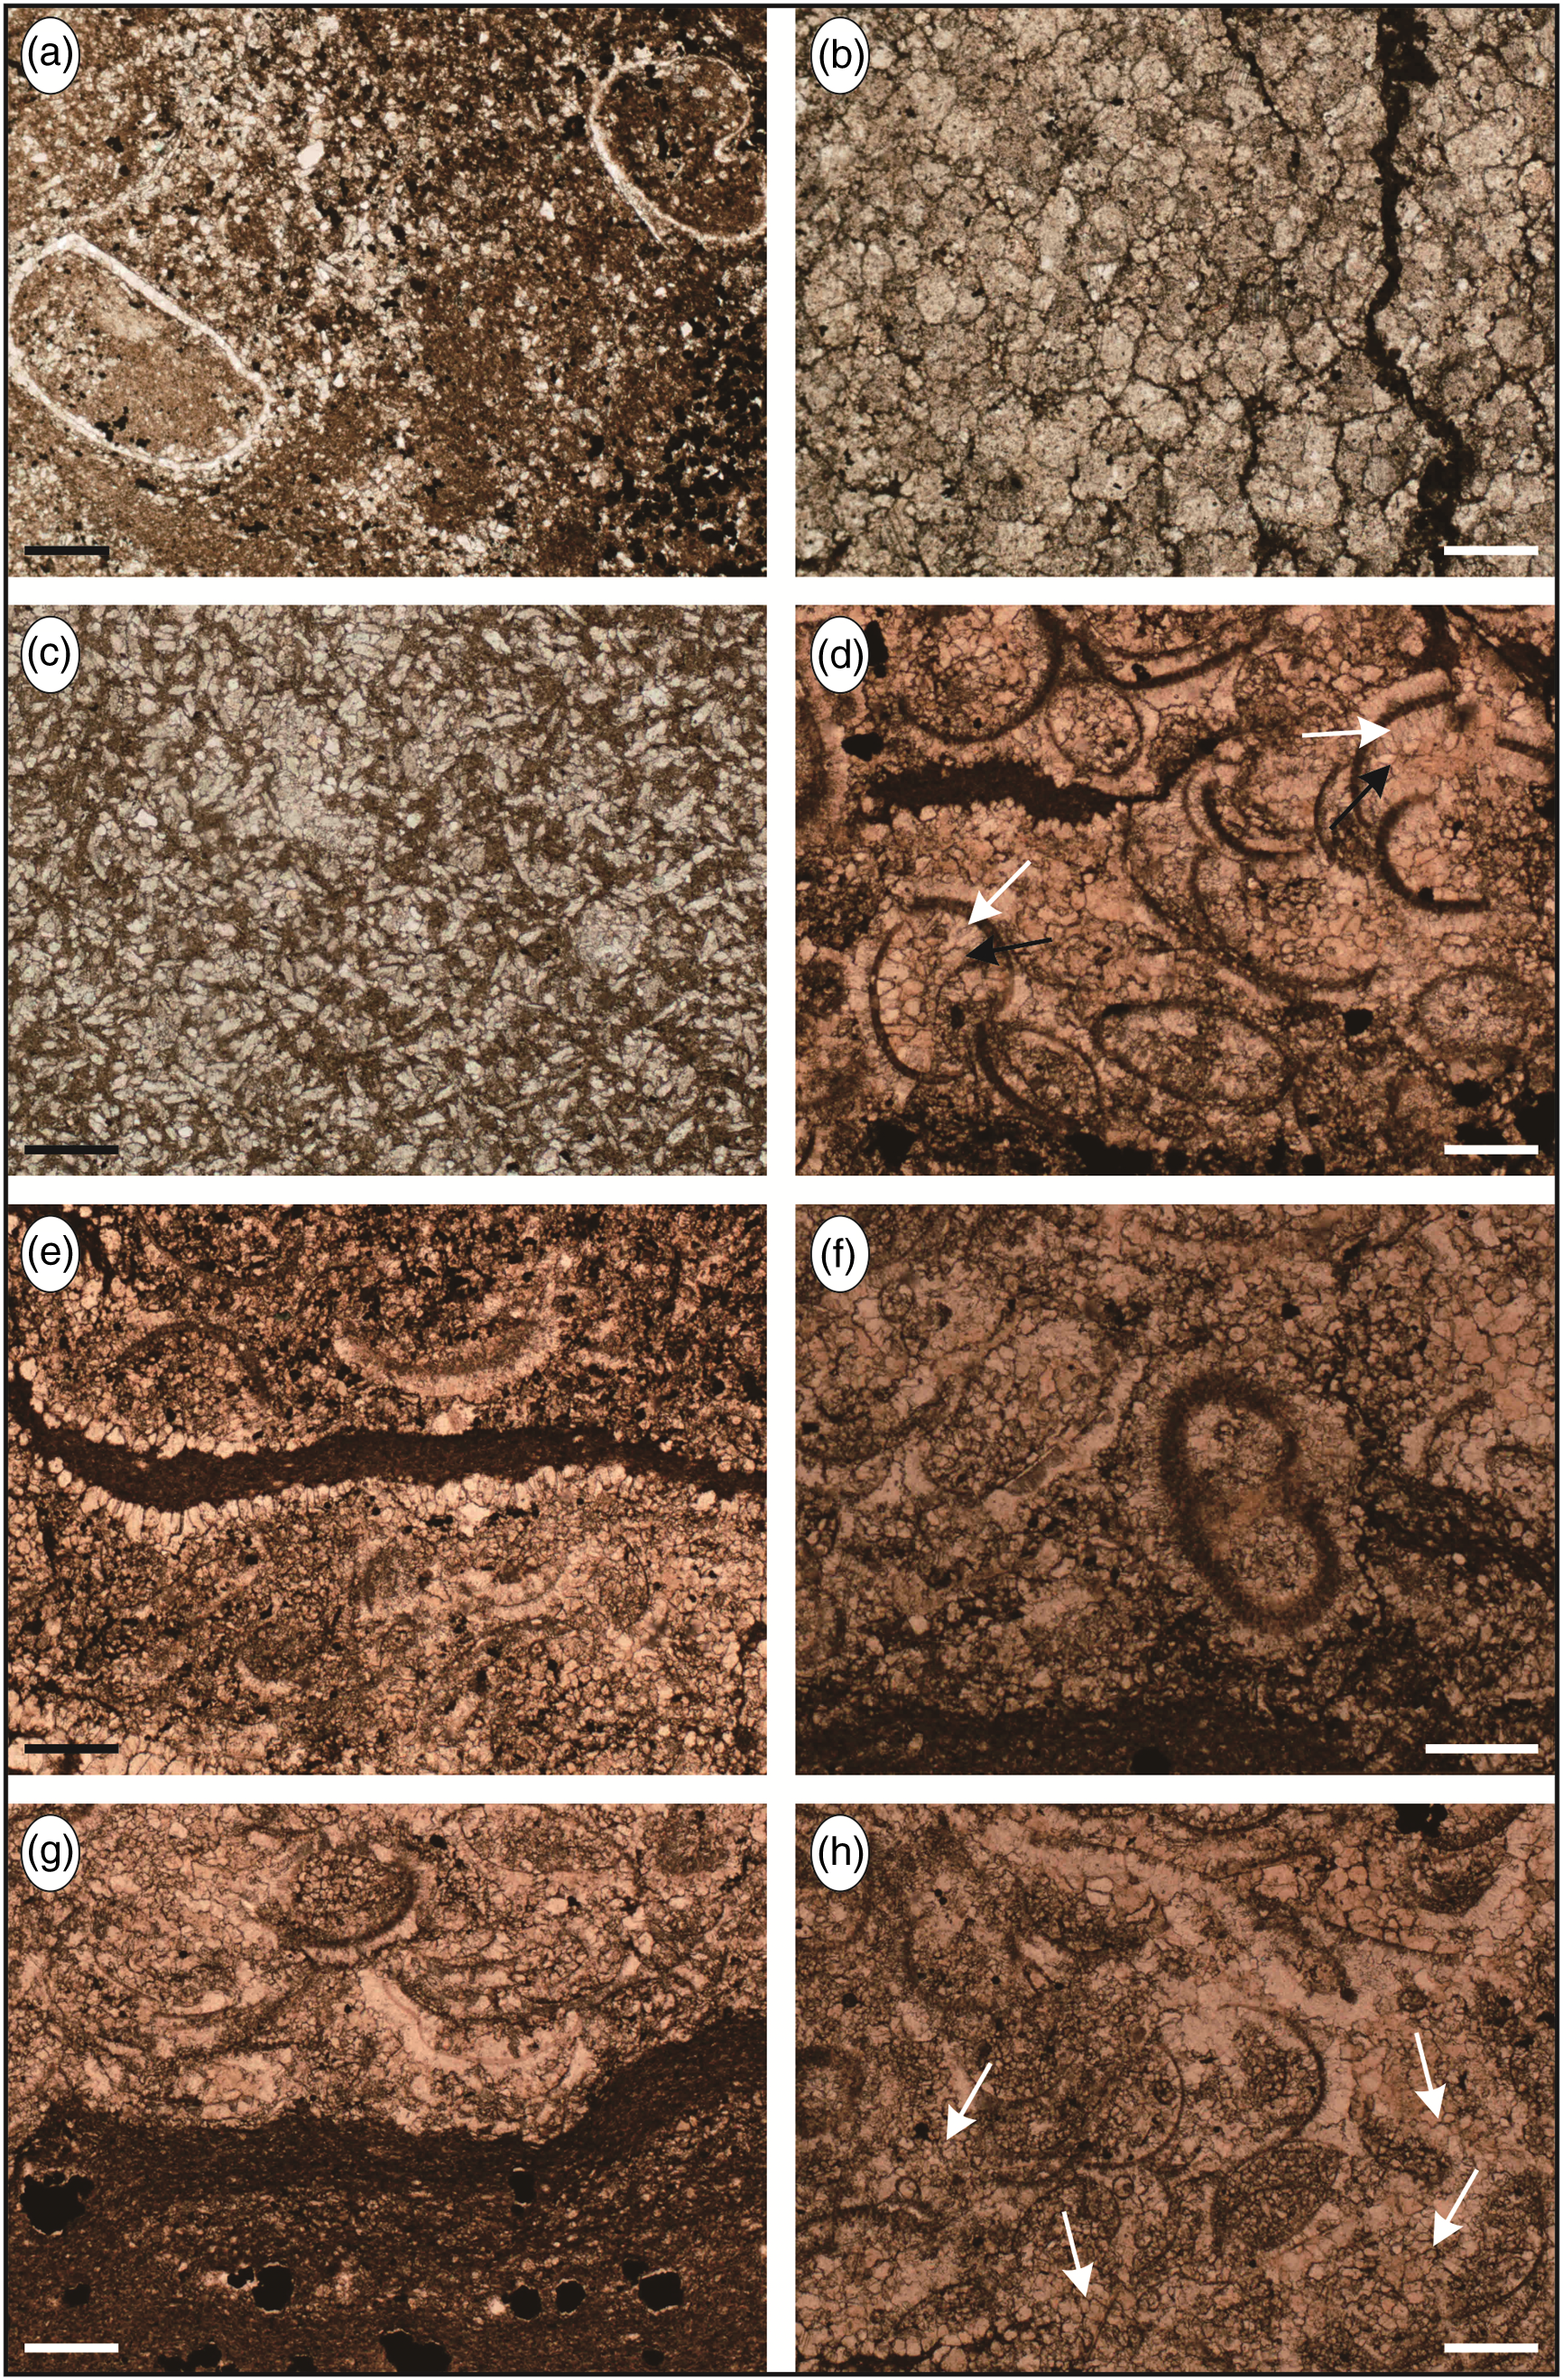
Microfacies features of the middle and upper segments of the restricted inner ramp. See Table 1 for details on the depositional facies. (a) Wackestone with intensely micritized bioclasts (MF19); sample XW 235-2. (b) Grey, muddy finely crystalline dolomite with hazy centre occasionally (MF20); sample XW 235-3. (c) Intraclast-bearing wackestone with weak dolomitization (MF21); sample XW 235-4. (d) Ostracod packstone yielding the first-generation calcite (white arrow) with ctenoid texture, and the second-generation calcite (black arrow) with idiomorphic texture (MF22); sample XW 235-5. (e) Ostracod packstone with wormtrail (MF22); sample XW 235-5. (f) Ostracod packstone with micrite envelope (MF22); sample XW 235-5. (g) Erosive contact between mudstone and grainstone with local dolomitization (MF23); sample XW 235-5. (h) Skeletal grainstone cemented by sub-angular sparry calcite (arrow) (MF24); sample XW 235-5. Scale bars are 0.25 mm.
4.b.11. High-energy skeletal shoal microfacies association (MA11)
The association consists of ostracod packstone (MF22), mudstone with local dolomitization (MF23) and skeletal grainstone (MF24). Bioclasts of the packstones are dominated by ostracods, while the sub-rounded sparry calcite (0.02–0.10 mm in size) reveals clear epochal phenomena and ctenoid texture along the inner wall of shells or dissolved pores (Fig. 9d). Sub-angular calcite cements (of size 0.01–0.03 mm) are accompanied by the matrix and fill in organism cavities or intergranular dissolved pores formed by intense recrystallization and dissolution. The microfacies is characterized by structural inversion and wormtrails on the pore edges (Fig. 9e), and some sand-sized bioclasts possess micrite envelopes (Fig. 9f).
The unfossiliferous mudstones (Fig. 9g) are dominated by micrite-supported fabric, with a fining-upwards trend. Dolomitization occurs in places, and scattered, rounded grains composed of silt-sized intraclasts are observed locally. The skeletal grainstones consist of sub-rounded sparry calcite (0.05–0.20 mm in size) and ostracod fragments (c. 26%, 0.55–0.65 mm). In many cases, the fragments show intense recrystallization and are cemented by sub-angular calcite (0.02–0.05 mm in size) (Fig. 9h) in a grain-supported fabric.
4.c. Palaeontological features across the Permian–Triassic boundary
Abundant, high-diversity and well preserved fossil assemblages occur in parts of the carbonate sediments of the studied sections (Figs 10, 11), dominated by marine benthos. In other parts, the fossil assemblage is highly restricted or absent.
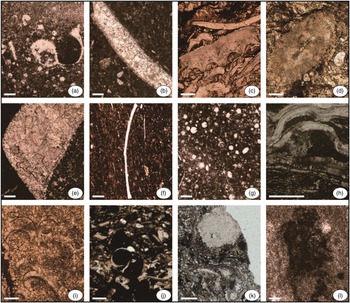
Palaeontology of the PTB strata in the Xingwen well and Shangsi section. (a) Palaeofusulina sp.: only three shell rings are developed, 1st and 2nd inner rings are tightly coiled, and the outermost ring is suddenly relaxed; sample XW 237-1. (b) Glomospira dublicata Lipina; sample XW 237-2. (c) Hemigordius qinglongensis (Wang) Laxa Lin; sample XW 237-4. (d) Pachyphloia robusta K.M.-Maclay; sample XW 237-4. (e) Glomomidiella sp.; sample XW 237-2. (f) Multidiscus guangxiensis Lin; sample XW 237-1. (g) Neodiscus ovatus (Grozdilova); sample XW 237-2. (h) Nodosaria concinna Potievskaya; sample XW 237-3. (i) Trilobite, single-layer fibreglass structure and microcracks, bright yellowish-brown; sample SS 21. (j) Dasycladale, inside the algae is filled with calcite; sample XW 237-1. (k) Rod-like phylloid algae, recrystallization occurred in the medullary area (red arrow), and the cortical areas (white arrow) showing thin branches perpendicular to medullary area; sample XW 237-1. (l) Cryptostomata: the zooecium walls with obvious folds and darker colour are parallel lamellar texture, and most is filled by micrite; sample XW 237-4. Scale bars are 0.25 mm.

Palaeontology of the PTB strata in the Xingwen well, Zhijin section and Shangsi section. (a) Gastropod, coexists with foraminifera, phylloid algae and spherulites; sample SS 22d. (b) Bivalve, secondary polycrystalline structure, varying in size, 2.0–3.0 mm; sample SS 22e. (c) Brachiopod, there are thorns on surface of part of the shells; sample XW 237-4. (d) Echinoid, radially arranged pores on the bone plate, which are filled with micrite or late deposits; sample XW 237-1. (e) Ammonoid, the shell with secondary polycrystalline structure shows thick, columnar or leaf-shaped; sample SS 22e. (f) Sponge, siliceous and needle-shaped, length of 1.5–2.0 mm and high brightness; sample ZJ 1. (g) Radiolarian, the size of microlitic aggregate is between 0.1 and 0.3 mm, spherical shell; sample SS 22d. (h) Trilobite, has single-layer fibreglass structure and is undulatory extinction under cross-polarized light; sample XW 236-1. (i) Ostracod, thin shell walls are filled with micrite, and sparry calcite along inner wall of the shells shows epochal phenomena; sample XW 235-5. (j) Gastropod, the shell walls composed of columnar calcite grains are secondary polycrystalline structure, and most cavities are filled with matrix or organic matter; sample XW 236-1. (k) Crinoid stem, the central pedicle foramen is filled with micrite, and micritic mesh structure is observed on the bone plate; sample XW 235-1. (l) Cyanobacteria: micritic granular aggregates and bonding structure; sample SS 29. Scale bars are 0.25 mm.

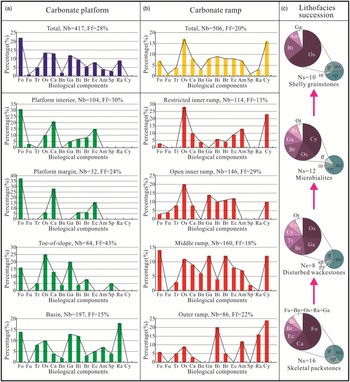
For the platform region (sensu lato), fossil fragments average 28% according to statistics from facies of platform interior and margin, toe-of-slope and basin successions (Fig. 12a). The fragments include foraminifera (Fig. 10a–h), trilobites (Fig. 10i), ostracods, calcareous algae (Fig. 10j, k), bryozoans (Fig. 10l), gastropods (Fig. 11a), bivalves (Fig. 11b), brachiopods (Fig. 11c), echinoderms (Fig. 11d), ammonoids (Fig. 11e), sponges (Fig. 11f) and radiolarians (Fig. 11g). On the platform, they average 27% (interior, 30%; margin, 24%), consist of Palaeofusulina sp. (Fig. 10a), cryptostomatous bryozoans, and plenty of foraminifera such as the major Glomospira sp. (Fig. 10b), Hemigordius sp. (Fig. 10c) and Pachyphloia sp. (Fig. 10d) (the three genera total > 65%), and minor Glomomidiella sp. (Fig. 10e), Multidiscus sp. (Fig. 10f), Neodiscus sp. (Fig. 10g) and Nodosaria sp. (Fig. 10h). The fossil content in the toe-of-slope and basin environment averages 43% and 15%, respectively. For the carbonate ramp, the fossil content averages 20% and fossils are less diverse than on the platform (Fig. 12b). Only foraminifera, trilobites (Fig. 11h), ostracods (Fig. 11i), gastropods (Fig. 11j), bivalves, brachiopods, echinoderms (Fig. 11k) and calcareous algae (Fig. 11l) were deposited on the ramp.
(a, b) Relative abundance of biological components of the Permian–Triassic carbonates in the study area, and (c) the percentages of fossil fragments from the uppermost Changhsingian four lithofacies throughout the microbialite succession. Smaller pie diagrams show the percentages of fossil fragments (ff), micrite (mi), sparite (sp), pyrite (py) and intraclasts (in) in the entire rock. Larger pie diagrams are the percentages of fossil groups in the bioassemblages. Nb – bioclast numbers; Ns – sample numbers. Fossils: Fo – foraminifera (non-fusulinid); Fu – fusulinid; Tr – trilobite; Os – ostracod; Ca – calcareous algae; Bn – bryozoan; Ga – gastropod; Bi – bivalve; Br – brachiopod; Ec – echinoderm; Am – ammonoid; Sp – sponge; Ra – radiolarian; Cy – cyanobacteria; Ot – others. Blue and yellow columns in (a) and (b) represent the total biological components in the carbonate platform and ramp. Green and red columns in (a) and (b) represent the biological components of each depositional setting in the carbonate platform and ramp. The colours from dark to light represent the content from high to low in (c).

Considering the facies groups separately, the following is observed. Fossil fragments are 31% in skeletal packstones. The fragments include LBF (43%), macroalgae (19%), echinoderms (13%), brachiopods (9%), bivalves (7%), bryozoans, ostracods, radiolarians and gastropods. The last four classes are rarely present, accounting for only 9%. The Lopingian communities were therefore highly diverse (Fig. 12c). The disturbed limestones contain slightly fewer identifiable microfossils, and fossil fragments comprise 26% of the entire rock. The distribution is ostracods, microgastropods, brachiopods, trilobites, cyanobacteria, foraminifera and others, with the first six classes accounting for 93% (Fig. 12c). In contrast, microbialites (Triassic) have the fewest identifiable microfossils and comprise only 10% of the rock. Fossil fragments consist of cyanobacteria, ostracods, brachiopods, microgastropods, bivalves and others, with the first five classes accounting for 95%. Microbialite communities witnessed a dramatic loss of metazoans, as well as the disappearance of at least 90% of foraminifera species. The abundance and diversity of fragments increases significantly from the microbialites into overlying shelly grainstones, in which they account for 23% of that facies. Major components include ostracods, bivalves, ammonoids and gastropods, with the first three classes accounting for 95% (Fig. 12c).
5. Discussion
5.a. Depositional settings
On the basis of their co-occurrence and lithology in different sections, the microfacies have been grouped into 11 microfacies associations and nine lithological members, interpreted as distinct facies belts linked to the basin, toe-of-slope, carbonate platform and ramp (Tables 1, 2).
5.a.1. Microfacies association characteristics and their short-term environment
Basin and toe-of-slope: For MA1 of the Shangsi section, the siliceous deposits and the radiolarian dominance in the fossils all indicate deposition under deep-water conditions in a relatively calm basin setting below the SWB with efficient current circulation (Flügel, Reference Flügel2010; Al-Dabbas et al. Reference Al-Dabbas, Al-Jassim and Al-Jwaini2013; Mehrabi et al. Reference Mehrabi, Rahimpour-Bonab, Enayati-Bidgoli and Navidtalab2014; Han et al. Reference Han, Hu, Li and Garzanti2016). The micrite-dominated fabric and the frequent occurrence of sponges indicate that MA2 of the Zhijin section was also deposited in relatively low-energy and deep-water conditions deeper than FWWB. The large reduction in siliceous rocks and the absence of allochthonous fragments or radiolarians distinguish assemblage MA2 from assemblage MA1 in the basin. Both MA1 and MA2 represent deep-water, basin to toe-of-slope environments.
Carbonate platform: MA3 with grain-supported packstones and MA4 with richly fossiliferous packstone–wackestone are characterized by algal bioclasts. As interpreted by Scholle et al. (Reference Scholle, Bebout and Moore1983), the depositional environment for MA3 is most likely a shallow-water and narrow platform margin, and that for MA4 is a deep-water open platform. Skeletal limestones usually form in warm, normally saline and oxygen-rich marine settings, which offer appropriate conditions for algal growth (Martini et al. Reference Martini, Cirilli, Saurer, Abate, Ferruzza and Cicero2007; Hips & Haas, Reference Hips and Haas2009). Skeletal wackestones were deposited on the higher positions of the open platform, and carbonate mud was formed in a restricted low-energy setting, either transported offshore by episodic storm activities or into an enclosed lagoon (Davis & Dalrymple, Reference Davis and Dalrymple2012; Aghaei et al. Reference Aghaei, Mahboubi, Moussavi-Harami, Heubeck and Nadjafi2013; Li et al. Reference Li, Jing, Zou, Zhang and Xiang2017). Autochthonous bioclasts, which usually occur as fragments arranged in thin laminae with a preferred long-axis orientation, are indicative of direction from the platform interior to the margin. MA5 represents a very different setting that resulted from the temporary emergence of many platforms. Root clay and a coal streak indicate a shallow-water environment characterized by mud-flat and peat-flat deposits of restricted platforms in a warm and humid climate immediately before the end-Permian event.
Carbonate ramp: The remaining microfacies associations can be related to facies belts of a carbonate ramp. MA6, MA7 and MA8 are interpreted as deposited on a gently sloping and homoclinal carbonate ramp. MA6 is represented by wackestones with few bioclasts (e.g. bivalves, cyanobacteria, ammonoids) from the Shangsi basin section at the start of the Triassic Period. It is compatible with deposition in a low-energy outer ramp or basin setting below the SWB (Mehrabi et al. Reference Mehrabi, Rahimpour-Bonab, Enayati-Bidgoli and Navidtalab2014; Li et al. Reference Li, Jing, Zou, Zhang and Xiang2017). The sparse fauna is typical of earliest Triassic time and is seen to increase upwards (Burgess et al. Reference Burgess, Bowring and Shen2014). MA7 features bioturbated wackestones, mud-dominated fabric and severe micritization on the surface of bioclasts, which are commonly interpreted as having formed under low-energy deep-water conditions, such as the edge of a middle ramp close to the SWB (Fürsich et al. Reference Fürsich, Wilmsen, Seyed-Emami, Schairer and Majidifard2003; Flügel, Reference Flügel2010; Aghaei et al. Reference Aghaei, Mahboubi, Moussavi-Harami, Heubeck and Nadjafi2013; Li et al. Reference Li, Jing, Zou, Zhang and Xiang2017). Microgastropod packstones mixed with clast-bearing wackestones in assemblage MA8 are interpreted as having been deposited in an open inner ramp setting during the initial stage of transgression. This interpretation is based on low interstitial material and moderate-diversity fossils.
The microfacies associations – MA9 with microbialites, MA10 with dolomite and MA11 with grainstones – are believed to have formed in the subtidal zone of a restricted inner ramp and are linked in part to the progressive Early Triassic transgression, which actually began during latest Permian time (Yin et al. Reference Yin, Jiang, Xia, Feng, Zhang and Shen2014; Shen et al. Reference Shen, Zhang, Zhang, Yuan, Chen, He, Mu, Lin, Wang, Chen, Wu, Cao, Wang and Wang2019). MA9 includes bioclast-bearing or pyroclast-bearing wackestones and bindstones, which represent a relatively low-energy environment below the MLT (Flügel, Reference Flügel2010; Davis & Dalrymple, Reference Davis and Dalrymple2012; Aghaei et al. Reference Aghaei, Mahboubi, Moussavi-Harami, Heubeck and Nadjafi2013; Mehrabi et al. Reference Mehrabi, Rahimpour-Bonab, Enayati-Bidgoli and Navidtalab2014; Han et al. Reference Han, Hu, Li and Garzanti2016). Extremely rare fossils with severe micritization and fine-grained, mud-dominated fabric characterize assemblage MA10, which is interpreted to have been deposited on a shallow-marine inner ramp (corresponding to the intertidal zone between MHT and MLT) with restricted water circulation and occasional storm currents (Davis & Dalrymple, Reference Davis and Dalrymple2012; Al-Dabbas et al. Reference Al-Dabbas, Al-Jassim and Al-Jwaini2013; Han et al. Reference Han, Hu, Li and Garzanti2016). In MA11, most bioclasts have been transported from low-energy to high-energy environments, indicating the reactivation of sediments by storm currents. The coarse bioclasts and the absence of a matrix indicate a relatively high-energy shoal environment within the restricted inner ramp around the MHT (Flügel, Reference Flügel2010; Li et al. Reference Li, Jing, Zou, Zhang and Xiang2017). In addition, the micrite matrix, silt-sized intraclasts and dolomitization suggest that allochthonous limestones are from the intertidal zone (Davis & Dalrymple, Reference Davis and Dalrymple2012; Han et al. Reference Han, Hu, Li and Garzanti2016).
5.a.2. Sedimentary facies characteristics
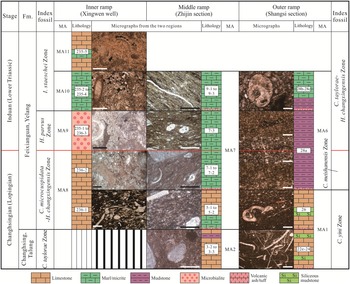
The differences in sedimentary facies in the study area are reflected in lithology, microbialites, palaeontology and microfacies (Fig. 13). During the Permian–Triassic interval, the Xingwen well was deposited under restricted marine conditions on a ramp, dominated by wackestones, packstones and some grainstones. The Zhijin section, primarily composed of mudstones and wackestones, was deposited in a toe-of-slope environment. Siliceous mudstones and wackestones were deposited in the basin of the Shangsi section (Fig. 13). The PTB transition shows a specific facies signature in each section: (i) in the Xingwen, c. 12-cm-thick microbialites overlying ostracod-bearing wackestones; (ii) in the Zhijin, cyanobacteria-bearing wackestones with miniaturized biota; and (iii) in the Shangsi, wackestones with few bioclasts. Microbialites and cyanobacteria both suggest that abnormal shallow-water carbonate ecosystems formed under high ecological pressures (high temperature and salinity) (He et al. Reference He, Wang, Yang, Liao and Weng2010; Wu et al. Reference Wu, Chen, Fang, Pei, Yang and Ogg2017 a). However, the deeper and interconnected toe-of-slope and basin partly mitigated the effects of ecological pressures felt elsewhere. In terms of microfossils, the diverse species in the Xingwen well and Zhijin section are basically consistent, including ostracods, foraminifera, brachiopods, bivalves and calcareous algae. High-energy water conditions (wide variations in salinity, temperature and light) mean that organisms in restricted marine settings are generally larger and harder than those in toe-of-slope settings (Flügel, Reference Flügel2010). Severe micritization, likely caused by excessive mud content, hampered fossil preservation in this depositional setting. Bioclasts at the bottom of the Shangsi section are dominated by siliceous radiolarians, suggesting a pelagic environment.
Speculative correlation among the study areas around the PTB strata in the study area. C. – Clarkina; H. – Hindeodus; I. – Isarcicella; MA – microfacies association. The arabic numerals are the bed numbers in each section. Note that each section has a different vertical scale. Scale bars are 0.50 mm.

The significant differences between bioassemblages in the three environments can be attributed to water depth, oxygen content and food supply (Itaki, Reference Itaki2003; Flügel, Reference Flügel2010; Pérez-Asensio et al. Reference Pérez-Asensio, Aguirre, Schmiedl and Civis2012; Linnert et al. Reference Linnert, Engelke, Wilmsen and Mutterlose2019). Under relatively deep conditions, deficient oxygen and low temperature led to the development of small-bodied, thin-shelled organisms. Community composition tends to be relatively monotonous in oxygen-poor deep-marine settings. In contrast, high-diversity communities contain large amounts of littoral organisms associated with calcareous algae, crinoids and trilobites in oxygen-rich shallow-marine settings. Food supply determines the number of marine species (Linnert et al. Reference Linnert, Engelke, Wilmsen and Mutterlose2019). The prosperity of benthos is related to a sufficient supply of food on the seafloor, whereas epiplankton (e.g. foraminifera and ammonoids) are considered to be abundant in the case of decreased nutrition in the bottom water (Didié et al. Reference Didié, Bauch and Helmke2002; Linnert et al. Reference Linnert, Engelke, Wilmsen and Mutterlose2019).
5.b. Regional sedimentary evolution and model
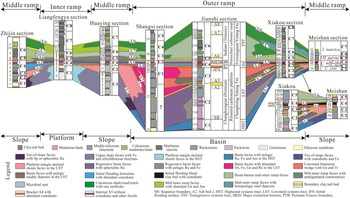
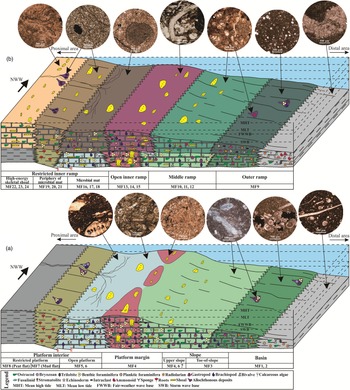
Depending on the deposition and energy mechanisms, many storm-generated sediments and their intervals can provide valuable information for palaeobathymetric calibration (Pérez-López & Pérez-Valera, Reference Pérez-López and Pérez-Valera2012; Han et al. Reference Han, Hu, Li and Garzanti2016). The correlation panel presented in Figure 14 shows the Zhijin and Shangsi sections of this study and several others. The composite Xingwen well is located between the Zhijin and Liangfengya sections (Fig. 1b). Based on detailed microfacies analysis and facies belt distribution (Fig. 14), sedimentary models for carbonate deposits are established in the study area by comparing with the carbonate platform model of Noori et al. (Reference Noori, Mehrabi, Rahimpour-Bonab and Faghih2019) and referring to the modern marine system of Counts et al. (Reference Counts, Amy, Georgiopoulou and Haughton2021) (Fig. 15).
Correlation panel of the sedimentary facies and sequence in the Permian–Triassic carbonates of the Yangtze Platform (refer to Fig. 1b for the specific position of sections; note that the spacing between the sections is not to scale and that each section has a different vertical scale). C1 – Clarkina yini Zone; C2 – C. meishanensis Zone; C3 – C. taylorae Zone; C4 – C. microcuspidata–Hindeodus changxingensis Zone; C5 – H. parvus Zone; C6 – Isarcicella staeschei Zone; C7 – I. isarcica Zone; C8 – Neogondolella krystyni Zone. Fossils: Fo – foraminifera; Os – ostracod; Sp – sponge; Ga – gastropod; Am – ammonoid; Ra – radiolarian; Tr – trilobite. Because of the special sedimentary settings of the Xingwen well and the absence of boundary clay or ash beds, it cannot be correlated with the sedimentary facies of other sections horizontally or be included in the map. Meishan section data are after Yin et al. (Reference Yin, Zhang, Tong, Yang and Wu2001).

(a) Sedimentary model of the rimmed carbonate platform and (b) the homoclinal carbonate ramp for the Permian–Triassic carbonates in the middle Upper Yangtze Platform.

With previous biostratigraphic data of the Zhijin and Shangsi sections, the sedimentary evolution is divided into two stages – the platform and the ramp – under the age constraints of volcanic claystone sequences and extinction periods of the Xingwen well (Riccardi et al. Reference Riccardi, Kump, Arthur and D’Hondt2007; Jiang et al. Reference Jiang, Lai, Yan, Aldridge, Wignall and Sun2011 b; Wang et al. Reference Wang, Bao and Kong2017). A carbonate platform developed in the Upper Yangtze Platform during the Changhsingian Age, even becoming emergent for a time in parts as sea level fell both globally and regionally (Hallam & Wignall, Reference Hallam and Wignall1992; Exxon, 1998; Yin et al. Reference Yin, Jiang, Xia, Feng, Zhang and Shen2014). As a result of high carbonate productivity, the platform developed into a carbonate ramp during the Induan Age. This model is similar to the carbonate ramp of the South Atlantic during late Aptian – early Albian time (Caetano-Filho et al. Reference Caetano-Filho, Dias-Brito, Rodrigues and Azevedo2017; Li et al. Reference Li, Jing, Zou, Zhang and Xiang2017).
-
(1) The Changhsingian platform with platform interior and platform margin was located in the southwestern part of the study area, and the toe-of-slope and basin developed in the northwestern part (Figs 1b, 15a). The platform interior, including restricted and open platforms, indicates a relatively euxinic environment. The partially denuded platform margin complex consists of marginal shoals and small-scale isolated reefs. Along the slope, the upper slope and toe-of-slope were deposited. Deposition of MF7 and MF8 on the restricted platform passed towards the open platform with skeletal packstones and wackestones (MF6) and then towards the platform margin with algae-dominated packstones (MF4). The sequence of the distal area began with toe-of-slope deposits (MF3) and transitioned to low-energy basin deposits with siliceous mudstones (MF1) and radiolarian wackestones (MF2).
-
(2) The Induan carbonate ramp was composed of restricted inner, open inner, middle and outer ramp subfacies (Fig. 15b). High-energy skeletal shoals, microbial mats and their peripheral deposits were distributed in the restricted inner ramp. The proximal sequence converted from the high-energy shoal with grainstones (MF24) to the periphery with wackestones (MF19, MF21) and then to the interior of the microbial mat with bindstones (MF17). The open inner ramp with skeletal packstones (MF13) was followed by a transition from the middle ramp with biodisturbed (MF10) and skeletal wackestones (MF11) to the outer ramp with bioclast-bearing wackestones (MF9).
The main difference between these two models is the transitional subfacies (MA3 and MA8). Unlike MA3, which is skeletal packstones with dolomitization, MA8 contains more microfacies and normally deposited clast-bearing wackestones (Fig. 15). The former is dominated by benthos, while the latter has higher biodiversity in terms of fossil fragments (Fig. 12). This is a result of the constant high carbonate productivity and the sudden, rapid relative sea-level rise during latest Lopingian time (Figs 3, 4, 13). The depositional environments evolved rather abruptly from rimmed carbonate platform conditions in the uppermost Changhsing and Talung formations to homoclinal carbonate ramps in the lowermost Feixianguan and Yelang formations during the Early Triassic Epoch.
5.c. Post-extinction-event recovery and development of marine ecosystems
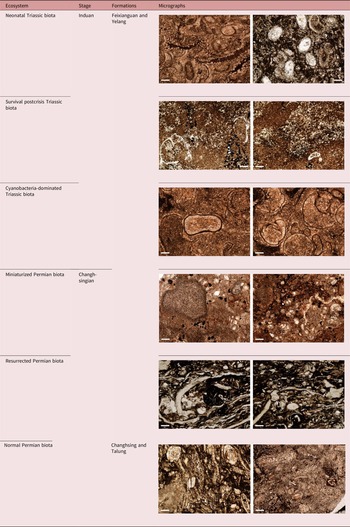
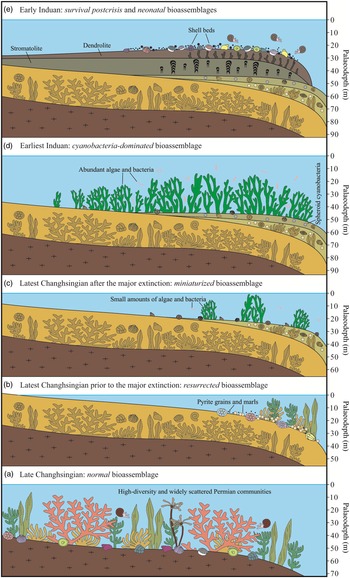
A detailed analysis of the ecosystem was performed to clarify the evolutionary history and biotic turnover across the major PTB extinction horizon. Ecosystem composition analysis also contributes to a better understanding of the bioaccretion process, the ecosystem structural composition and even the environmental conditions for carbonates (Wu et al. Reference Wu, Chen, Fang, Pei, Yang and Ogg2017 a). The distribution characteristics of the six major ecosystems are shown in Figure 16 and summarized below.
-
(1) Normal Permian biota (Fig. 16a). This biota was a widely scattered and high-contrast isochronous stratigraphic taxon before extinction. According to lateral tracing and comparison using Clarkina yini Zone as a marker, the complex consisted of (from the platform interior to the basin): (i) a platform interior bioassemblage containing primarily macrobenthos such as phylloid algae, brachiopods, LBF and echinoderms (Table 3); (ii) a platform margin bioassemblage containing littoral benthos and calcareous algae; (iii) a toe-of-slope bioassemblage containing allochthonous sediments and biota; and (iv) a basin bioassemblage containing skotoplankton (Wahlman, Reference Wahlman, Kiessling, Flügel and Golonka2002).
Table 3.Palaeontological micrographs from the Xingwen well are representative of the six major ecosystems illustrated in Figure 16

-
(2) Resurrected Permian biota (Fig. 16b). The so-called ‘sandwich’ stratigraphic assemblage comprises the lower ash bed A4, a limestone or black mudstone interlayer and the upper ash bed A5, and is common in the basal Feixianguan and Yelang formations. Spatial variations in facies and bioassemblages are clearly controlled by facies belts of the carbonate ramp system. On the outer ramp and basin, the interlayer communities inherited from the underlying basin biota are dominated by radiolarians, foraminifera, microgastropods and bivalves, with less biotic recovery. In contrast, overlying resurrected communities mark a return to dominance and rediversification by metazoans with crinoids, bivalves, echinoids, ammonoids, brachiopods, ostracods, gastropods and foraminifera, comprising up to 23% of the limestones in places. Except for this diverse biota, fusulinids, codiales, phylloid algae, sponges, cryptostomatous/trepostomatous bryozoans and trilobites (Table 3), which represent the latest Permian biota, were deposited on the inner and middle ramps (Smith, Reference Smith, Bosence and Allison1995). Endangered species during the lowstand period remained relatively abundant, while initial flooding significantly extended the living space of these organisms, as indicated by the resurrected biota in the interlayer.
-
(3) Miniaturized Permian biota (Fig. 16c). Upwards through ash bed A5, all the latest Permian biota disappeared from the ramp and abyssal environments and were replaced by the new Triassic species Claraia sp., Ophiceras sp. This fact provides sufficient evidence that the major extinction event, following temporary resuscitation of the Permian species, finally put an end to the newly resurgent and short-lived metazoan-dominated ecosystem (Flügel, Reference Flügel2010; Li et al. Reference Li, Jing, Zou, Zhang and Xiang2017). The scope of this new bioassemblage roughly coincides with ash bed A5 and the first occurrence of H. parvus (252.016–251.891 Ma) (Yuan et al. Reference Yuan, Shen, Henderson, Chen, Zhang, Zheng and Wu2019) (Fig. 5). The organisms were usually cyanobacteria clusters, with significantly miniaturized ostracods, gastropods and brachiopods (Table 3). On the outer ramp and basin, planktic foraminifera appeared once more. Biotic miniaturization provides evidence that some species passed smoothly through the end-Permian mass extinction.
-
(4) Cyanobacteria-dominated Triassic biota (Fig. 16d). The onset of this bioassemblage, representing an ecosystem characterized by high-salinity, low-energy and intense sunlight, coincides with the base of the H. parvus Zone in the Xingwen well. The major biological feature is the development of abundant spheroidal cyanobacteria associated with minor euryhaline benthos such as ostracods, microgastropods and brachiopods (Table 3). Primary producers are abundant and monotonous photoautotrophic cyanobacteria, while secondary consumers are usually metazoans living in or near them (He et al. Reference He, Wang, Yang, Liao and Weng2010). The PTB-microbialites in the study area comprise stromatolites with laminated mesostructure and dendrolites characterized by dendritic mesostructure.

Schematic diagram of the biological features and ecosystem growth stages during the changes in sea level and environmental conditions through the Permian–Triassic transition on the platform interior or inner ramp (modified after Wu et al. Reference Wu, Chen, Fang, Pei, Yang and Ogg2017 a). Note that the palaeodepths based on ammonoid assemblages are estimated values and cannot reflect the real situation (Yin & Wan, Reference Yin and Wan1996).

Although different types of microbialites occur at slightly different depths, they are commonly distributed in a low-energy and shallow-water setting with high temperature and salinity, such as intertidal and subtidal flats (Flügel, Reference Flügel2010). Fossil fragments and microfossil content decline sharply (c. 70%) from the uppermost Permian skeletal packstones (27%) into the microbialites (9%). The absence of other life forms led to a microbial bloom. This earliest Triassic microbial proliferation led to the abundance of microbialites (Lehrmann et al. Reference Lehrmann, Payne, Felix, Dillett, Wang, Yu and Wei2003; Wang et al. Reference Wang, Tong, Wang and Zhou2005; Wu et al. Reference Wu, Chen, Fang, Pei, Yang and Ogg2017 a).
-
(5) Survival post-crisis Triassic biota (Fig. 16e). The post-crisis communities located between ash beds A6 and A7 are dominated by survivors (e.g. brachiopods, foraminifera, echinoids, crinoids, gastropods and ostracods) and a variety of new organisms (Claraia sp., Ophiceras sp., cyanobacterial thallus). The earlier microbial wackestones were replaced by mudstones with sparse biota (Table 3). The region migrated into outer ramp or basin facies with minor Claraia sp. and Ophiceras sp. body fossils, representing a reduced Triassic fauna. Microfossils and fragments belonging to survivors occurred on the low-energy inner and middle ramps, while the new bivalves and ammonoids were widely distributed across various environments.
-
(6) Neonatal Triassic biota (Fig. 16e). Passing through ash bed A7 above the PTB, survival brachiopods, foraminifera and echinoids were completely replaced and died out, while the miniaturized ostracods, gastropods and crinoids established and maintained symbiosis with bivalves, ammonoids and putative cyanobacterial thalli (Table 3) until late Early Triassic time.
5.d. Bioassemblage evolution during the Permian–Triassic interval
The end-Permian – Early Triassic biosedimentary environments underwent several stages of evolution. Relative sea-level fall was illustrated by the transition from normal marine to peat bog environments, and the normal stage (Fig. 6f–h) was followed by the disappearance of LBF and other biota in a migration-decay episode. Subsequent sea-level rise and marine flooding then extended the living space and revived the attenuated species, as indicated by the latest Permian sub-biota in the basal Feixianguan and Yelang formations; this was the resurrected stage (Figs 8a, 11h). This regional flooding was part of a global rise in sea level at that time (Hallam & Wignall, Reference Hallam and Wignall1992; Tong et al. Reference Tong, Zhang, Zuo and Xiong2007). Further environmental stress then disrupted the rhythm of biotic recovery and led to extinction (Lehrmann et al. Reference Lehrmann, Payne, Felix, Dillett, Wang, Yu and Wei2003; Erwin, Reference Erwin2006; Bond & Wignall, Reference Bond and Wignall2010). Abrupt and catastrophic species extinction was followed by a slow recovery through the miniaturized (Fig. 8b, c) and microbial (Fig. 8e–g) stages. These were followed by the survival post-crisis (Fig. 9a) and neonatal (Fig. 9d–f) stages.
Overall, the iconic Permian fossils (foraminifera, bryozoans, calcareous algae, trilobites) mainly occur in the Changhsing Formation and decrease obviously but do not disappear in the lowermost Feixianguan Formation. In contrast, the faunistic occurrences of the earliest Triassic age are much less abundant. The quantity and diversity of marine fauna might be limited as a result of the outbreak of extinction and the enrichment of terrigenous sediments. From a biological perspective, the Triassic marine ecosystem in the wake of the major extinction entered a microbial era with few metazoans (consumers). This era was most likely directly related to the event but also played a crucial role in slowing biotic recovery (Chen & Benton, Reference Chen and Benton2012). Several stages of environmental stress, bioassemblage overturn and recovery seem to be the pattern leading up to and through the PTB, and conform to the single irreversible event proposed by some authors (Jin et al. Reference Jin, Wang, Wang, Shang, Cao and Erwin2000; Wang et al. Reference Wang, Tong, Wang and Zhou2005).
However, it is also important to note that the end-Permian extinction occurred in two stages. The first major extinction led to the miniaturization of palaeobios, but it took a second minor extinction to cause the outbreak of bacteria and algae and the disappearance of large amounts of ancient species. The major extinction horizon (MEH) can be calibrated to the top boundary of the latest normal Permian bioassemblage. The Lopingian bioassemblage recorded in this study consisted of trilobites, gastropods and phylloid algae, which coexisted with bivalves and brachiopods. The extinction horizon was followed by a resurrected Permian bioassemblage found in all three study sites up 14 cm above the MEH.
6. Conclusions
The end-Permian mass extinction was the largest biodiversity crisis in the history of Earth. Clarifying carbonate deposition and biological evolution around the extinction is of great significance for reconstructing geological history and interpreting species substitution, which can guide and warn of modern Earth evolution. In view of this, the Permian–Triassic carbonates in the middle Upper Yangtze Platform were studied in three depositional settings – platform, toe-of-slope and basin. The stratigraphy and sedimentology of the PTB sequences identify two depositional models: a Changhsingian rimmed carbonate platform and an Induan homoclinal carbonate ramp. This high-energy platform (interior and margin) is dominated by skeletal packstones and wackestones with abundant benthos, and passes off-platform into low-energy toe-of-slope and basin deposits. The carbonate ramp (restricted inner, open inner, middle and outer ramp) is developed from the platform and consists of mudstones and wackestones alternating with frequent storm layers.
Palaeontological observations of marine ecosystems in carbonate habitats reveal that six bioassemblages mark distinct stages of biosedimentary settings. The biota that had been migrating and decaying since the normal stage (highly diverse and widely scattered Lopingian communities) experienced a temporary revival caused by flooding in the resurrected stage (metazoans regained dominance and were rediversifying). This rhythm of recovery was disrupted by harsh ecological conditions (e.g. anoxia, high temperature and high salinity) and led to the abrupt mass extinction and miniaturized stage (miniaturized ostracods, gastropods and brachiopods). The species then entered a slow recovery of the Early Triassic microbial stage (abundant cyanobacteria and minor euryhaline benthos), and eventually reached the survival post-crisis (rare survivors and new organisms) and neonatal (miniaturized biota symbiosis with bivalves and ammonoids) stages. Several stages of environmental stress, biotic overturn and recovery characterized the extinction, resulting in a single irreversible event. The bioassemblage evolution reveals different ecological and water conditions, and will assist in the establishment of the Permian–Triassic global extinction pattern both in the Upper Yangtze Platform and elsewhere.
Acknowledgements
This study was jointly supported by the National Science and Technology Major Projects of China (grant no. 2016ZX05033-001-002), the National Natural Science Foundation of China (grant no. 41272155) and the China Scholarship Council. We thank Chaoyong Wang, Yudong Zhang and Chenglong Wu for their earlier work on thin-section analysis and core studies. We thank all the scientists who spent time on this manuscript, including editors Peter Clift and Stephen Hubbard, associate editor Johan Le Goff, and reviewers Vincenzo Randazzo and Eudald Mujal.
Conflict of interest
None.