1. Introduction
Alkali basaltic magmas are observed in several tectonic environments, including intra-continental, intra-oceanic, post-collisional and arc settings (e.g. Rostami-Hossouri et al. Reference Rostami-Hossouri, Ghasemi, Pang, Shellnutt, Rezaei-Kahkhaei, Miao, Mobasheri, Iizuka, Lee and Lin2020). Kogarko (Reference Kogarko2006) has noted that generally alkaline magmatism is most typical of stable regions where it is controlled by rift structures and occurs along zones marked by abruptly decreasing thickness of the continental lithosphere. These compositions have received considerable attention regarding their geochemistry, petrology and geodynamic evolution (Cebria et al. Reference Cebria, Lopez, Doblas, Oyarzun, Hertogen and Benito2000; Temel et al. Reference Temel, Gourgaud, Alıcı and Bellon2000, Reference Temel, Yürür, Alıcı, Varol, Gourgaud, Bellon and Demirbağ2010; Thompson et al. Reference Thompson, Ottley, Smith, Pearson, Dickin, Morrison, Let and Gibson2005; Xu et al. Reference Xu, Ma, Frey, Feigenson and Liu2005; Jung et al. Reference Jung, Jung, Hoffer and Berndt2006; Kuritani et al. Reference Kuritani, Yokoyama and Nakamura2008, Reference Kuritani, Kimura, Miyamoto, Wei, Shimano, Maeno, Jin and Taniguchi2009; Pilet et al. Reference Pilet, Baker and Stolper2008; Zeng et al. Reference Zeng, Chen, Hofmann, Jiang and Xu2011; Ducea et al. Reference Ducea, Seclaman, Murray, Jianu and Schoenbohm2013; Pang et al. Reference Pang, Chung, Zarrinkoub, Khatib, Mohammadi, Chiu, Chu, Lee and Lo2013; Torkian et al. Reference Torkian, Salehi and Sieble2016; Rostami-Hossouri et al. Reference Rostami-Hossouri, Ghasemi, Pang, Shellnutt, Rezaei-Kahkhaei, Miao, Mobasheri, Iizuka, Lee and Lin2020; Salehi et al. Reference Salehi, Torkian and Furman2020; Verma & Molaei-Yeganeh, Reference Verma and Molaei-Yeganeh2022). The alkaline basalts parental magmas were produced by relatively small degrees of melting (<5 wt %) of their heterogeneous mantle source (Fitton & Dunlop, Reference Fitton and Dunlop1985) and, as such, alkali basalts may be taken as deep probes of enriched domains in the upper mantle (Farmer et al. Reference Farmer, Glazner and Manley2002). Modern geochemical and isotopic data show that alkali–basaltic magmas are formed by melting of enriched reservoirs within the lithospheric and sub-lithospheric mantle (Thompson et al. Reference Thompson, Ottley, Smith, Pearson, Dickin, Morrison, Let and Gibson2005; Xu et al. Reference Xu, Ma, Frey, Feigenson and Liu2005; Jung et al. Reference Jung, Jung, Hoffer and Berndt2006; Kogarko, Reference Kogarko2006; Kogiso & Hirschmann Reference Kogiso and Hirschmann2006; Sobolev et al. Reference Sobolev, Hofmann, Kuzmin, Yaxley, Arndt, Chung, Danyushevsky, Elliott, Frey, Garcia and Gurenko2007; Pilet et al. Reference Pilet, Baker and Stolper2008; Kuritani et al. Reference Kuritani, Kimura, Miyamoto, Wei, Shimano, Maeno, Jin and Taniguchi2009; Zeng et al. Reference Zeng, Chen, Xu, Jiang and Hofmann2010; Ma et al. Reference Ma, Malpas, Xenophontos and Chan2011).
This study explores the petrogenesis of Plio-Quaternary mafic alkaline volcanic rocks that outcrop between the two cities of Qorveh and Bijar. This volcanic episode has been the subject of extensive research, which sets the stage for addressing the origin, age and tectonic settings of the volcanic rocks erupted during this period. The petrogenesis of these volcanic rocks is broadly related to subduction of Neo-Tethyan oceanic crust and continental collision (Malecootyan et al. Reference Malecootyan, Hagh-Nazar, Ghorbani and Emami2007; Kord, Reference Kord2012). Malecootyan et al. (Reference Malecootyan, Hagh-Nazar, Ghorbani and Emami2007) conclude that crustal contamination occurred during the upward movement of magma to the surface and this process was responsible for the distinct compositional characteristics (enrichment in Pb, Rb and Sr and depletion in Nb and Zr) of the Qorveh–Bijar volcanic rocks. Torkian et al. (Reference Torkian, Salehi and Sieble2016) documented the existence of gneissic xenoliths and quartz and alkali feldspar xenocrysts in the NW Qorveh volcanic rocks as evidence of crustal contamination phenomena that may partly overprint the geochemistry of the mantle source. Several authors suggest they derived from an ocean island basalt (OIB)-like mantle source (Moinevaziri & Amin-Sobhani, Reference Moinevaziri and Amin-Sobhani1988; Razavi & Sayyareh, Reference Razavi and Sayyareh2010). Allen et al. (Reference Allen, Kheirkhah, Neill, Emami and McLeod2013) suggested that the high La/Nb and Zr/Hf of the Qorveh–Bijar volcanic rocks indicates a mantle source which was affected by slab-derived fluids. The high Nb concentration and other geochemical features led Azizi et al. (Reference Azizi, Asahara and Tsuboi2014) to interpret these volcanic rocks as high-Nb basalts generated by partial melting of metasomatized mantle associated with adakitic magma. Recent calculations of the parental melt composition based on olivine-hosted melt inclusions demonstrated a pyroxenite source for Quaternary alkaline (Salehi et al. Reference Salehi, Torkian and Furman2020).
Here we present new interpretations based on whole-rock geochemistry (major elements, trace elements and Sr–Nd isotopes) that constrain the contribution of crustal contamination to the genesis of these rocks, as well as highlighting the possible role of subducted oceanic crust in the geochemistry of the mantle source. Detailed mineral chemistry is used to retrieve the intensive variables of the magmatic system. We integrate the petrological and geochemical information derived for the Qorveh–Bijar volcanic belt to provide additional constraints on the melting conditions of the mantle source beneath the Arabian–Eurasian collision zone.
2. Geological setting
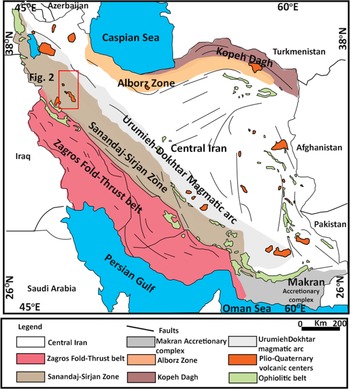
The Cenozoic continental collision between the Iranian and Arabian plateaus is manifest in widespread magmatic and metamorphic features in Iran. The subduction of Neo-Tethyan oceanic lithosphere beneath eastern Turkey and Iran initiated during Early Jurassic or Late Triassic time (Dewey et al. Reference Dewey, Pitman, Ryan and Bonnin1973; Berberian & King, Reference Berberian and King1981; Alavi, Reference Alavi1994; Stampfli & Borel, Reference Stampfli and Borel2002; Hassanzadeh & Wernicke, Reference Hassanzadeh and Wernicke2016; Barber et al. Reference Barber, Stockli, Horton and Koshnaw2018; Tavakoli et al. Reference Tavakoli, Davoudian, Shabanian, Azizi, Neubauer, Asahara and Bernroider2020). Subsequent northward motion of the Arabian plate following final closure of Neo-Tethys occurred during the late Oligocene – early Miocene (e.g. Dewey et al. Reference Dewey, Pitman, Ryan and Bonnin1973; Berberian & King, Reference Berberian and King1981; Alavi, Reference Alavi1994; Mouthereau et al. Reference Mouthereau, Lacombe and Vergés2012; Hassanzadeh & Wernicke, Reference Hassanzadeh and Wernicke2016; Barber et al. Reference Barber, Stockli, Horton and Koshnaw2018; Tavakoli et al. Reference Tavakoli, Davoudian, Shabanian, Azizi, Neubauer, Asahara and Bernroider2020) or the Late Cretaceous – Oligocene (Mohajjel & Fergusson Reference Mohajjel and Fergusson2014). The closure of Neo-Tethys has given rise to the East Anatolian and Iranian plateaus to the north and east, respectively, of the Bitlis–Zagros suture (Fig. 1).
Late Cenozoic volcanic centres and active faults in Iran. The study area is included in the red rectangle (the rectangle shows the study area from Allen et al. Reference Allen, Kheirkhah, Neill, Emami and McLeod2013).

There are considerable variations in the style and quantity of magmatism after the Arabia–Eurasia collision. Magmatic rocks ranging in age from Miocene to Quaternary are geographically dispersed, volumetrically modest and chemically varied. The complex continental collision zone in western Iran (Fig. 1) consists of the Zagros fold-and-thrust belt (ZFTB), the Sanandaj–Sirjan zone (SaSZ), and the Urumieh–Dokhtar magmatic belt (UDMB) (Berberian & King, Reference Berberian and King1981; Alavi, Reference Alavi1994; Hassanzadeh & Wernicke, Reference Hassanzadeh and Wernicke2016; Tavakoli et al. Reference Tavakoli, Davoudian, Shabanian, Azizi, Neubauer, Asahara and Bernroider2020). The SaSZ can be divided into distinct northern and southern sections (Eftekharnejad, Reference Eftekharnejad1981; Ghasemi & Talbot, Reference Ghasemi and Talbot2006). The northern section is mainly composed of an old island arc and an active continental margin that collided in the Late Jurassic – Early Cretaceous. The southern section consists entirely of metamorphic basement with evidence of polyphase deformation and metamorphism (Azizi & Asahara, Reference Azizi and Asahara2013). The SaSZ has been intruded by A-, S- and I-type granitoid batholiths emplaced from Jurassic to Oligocene time (e.g. Sepahi & Athari, Reference Sepahi and Athari2006; Mansouri-Esfahani et al. Reference Mansouri-Esfahani, Khalili, Kochhar and Gupta2010; Shahbazi et al. Reference Shahbazi, Siebel, Pourmoafee, Ghorbani, Sepahi, Shang and Abedini2010; Torkian & Furman, Reference Torkian and Furman2015; Yeganeh et al. Reference Yeganeh, Torkian, Christiansen and Sepahi2018).
Between the Main Zagros Thrust (MZT) in the southwest and the Tabriz Fault in the northeast, Azizi & Moinevaziri (Reference Azizi and Moinevaziri2009) proposed a subdivision of SaSz in northwestern Iran that is of Cretaceous and Eocene–Miocene to Quaternary age, trending in a NW–SE direction and including three minor volcanic belts: (1) the Sonqor–Baneh volcanic belt (SBVB), (2) the Hamedan–Tabriz volcanic belt (HTVB) and (3) the Cretaceous volcanic belt (SCVB) (see fig. 3 in Azizi & Moinevaziri, Reference Azizi and Moinevaziri2009). The SCVB consists mainly of mafic to intermediate submarine volcanics of calc-alkaline affinity, and the SBVB is composed of basalt, as well as gabbro to dioritic bodies, with extrusive to sub-volcanic magmatic textures and tholeiitic to alkaline affinity.
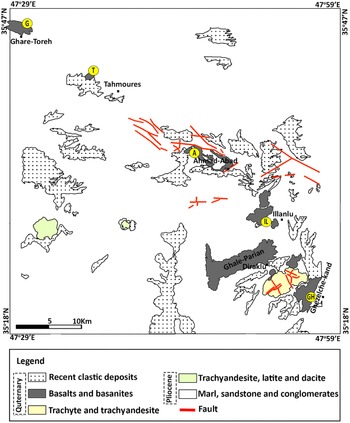
The HTVB extends across the Hamedan to Tabriz and consists of Miocene to Plio-Quaternary extrusive rocks. The northern part of this belt has Miocene volcanic rocks with adakitic features (Azizi et al. Reference Azizi, Asahara and Tsuboi2014; Lechmann et al. Reference Lechmann, Burg, Ulmer, Guillong and Faridi2018; Torkian et al. Reference Torkian, Furman, Salehi and Veloski2019; Shahbazi et al. Reference Shahbazi, Maghami, Azizi, Asahara, Siebel, Maanijou and Rezai2021). The southern part consists of two different volcanic suites: felsic to intermediate rocks of Miocene age and Plio-Quaternary basalts (Şengör & Kidd, Reference Şengör and Kidd1979; Kheirkhah & Mirnejad, Reference Kheirkhah and Mirnejad2014). Here we investigate mafic volcanic rocks in the HTVB located between the cities of Qorveh and Bijar (i.e. 35° 18′–35° 30′ N, 47° 46′– 47° 59′ E; Fig. 2). The results of K–Ar whole-rock dating in Qorveh–Bijar conducted by Boccaletti et al. (Reference Boccaletti, Innocenti, Manetti, Mazzuoli, Motamed, Pasquare, Radicati di Brozolo and Amin Sobhani1976) suggest that the volcanic activity occurred during the Quaternary, from 1.3 ± 0.08 to 0.5 ± 0.15 Ma.
Schematic geological map showing the location of lava flows in the study area. After Emami et al. (Reference Emami, Sadeghi and Omrani1993). The sampling sites are shown. Abbreviations in the diagram are Gh (Ghezelche-Kand), IL (Illanlu), A (Ahmad-Abad), T (Tahmoures) and G (Ghare-Toreh).

3. Field relationships
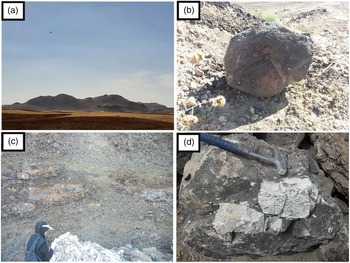
The Qorveh–Bijar volcanic products comprise bombs, scoria, lapilli tuffs and lava flows with an individual thickness up to several tens of metres (Fig. 3a, b); we refer to these units collectively as the QBB (Qorveh–Bijar basaltic rocks). Cinder cones represent the youngest phase of magmatism in the region, preserving their geological structures over the lava flows. The lava flows cover the argillaceous limestone of Miocene to Pliocene time. There is no significant deposition postdating the lava flows, and three-dimensional structures are exposed through dissection by an external drainage (Fig. 3c).
Overview of the products object of this study. (a) Scoria cones, (b) volcanic bombs, (c) scoria and lavas and (d) gneissic xenoliths.

Felsic gneissic xenoliths are frequently observed in the basaltic rocks and some of these xenoliths are larger than 10 cm (Fig. 3d).
4. Material and methods
4.a. Whole-rock geochemistry
Whole-rock major and trace element contents of the studied samples were determined on glassy pills synthetized with the Pt-loop technique at 1600 °C in a chamber furnace installed at the HP-HT Laboratory of Experimental Volcanology and Geophysics of the Istituto Nazionale di Geofisica e Vulcanologia (INGV; Rome, Italy). The pills were then analysed using an electron probe microanalyser (EPMA) Jeol-JXA8200 with combined energy-dispersive spectrometry – wavelength-dispersive spectrometry (EDS-WDS; five spectrometers with 12 crystals) using 15 kV accelerating voltage and 10 nA electric current. A slightly defocused electron beam with a size of 3 μm was used, with a counting time of 5 s on background and 15 son peak. Sodium and potassium were analysed first to prevent alkali migration effects. The accuracy of the microprobe was measured through the analysis of well-characterized synthetic oxides and mineral standards. Based on counting statistics, analytical uncertainties relative to their reported concentrations indicate that precision was better than 5 % for all cations.
Trace element compositions of whole rocks were measured by laser ablation inductively coupled plasma mass spectrometry (LA-ICP-MS) conducted at the Institute of Geochemistry and Petrology of ETH Zürich (Switzerland) using a 193 nm ArF Excimer laser from Resonetic coupled to a Thermo Element XR ICP-MS. A spot size of 43 μm was used for mineral analyses and reduced to 20 μm for glass analyses; output energy of the laser beam was typically ∼3.5 J cm−2. NIST612 and NIST610 were adopted as external standards for the data reduction. United States Geological Survey (USGS) reference glass GSD-1G was used as a secondary standard to monitor instrument accuracy. When appropriate, major element concentrations from EPMA analyses were used as internal standards. Long-term laboratory reproducibility of homogeneous glass standards indicates precision significantly better than 5 % for elements whose concentration was much greater (i.e. ≥2×) than the detection limit.
4.b. Isotope analysis
Radiogenic isotopic data were obtained at the Department of Earth Science, University of Cape Town (South Africa). Approximately 50 mg of the powdered rock was dissolved in a 4:1 HF/HNO3 acid mixture in sealed Savillex beakers for 48 h, and then the solution was split for determination of both concentration data (Rb, Sr, Nd and Sm), and Sr and Nd isotope ratios. The Sr and Nd fractions for isotope analyses were isolated employing sequential column chemistry (after Pin et al. Reference Pin, Briot, Bassin and Poitrasson1994; Pin & Zalduegui, Reference Pin and Zalduegui1997; Míková & Denková, Reference Míková and Denková2007). The Sr and Nd isotope data were obtained using a Nu Plasma HR mass spectrometer equipped with a DSN-100 desolating nebulizer. All Sr isotopes were referenced to a value of 0.710255 for the bracketing analyses of NIST SRM987. During the analysis, Sr isotope data were corrected for Rb interferences using the measured signal for 85Rb and the natural 85Rb/87Rb ratio, while instrumental mass fractionation was addressed using the exponential law and the 86Sr/88Sr ratio of 0.1194. The Nd isotope values were normalized to 0.512115 for bracketing analyses of JNdi-1. These data were then corrected for Sm and Ce interferences using the signals measured for 147Sm and 140Ce and natural Sm and Ce isotope abundances, while instrumental mass fractionation was addressed using the exponential law and the 146Nd/144Nd ratio of 0.7219.
5. Results
5.a. Petrography
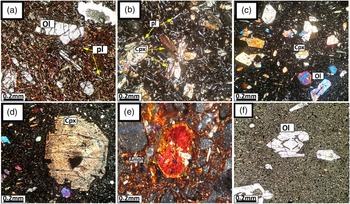
The studied samples are generally fresh and show porphyritic and microlithic textures (Fig. 4a–c). Phenocrysts and microphenocrysts (35–45 vol. %) are represented primarily by clinopyroxene and olivine; in some cases amphibole and biotite are present as accessory phases (Fig. 4e). The groundmass (<35 vol. %) includes microlites of clinopyroxene, acicular plagioclase and opaque minerals (titanomagnetite), all coexisting with glass (∼20 vol. %). Glomeroporphyritic aggregates of olivine and clinopyroxene are observed in some samples.
Representative photomicrographs of the studied volcanic rocks. (a) Microlithic porphyry texture; (b) glomeroporphyry texture; (c) porphyry texture; (d) sieve texture of clinopyroxene; (e) amphibole; (f) skeletal olivine. Ol: Olivine; Cpx: Clinopyroxene; Qtz: Quartz; Bt: Biotite; Pl: Plagioclase.

5.b. Mineral chemistry
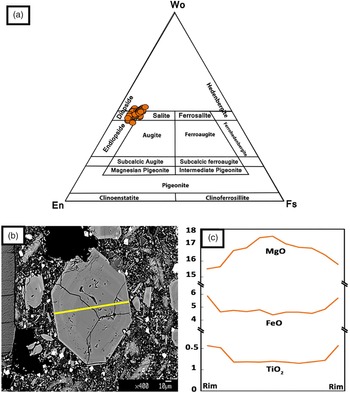
All mineral compositional data are provided in supplemental files as Tables S1 and S2 (available online at https://doi.org/10.1017/S0016756823000018). Clinopyroxene up to 2 mm is the most abundant mafic mineral phase in all studied rocks. The crystals are commonly euhedral to subhedral and display normal and oscillatory zoning. Some crystal cores and rims show sieve textures with embayments (Fig. 4d). The absence of reaction rims is considered as an indicator of equilibrium between the crystal and the host magma. The clinopyroxenes (Fig. 5a) are classified as diopside to salite with Wo41.3-49.4, En36.4-47.6, Fs6.6–12, Mg# 0.40–0.89 (Mg# expressed as molar Mg/(Mg + Fe+2) where iron is Fe2+ total). Many crystals are slightly zoned, showing increasing TiO2 and FeO concentrations and decreasing MgO contents towards the rims (Fig. 5b, c).
(a) Classification scheme of Morimoto et al. (Reference Morimoto, Fabries, Ferguson, Ginzburg, Ross, Seifert and Zussman1988), showing that the pyroxenes are diopside–salite in composition; (b) backscattered electron image microphotograph of clinopyroxene from Illanlu (IL-C7); and (c) mineral compositional variation from rim to rim.

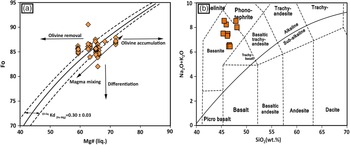
Olivine is the second most abundant phenocryst phase. Crystals are euhedral to subhedral in shape, showing sporadically skeletal and glomeroporphyritic textures (Fig. 4). Some of the olivine phenocrysts display a dissolving–erosion structure, while in other cases the crystals are broken and replaced with iddingsite along fractures and rims. The forsterite content of olivine is variable (Fig. 6a) and generally decreases from core to rim following the normal growth zoning. The highest forsterite content (Fo82–88) is measured in olivine crystals from the Illanlu area. The CaO content of olivine ranges from 0.16 to −2.9 wt %, which is higher than olivine from mantle xenoliths (CaO <0.1 wt %; Thompson & Gibson, Reference Thompson and Gibson2000).
(a) Variations of forsterite content in olivine vs Mg# of whole rock. Olivines in equilibrium with the host lavas plot between the dashed lines; (b) Na2O + K2O (wt %) vs SiO2 (wt %) diagram for the QBB rocks (Le Bas et al. Reference Le Bas, Maitre, Streckeisen and Zanettin1986).

5.c. Whole-rock geochemistry
Representative whole-rock (major and trace element) compositions are given in the supplemental file as Table S3 (available online at https://doi.org/10.1017/S0016756823000018). The studied rocks are identified as basanite and phono-tephrite with alkaline affinity in a plot of total alkalis vs SiO2 (Le Bas et al. Reference Le Bas, Maitre, Streckeisen and Zanettin1986) (Fig. 6b); they are generally sodic with Na2O > 2 + K2O.
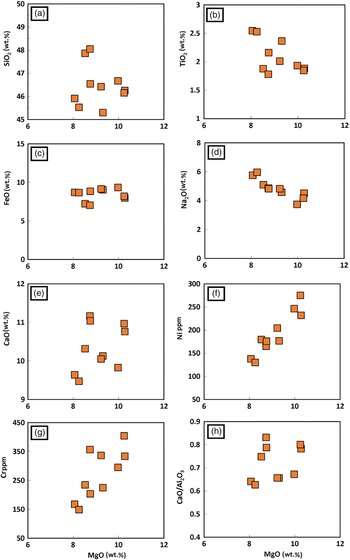
QBB rocks contain 45.3–48.0 wt % SiO2, 8.1–10.3 wt % MgO, and their Mg# (Mg# = Mg/(Mg + Fe)) ranges from 65 to 72. Variations in Al2O3, Na2O, K2O and SiO2 vs MgO do not define clear trends, and no systematic variations are found between Sr, Nb, La, Th and MgO. However, MgO contents correlate positively with CaO, Ni and Cr (Fig. 7).
Bivariate diagrams of selected major and trace elements against MgO (wt %).

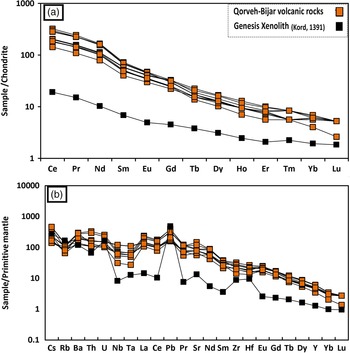
Figure 8 shows the chondrite-normalized rare earth elements (REE) and the primitive-mantle-normalized trace element patterns of the QBB rocks. Similar to other intraplate alkaline basalts (Zou et al. Reference Zou, Zindler, Xu and Qi2000; Wilson & Patterson, Reference Wilson and Patterson2001; Shaw et al. Reference Shaw, Baker, Menzies, Thirlwall and Ibrahim2003; Aydin et al. Reference Aydin, Karsli and Chen2008; Asan & Kurt, Reference Asan and Kurt2011; Pang et al. Reference Pang, Chung, Zarrinkoub, Khatib, Mohammadi, Chiu, Chu, Lee and Lo2013), all the samples are enriched in light REE (LREE), exhibiting steep REE patterns (Fig. 8a) with (La/Yb)N values ranging from 33.1 to 68.3. The sub-parallel and tight REE patterns suggest that these volcanic rocks originated from a common mantle source. The QBB are enriched in large-ion lithophile elements (LILE) (Cs: 1.1–3.6 ppm; Sr: 1586–3080 ppm; Pb: 11.2–28.1 ppm), and display negative Nb–Ta anomalies on primitive-mantle normalized abundance diagrams, which is a known characteristic of lavas derived from a mantle source with subduction-modified material or crustal contamination (Fig. 8b).
(a) Chondrite-normalized REE diagram and (b) primitive-mantle-normalized trace element diagram for QBB rocks. Normalization values from Sun & McDonough (Reference Sun and McDonough1989).

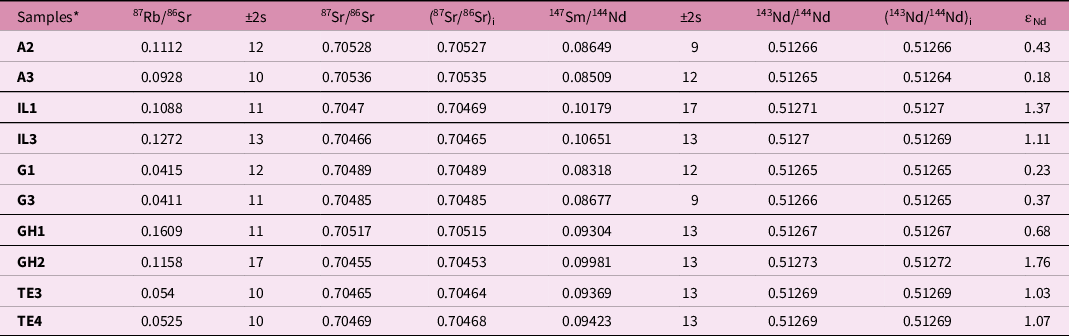
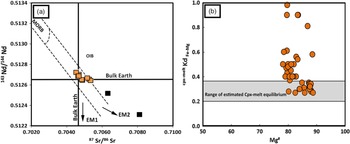
Whole-rock Nd–Sr isotopic analyses for QBB are reported in Table 1. Initial 87Sr/86Sr and 143 Nd/144Nd ratios of QBB range from 0.70453 to 0.70535 and from 0.512643 to 0.512722 (ϵ Nd +0.23 to +1.76), respectively. The QBB rocks plot close to the composition of the bulk silicate earth and have lower values of 87Sr/86Sr in comparison to the gneissic xenoliths (Azizi et al. Reference Azizi, Asahara and Tsuboi2014) which are considered as continental crust components in the study area (Fig. 9a).
Rb–Sr and Sm–Nd isotopic data for the Qorveh–Bijar basaltic rocks

* The age correction is based on the ages calculated by Boccaletti et al. (Reference Boccaletti, Innocenti, Manetti, Mazzuoli, Motamed, Pasquare, Radicati di Brozolo and Amin Sobhani1976).
(a) 87Sr/86Sr vs 143Nd/144Nd. The compositions of Enriched Mantle 1 (EM1) and Enriched Mantle 2 (EM2) reservoirs come from Zindler & Hart (Reference Zindler and Hart1986). The fields for OIBs and high-μ (HIMU) come from Hart (Reference Hart1988), and the composition of gneissic xenoliths comes from Azizi et al. (Reference Azizi, Asahara and Tsuboi2014). (b) The Mg# of clinopyroxene is plotted against the value of cpx-meltKdFe–Mg (Putirka et al. Reference Putirka, Ryerson and Mikaelian2003; Putirka, Reference Putirka2008). Values of cpx-meltKdFe–Mg closely match both the equilibrium ranges of 0.27 ± 0.03 and 0.28 ± 0.08 indicated by Putirka et al. (Reference Putirka, Ryerson and Mikaelian2003) and Putirka (Reference Putirka2008), respectively.

5.d. Intensive parameters
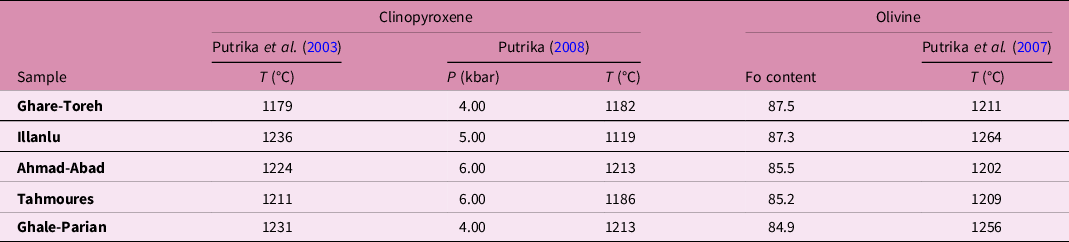
The pressure and temperature conditions of magmas were estimated using the clinopyroxene-melt based thermobarometric models of Putirka et al. (Reference Putirka, Ryerson and Mikaelian2003) and Putirka (Reference Putirka2008), using as input data the compositions of the early-formed crystal cores and the whole-rock analyses (i.e. the original magma compositions). To ascertain whether the clinopyroxene-melt pairs were effectively in equilibrium at the time of crystallization, we employed the equilibrium test of Putirka (Reference Putirka2008) based on Fe–Mg exchange between clinopyroxene core and whole rock (Fig. 9b). As seen in Figure 9b, values of cpx-meltKdFe–Mg closely match, with both the equilibrium ranges of 0.27 ± 0.03 and 0.28 ± 0.08 indicated by Putirka et al. (Reference Putirka, Ryerson and Mikaelian2003) and Putirka (Reference Putirka2008) (their eqs. 32a and 33), respectively. Calculations based on equilibrium clinopyroxene–melt pairs yield pressures and temperatures of 4–6 (±1.8) kbar and 1182–1213 (±27) °C, respectively (Table 2).
Results from clinopyroxene-based thermobarometery, olivine-based thermometry for QBB rocks

Olivine–melt equilibria are particularly useful for liquidus temperature estimates because the Fe–Mg exchange reaction is nearly constant over a wide range of temperature, bulk composition and oxygen fugacity (i.e. Ol-meltKdFe–Mg = 0.30 ± 0.03), and because the olivine Fo content is highly sensitive to the thermal path of magma (e.g. Roeder & Emslie Reference Roeder and Emslie1970; Kuritani et al. Reference Kuritani, Xia, Kimura, Liu, Shimizu, Ushikubo, Zhao, Nakagawa and Yoshimura2019; Rollinson Reference Rollinson2019). Using the olivine-based thermometer approach of Putirka et al. (Reference Putirka, Perfit, Ryerson and Jackson2007) (their eq. 4), we find that Fo85–87 olivine is in equilibrium with the whole-rock data (Fig. 6a), yielding crystallization onset temperatures of 1212–1264 (±27) °C.
6. Discussion
6.a. Fractional crystallization and crustal contamination
Post-melting processes including fractional crystallization and crustal contamination present challenges to deciphering trace element data to determine the nature and composition of the melt source region. We consider the QBB rocks with MgO >10 wt %, Ni ∼300 ppm and Cr >400 ppm to be primary mantle melts. Ni, Cr and CaO contents decrease with decreasing MgO (Fig. 7f–g), consistent with minor fractionation of olivine, clinopyroxene and probably chromian spinel from parental magma. This interpretation is also supported by petrological observations.
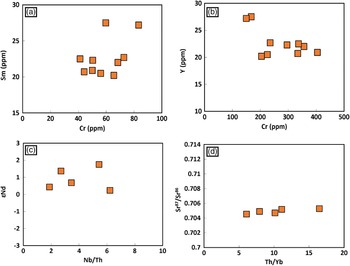
Values of Eu/Eu* (0.9–1) and the lack of negative Eu anomalies in chondrite-normalized REE diagrams (Fig. 8) suggest that there is no significant plagioclase fractionation involved in the petrogenesis of the QBB rocks. Many QBB rocks have Ba and Sr abundances that record incompatible behaviour of these elements, consistent with olivine and clinopyroxene fractionation in the absence of plagioclase formation. Following Pang et al. (Reference Pang, Chung, Zarrinkoub, Mohammadi, Yang, Chu, Lee and Lo2012), the absence of negative correlations between Y or Sm, elements with comparatively higher Kd values for amphibole–liquid compared to pyroxene–liquid, and Cr (an index of fractionation) (Fig. 10a and b) indicates that amphibole fractionation was not substantial.
(a) Y (ppm) vs Rb (ppm) and (b) Sm vs Rb diagrams for investigating the fractional crystallization for the QBB rocks; (c) Th/Yb vs 87Sr/86Sri and (d) Nb/Th vs ϵ Nd for studied rocks.

Before eruption, intra-plate basalts pass through thick continental crust, creating the possibility that they become contaminated by the crust. The QBB magmas had to pass through the thick continental lithosphere of western Iran (∼110 km; Tunini et al. Reference Tunini, Jimenez-Munt, Fernandez, Verges and Villasenor2014), in which contamination may potentially occur. Indeed, the presence of abundant gneissic xenoliths provides evidence for this process. Numerous mantle xenoliths and xenocrysts are found in the study area; most of the xenoliths are fragmented in appearance with angular edges, suggesting that the host magma ascended too rapidly for them to melt, and thus too rapidly for crustal contamination to play a significant role in the petrogenesis of the QBB (Torkian et al. Reference Torkian, Salehi and Sieble2016; Salehi et al. Reference Salehi, Torkian and Furman2020). The upper continental crust is characterized by enrichment in LILE, depletion in high-field-strength elements (HFSE), high SiO2 (66.6 wt %; Rudnick et al. Reference Rudnick, Gao, Holland and Turekian2003) and enriched Sr–Nd isotopic compositions (87Sr/86Sr = 0.7130, ϵ Nd −15; Gan et al. Reference Gan, Zhang, Barry, He and Wang2018). Consequently, magmas contaminated by continental material should be characterized by elevated SiO2 and LILE concentrations as well as 87Sr/86Sr ratios, but lower HFSE concentrations and 143Nd/144Nd ratios. We emphasize that the QBB lava geochemistry does not display these key features. Further, the lack of systemic positive correlations in plots of Nb/Th – ϵNd and Th/Yb – 87Sr/86Sr (Yu et al. Reference Yu, Chen, Lan, He, Chen and Song2020) implies negligible crustal contamination (Fig. 10c–d).
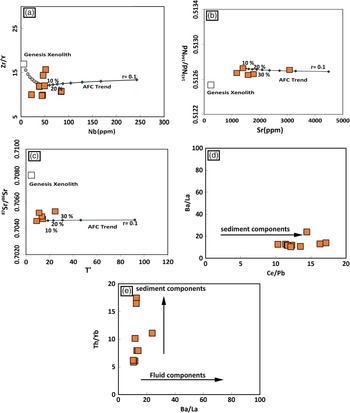
We employed FC–AFC–FCA® and mixing model software of Ersoy & Helvaci (Reference Ersoy and Helvaci2010) to investigate more fully the possible occurrence of crustal contamination; the model was constrained by the concentrations of incompatible trace elements Nb, Zr and Y in the mafic lavas and the original partition coefficients set in the model (Fig. 11). Primitive mafic lava GH2 with 45.3 wt % SiO2 and 9.3 wt % MgO is assumed as the starting magma composition for AFC modelling. The composition of the contaminant is that of gneissic xenolith sample EGH6 which contains Nb, Zr and Y 5.79 ppm, 98 ppm and 5.77 ppm, respectively (Kord, Reference Kord2012). The investigated ratio of assimilation to fractionation (r) is 0.1, as higher r values would be inconsistent with the primitive MgO contents of the erupted products. Calculated model results plotted in the Zr/Y vs Nb diagram (Fig. 11a) essentially rule out the possibility that the geochemical signature of magmas is due to binary mixing with the continental crust or gneissic xenoliths. Rather, Nb enrichment results from its incompatibility in the fractionating phases of olivine and clinopyroxene. Correlations between 87Sr/86Sr vs Th and Nd143/Nd144 vs Sr further support the trace element modelling, show a limited role for contamination (∼5 %) and make it clear that the enriched nature of the QBB rocks could not result from crustal contamination (Fig. 11 b–c).
Geochemical evidence for crustal contamination in Qorveh–Bijar lavas. (a) AFC modelling for the QBB rocks (gneissic xenoliths of Kord, Reference Kord2012); (b) 143Nd/144Nd vs Sr (Moghadam et al. Reference Moghadam, Ghorbani, Khedr, Fazlnia, Chiaradia, Eyuboglu, Santosh, Francisco, Martinez, Gourgaud and Arai2014); (c) 87Sr/86Sr vs Th (ppm) (Ersoy et al. Reference Ersoy, Helvacı, Uysal, Karaoğlu, Palmer and Dindi2012) with modelled assimilation – fractional crystallization pathways (AFC; r = 0.4 curve); (d) Ba/La vs Ce/Pb and (e) Th/Yb vs Ba/La plots to assess the effects of subducted slab materials on the mantle source of QBBs.

The primitive-mantle-normalized incompatible trace element abundance patterns of the QBB are characterized by negative anomalies in Nb and Ta which are a distinctive signature of subduction-related magmas (Wilson, Reference Wilson1989). Therefore, the simple mixing process between a primitive-mantle-derived magma and crustal material cannot be considered a viable mechanism to generate the observed trace element concentrations, and we must consider other factors such as enrichment of the mantle source by subduction components.
6.b. Mantle nature and modelling of melting
Distinguishing the source lithology is pivotal for interpreting the magmatic processes and origin of mantle-derived magmas. This identification can provide important constraints on crustal recycling and/or mantle metasomatism that may have contributed to mantle heterogeneity (Wang et al. Reference Wang, Li, Li, Li, Liu, Long, Zhou and Wang2012, Reference Wang, Li, Li, Pisarevsky and Wingate2014). Peridotites are abundant in the upper mantle, and the vast majority of Earth’s basaltic lavas form through peridotite melting (Hirose & Kushiro, Reference Hirose and Kushiro1993; Walter, Reference Walter1998; Rhodes et al. Reference Rhodes, Huang, Frey, Pringle and Xu2012). Experimental investigations, however, show that partial melts of volatile-free mantle peridotite are unable to match several important geochemical features of intra-plate basalts, including their TiO2, CaO, FeO* and Al2O3 contents (Hirose & Kushiro, Reference Hirose and Kushiro1993; Hirschmann et al. Reference Hirschmann, Kogiso, Baker and Stolper2003; Kogiso et al. Reference Kogiso, Hirschmann and Frost2003). As a result, intra-plate basalts have been suggested to be generated from pyroxenite, peridotite + CO2, and hornblendite source lithologies (Pilet et al. Reference Pilet, Baker and Stolper2008; Ying et al. Reference Ying, Zhang, Tang, Su and Zhou2013). The results of experimental studies illustrate that peridotite and pyroxenite may play a pivotal role in the genesis of basaltic magmas. The existence of pyroxenite in the mantle source of basaltic rocks can be discerned by comparing the major and trace elements chemistry of basaltic magmas with high-pressure experimental products (e.g. Hirschmann et al. Reference Hirschmann, Kogiso, Baker and Stolper2003; Kogiso et al. Reference Kogiso, Hirschmann and Frost2003; Sobolev et al. Reference Sobolev, Hofmann, Kuzmin, Yaxley, Arndt, Chung, Danyushevsky, Elliott, Frey, Garcia and Gurenko2007).
The incompatible element enrichment observed in the QBB rocks could be derived directly from an enriched mantle source (Fig. 8). However, the geodynamic history of the studiy area (SaSZ) leads us to investigate the possible occurrence of mantle metasomatism. It is accepted that slab-derived fluid or melts from ancient Neo-Tethyan oceanic slab subduction beneath the study area could affect the geochemical signature of the mantle source (Agard et al. Reference Agard, Omrani, Jolivet, Whitechurch, Vrielynck, Spakman, Monié, Meyer and Wortel2011). The Ce/Pb ratio is sensitive to the proportion of sediment melt components: subducted sediments incorporated wholesale will increase Ce/Pb values of resulting lavas, whereas fluid components will decrease it because they are rich in fluid-mobile Pb (Tatsumi, Reference Tatsumi2000). We note that in the plot of Ba/La vs Ce/Pb (Fig. 11d), QBB rocks manifested the effects of sediment components in the mantle source. This is an excellent indicator of the type of sedimentary component because sediment-bound Pb is not mobilized by hydrous fluid, whereas it is incompatible during the melting of pelagic sediments (Class et al. Reference Class, Miller, Goldstein and Langmuir2000; Johnson & Plank, Reference Johnson and Plank2000). Moreover, high Th levels are commonly interpreted as reflecting the predominance of a component of subducted pelagic sediments in the magma source (Kirchenbaur et al. Reference Kirchenbaur, Munker and Marchev2009; Kirchenbaur & Munker, Reference Kirchenbaur and Munker2015). The Th/Yb vs Ba/La plot shows that the QBB rocks array supports the involvement of melt components derived from sediments – but not fluids – during the enrichment of the mantle (Fig. 11e).
In addition to incorporating subducted sediments, the mantle source of the QBB experienced metasomatism by silicate melts. Clinopyroxenitic xenoliths have been reported in the Qorveh–Bijar basaltic rocks (Kord, Reference Kord2012) and in Plio-Quaternary alkali basalts of the Marand area in NW Iran (Khezerlou et al. Reference Khezerlou, Amel, Gregoire, Moayyed and Jahangiri2017). These samples provide valuable information on the nature and evolution of the lithospheric mantle in these areas (Downes, Reference Downes1993; Griffin et al. Reference Griffin, Doyle, Ryan, Pearson, Suzanne, Davies, Kivi, Van Achterbergh and Natapov1999; Zhang et al. Reference Zhang, Mahoney, Mo, Ghazi, Milani, Crawford, Guo and Zhao2005; Nasir et al. Reference Nasir, Al-Sayigh, Alharthy and Al-Lazki2006; Ackerman et al. Reference Ackerman, Spacek, Medaris, Hegner, Svojtka and Ulrych2012; Saadat & Stern, Reference Saadat and Stern2012; Ying et al. Reference Ying, Zhang, Tang, Su and Zhou2013).
Complex and diverse mechanisms have been proposed for the formation of pyroxenite veins or zones (Sobolev et al. Reference Sobolev, Hofmann, Kuzmin, Yaxley, Arndt, Chung, Danyushevsky, Elliott, Frey, Garcia and Gurenko2007; Herzberg, Reference Herzberg2011). Mantle pyroxenite can be generated by melting unmodified recycled basaltic crust (stage I pyroxenite) or by the reaction of melted subducted oceanic crust with solid peridotite (stage II pyroxenite; Sobolev et al. Reference Sobolev, Hofmann, Sobolev and Nikogosian2005). As the MgO content of QBB lavas (avg. MgO 9.2 wt %) are expected to be higher from melts of stage I pyroxenite (<8 wt % MgO; Pertermann & Hirschmann, Reference Pertermann and Hirschmann2003), we consider the melting of stage II pyroxenite. The experimental studies of Sobolev et al. (Reference Sobolev, Hofmann, Sobolev and Nikogosian2005) show that eclogite has a lower solidus temperature than peridotite in the lithospheric mantle, therefore eclogite begins melting at higher pressures and greater depth. This melt has high Si concentration and can easily react with olivine-bearing peridotite, converting it to a solid olivine-free pyroxenite. Pyroxenites that result from silicate-melt-modified mantle are often considered the source of oceanic island and intercontinental basaltic rocks (Herzberg, Reference Herzberg2006), and the geochemical characteristics of QBB lavas suggest it is the source of these eruptives.
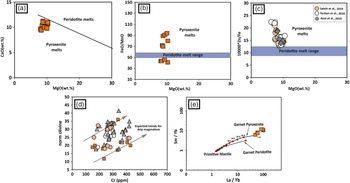
Mafic melts derived from pyroxenite sources are geochemically distinguishable from melts originating from peridotite sources (Zeng et al. Reference Zeng, Chen, Hofmann, Jiang and Xu2011; Sheldrick et al. Reference Sheldrick, Hahn, Ducea, Stoica, Constenius and Heizler2020); these geochemical signatures are observed consistently in the QBB rocks and suggest contribution from a pyroxenite mantle source. First, melts of pyroxenite have lower CaO contents compared with peridotite-derived basaltic rocks of similar MgO content. While Ca is incompatible with olivine (DCaO l = 0.02; Leeman & Scheidegger, Reference Leeman and Scheidegger1977), the primary constituent of peridotite, it is compatible with clinopyroxene (DCaCpx = 1.8–2.0; Pertermann & Hirschmann, Reference Pertermann and Hirschmann2002). As a result, the CaO content of pyroxenite melts will be lower than that of peridotite melts, as observed in the low CaO content of QBB lavas (Fig. 12a). Second, the QBB lavas have high Fe/Mn values which, following Kogiso & Hirschmann (Reference Kogiso and Hirschmann2001) and Le Roux et al. (Reference Le Roux, Lee and Turner2010), can be attributed to pyroxenite melting (Fig. 12b). Finally, olivine-hosted melt inclusions in QBB mafic lavas manifest higher values of Zn/Fe*10000 than predicted for peridotite-derived melts, supporting a pyroxenite composition for the mantle source of the studied area (Salehi et al. Reference Salehi, Torkian and Furman2020).
(a–c) Bulk analyses of QBB mafic rocks display geochemical signatures consistent with melts of a pyroxenite mantle source. (d) Cr (ppm) (a proxy for melting degree) vs normative olivine content of mafic lavas (a proxy for melting pressure) diagram indicates lithospheric drip melting (e.g. Holbig & Grove Reference Holbig and Grove2008; Furman et al. Reference Furman, Nelson and Elkins-Tanton2016). Mafic lava sequences formed through adiabatic upwelling of asthenosphere define a negative correlation. (e) La/Yb vs Sm/Yb melt curves obtained using the non-modal batch melting equation of Shaw (Reference Shaw1970) and mantle sources of both garnet-bearing pyroxenite (Cpx60 + Grt40) and spinel-bearing peridotite (Ol80 + Cpx16 + Grt4) (Kelemen et al. Reference Kelemen, Rilling, Parmentier, Mehl and Hacker2003; Pertermann et al. Reference Pertermann, Hirschmann, Hametner, Günther and Schmidt2004). For both models, the values of C 0 come from the primitive-mantle data reported in Sun and McDonough (Reference Sun and McDonough1989). The QBB rocks plot close to the garnet-bearing pyroxenite-melting curve with ∼1 % of partial melting. Tick marks and numbers along the curves show the degree of partial melting for a given mantle source.

The QBB rocks show LREE enrichments counterbalanced by heavy REE (HREE) depletions; this strong fractionation effect (Fig. 8) suggests that garnet belongs to the phase assemblage of the mantle source (e.g. Coban, Reference Coban2007). Y/Yb values >10 provide an additional clue that garnet is a residual phase in the source region (Ge et al. Reference Ge, Li, Chen and Li2002). We note further that Nb concentrations (>20 ppm) and Nb/Ta values in the studied rocks are high (18–21), consistent with melting in the presence of rutile (Klemme et al. Reference Klemme, Prowatke, Hametner and Günther2005; Liu et al. Reference Liu, Gao, Kelemen and Xu2008).
We explore this question explicitly using Sm/Yb-La/Yb values to distinguish between melts formed in the garnet and spinel stability fields (Fig. 12e). Calculations are consistent with generation of the QBB volcanic rocks by a small degree (about 1 %) of partial melting from a garnet + rutile bearing pyroxenite source (Fig. 12e).
6.c. Geotectonic evolution
Several geological and geophysical studies attribute Iranian and East Anatolian magmatism to the break-off of the southern Neo-Tethyan oceanic slab beneath the Bitlis–Zagros suture and/or delamination of part of the lower lithosphere (e.g. Keskin, Reference Keskin2003; Şengör et al. Reference Şengör, Ozeren, Genc and Zor2003; Molinaro et al. Reference Molinaro, Zeyen and Laurencin2005; Omrani et al. Reference Omrani, Agard, Whitechurch, Benoit, Prouteau and Jolivet2008; Hatzfeld & Molnar Reference Hatzfeld and Molnar2010; Agard et al. Reference Agard, Omrani, Jolivet, Whitechurch, Vrielynck, Spakman, Monié, Meyer and Wortel2011; Chaharlang et al. Reference Chaharlang, Ducea and Ghalamghash2020, Kettanah et al. Reference Kettanah, Abdulrahman, Ismail, MacDonald and Al Humadi2021). Priestley and McKenzie (Reference Priestley and McKenzie2006) suggest that lithosphere thickness in the study area is 150–200 km. Based on this inferred lithosphere thickness, Allen et al. (Reference Allen, Kheirkhah, Neill, Emami and McLeod2013) rejected the process of delamination and suggested that the melting of amphibole- (richterite-)bearing mantle beneath the thickened lithosphere is responsible for the occurrence of melting in this region.
Fichtner et al. (Reference Fichtner, Saygin, Taymaz, Cupillard, Capdeville and Trampert2013) provide a very high-resolution tomographic model (∼10–20 km) at crustal and lithospheric levels which highlights several low-velocity elliptical bodies (∼100–150 km along the shortest axis and 200 km along the longest axis) beneath the study area. These bodies were named ‘compaction pockets’ by Soltanmohammadi et al. (Reference Soltanmohammadi, Grégoire, Rabinowicz, Gerbault, Ceuleneer, Rahgoshay, Bystricky and Benoit2018), who suggested that they could be rising from the mantle transition zone. However, the model suggested by Salehi et al. (Reference Salehi, Torkian and Furman2020) raises the alternative that these bodies could be drips from the lithospheric mantle. Recent investigations by Motavalli-Anbaran et al. (Reference Motavalli-Anbaran, Zeyen, Brunet and Ardestani2011) found that lithospheric thinning (100–120 km) affects the whole of the northern Zagros Mountains including central Iran, relative to a thickness of 180–200 km under the ZFTB and the Persian Gulf. Similarly, Tunini et al. (Reference Tunini, Jimenez-Munt, Fernandez, Verges and Villasenor2014) identified abrupt thinning to c. 140 km under northwestern Iran including the QBB study area. Numerical studies of lithospheric drip and delamination indicate that even this moderate degree of abrupt lithospheric thinning is appropriate for the onset of drip melting. Geochemical modelling of REE abundances in the QBB rocks (Fig. 12d) suggests that the mantle source is garnet ± rutile bearing pyroxenite. Garnet-pyroxenite in the subcontinental lithospheric mantle will be denser than surrounding peridotite and hence gravitationally unstable, so it could delaminate locally and form a metasomatized drip (Elkins-Tanton, Reference Elkins-Tanton2007). As this drip moves downwards it will undergo increased melting as it descends into the hot surrounding asthenosphere. This scenario is in marked contrast to adiabatic upwelling of the asthenosphere, where the degree of melting increases as the depth of melting shallows. The geochemical signature of the studied rocks supports the drip-melting model. Following Holbig & Grove (Reference Holbig and Grove2008), covariation between the amount of normative olivine and Cr concentration in primitive mafic rocks can distinguish between the trends of adiabatic and drip melting (e.g. Furman et al. Reference Furman, Nelson and Elkins-Tanton2016; Gall et al. Reference Gall, Furman, Hanan, Kürkcüoğlu, Sayit, Yürür, Sjoblom, Şen and Şen2021). The QBB rocks follow the trend for increased melting with depth as predicted for drip melting (Fig. 12e).
Edge convection along an abrupt lithospheric boundary can result in the melting of deep lithosphere that is suddenly exposed to heating; this process would develop analogous geochemical signatures in the melts. Undoubtedly, geochemical evidence is not enough to confirm lithospheric drip. However, the oval low-velocity zones could support the notion of partially molten zones within the lithospheric mantle. Their shape suggests they cannot ascend further as they are being compressed rather than rising from the asthenosphere, and we consider these oval-shaped low-velocity zones in the lithosphere to be pieces of foundered lithosphere, i.e., drips. Basaltic melts derived from these drips are likely to be rich in volatiles. They may ascend quickly to the surface along deep-rooted faults, allowing for only a brief stay in magma chambers where they would experience assimilation and fractional crystallization. Among the QBB samples, the low calculated degree of fractionation and the lack of plagioclase in the fractionating assemblage is consistent with this model rather than with a shallow chamber.
7. Conclusion
The Quaternary Qorveh–Bijar basaltic rocks (QBBs) located along a NW–SE trend parallel to the Zagros suture zone are typically alkali basalts with porphyritic, glomeroporphyritic and aphanitic textures. The main crystalline phases are olivine and clinopyroxene. The volcanic rocks show REE and LILE concentrations higher than those of the gneissic xenoliths they carry (which are assumed to represent the continental crust in the study area), indicating that geochemical variations within the QBB suite cannot be attributed to assimilation and/or mixing between primitive magmas and continental crust or gneissic material. High CaO contents, Fe/Mn and Zn/Fe values in the QBB lavas suggest that this mantle source is garnet-bearing pyroxenite in composition. As pyroxenite is denser than peridotitic lithospheric mantle, it is unstable gravitationally and can start to move downwards under its own weight through the process of mantle drip or localized delamination. This model is supported by geophysical data that confirmed the existence of elliptical-shaped low-velocity structures ∼100–200 km in dimension interpreted as melt batches under the study area. Modelling of REE abundances (La/Yb and Sm/Yb) suggests the QBB lavas formed through low degrees of partial melting (∼1 %) from an enriched mantle source in the garnet stability field. This source began to melt during descent in response to increasing temperatures, and the resulting magma ascended along deep-rooted faults, passing through a thick lithosphere where minor assimilation and fractional crystallization took place within the continental crust.
Supplementary material
To view supplementary material for this article, please visit https://doi.org/10.1017/S0016756823000018
Acknowledgements
This research was financially supported by the Bu-Ali Sina University (Iran) {T and S/1395}. The first author expresses her gratitude to the Ministry of Science and Technology of Iran and the Vice-Chancellor for Research and Technology of the Bu-Ali Sina University.