Introduction
Surgical Site Infections (SSIs) are a leading cause of postoperative deaths and complications,Reference Korol, Johnston and Waser1,Reference Ramon, Guillard, Rosenstiel, Bajolet and Francois2 resulting in prolonged hospital stays, decreased health-related quality of life, unplanned repeat surgical interventions, and additional healthcare costs.Reference Gillespie, Harbeck and Rattray3
Although the global average incidence rate of SSIs is relatively low, ranging from less than 1% to 5%, SSI surveillance is crucial for improving the quality of surgical care.Reference Astagneau and L’Hériteau4–Reference Wu, Khair and Yang6 Providing evidence-based information to caregivers and policymakers is essential for effective prevention strategies. Therefore, feedback from surveillance data plays a key role in reducing the incidence rates of Healthcare-Associated Infections (HAI) and Antimicrobial Resistance (AMR). For decades, many national surveillance networks have demonstrated that participation in surveillance programs can significantly reduce HAI and AMR rates.Reference Astagneau and L’Hériteau4,Reference Haley, Culver, Morgan, White, Emori and Hooton7,Reference Zingg, Holmes and Dettenkofer8 Additionally, the World Health Organization (WHO) has emphasized that an HAI surveillance system is essential for both national and hospital Infection Control (IC) programs, identifying it as one of the eight core components required for effective HAI control.Reference Storr, Twyman and Zingg9
Given that manual surveillance is time-consuming and imposes a significant workload on healthcare professionals, many countries are adopting automated or semi-automated surveillance systems that use data from hospital electronic health records.Reference Perkins, O’Keefe, Ardill and Potenza5,Reference Wu, Khair and Yang6,Reference Petrosyan, Thavorn and Smith10,Reference Lukasewicz Ferreira, Franco Meneses and Vaz11 A multicenter study by Van Rooden in 2019 demonstrated that transitioning from manual to semi-automated SSI surveillance significantly reduces the workload for healthcare professionals.Reference Van Rooden, Tacconelli and Pujol12
Getting stakeholders’ adhesion to a surveillance program requires a system that is simple, effective, and reactive. The primary challenge, therefore, is to develop a user-friendly system for caregivers that is not overly time-consuming, provides valuable information for decision-makers, and is cost-effective in terms of human and financial resources. This is the goal of the PRAISE European initiative (Providing a Roadmap for Automated Infection Surveillance in Europe), which proposes methods and tools for developing automated surveillance systems that can be used from the bedside to health authorities.Reference Van Mourik, Van Rooden and Abbas13
In France, SSI surveillance is managed at the national level by the Center for Prevention of Healthcare-Associated Infections through the Surveillance and Prevention Program for Infectious Risk in Surgery and Interventional Medicine (SPICMI). This program uses semi-automated surveillance methods that combine automated processes with manual checks, relying on a specific algorithm based on two main criteria: surgical revisions coded in the hospital discharge data (HDD) and microbiological sample results.Reference Astagneau, Nkoumazok and Verjat-Trannoy14
To date, there has been limited evaluation of these national automated systems in terms of their performance in detecting SSIs, particularly regarding their specificity (Sp) and negative predictive value (NPV).Reference Wu, Khair and Yang6 A valid detection algorithm is crucial for accurately distinguishing between patients who have developed SSIs and those who have not. In this study, we aimed to evaluate the performance of the SPICMI algorithm in detecting SSIs across various surgical specialties surveyed within the program.
Methods
The study population included all patients undergoing surgical procedures monitored in the SPICMI program (excluding urology), encoded according to the Common Classification of Medical Procedures (CCAM) of the hospital information system. These included colectomy and appendectomy for digestive surgery; breast surgery and cesarean section for obstetrics and gynecology; laminectomy and lumbar disc herniation surgery for neurosurgery; coronary artery bypass grafting and valve replacement for cardiac surgery; and hip and knee replacements, as well as revision surgeries, for orthopedics.
The surgery procedures were performed on patients aged 18 years or older between January 1 and June 30 each year from 2020 to 2022 (In the SPICMI program, surveillance is carried out over a 6-month period to account for the 30-/90-day surveillance windows and the data production timelines in the EHR system). Only patients with complete data on comorbidities—obesity, diabetes, malnutrition, hypertension, cancer, and immunodeficiency, as defined by ICD-10—were included. SSIs were defined according to CDC criteria.15
The SPICMI program used a semi-automated algorithm to detect suspected SSIs based on two primary criteria: (1) unplanned or urgent surgical revision and (2) one or more positive microbiological cultures (superficial or deep) from the surgical site. The detailed protocol for SSI detection is described in a previous publication.Reference Picard, Nkoumazok, Arnaud, Verjat-trannoy and Astagneau16
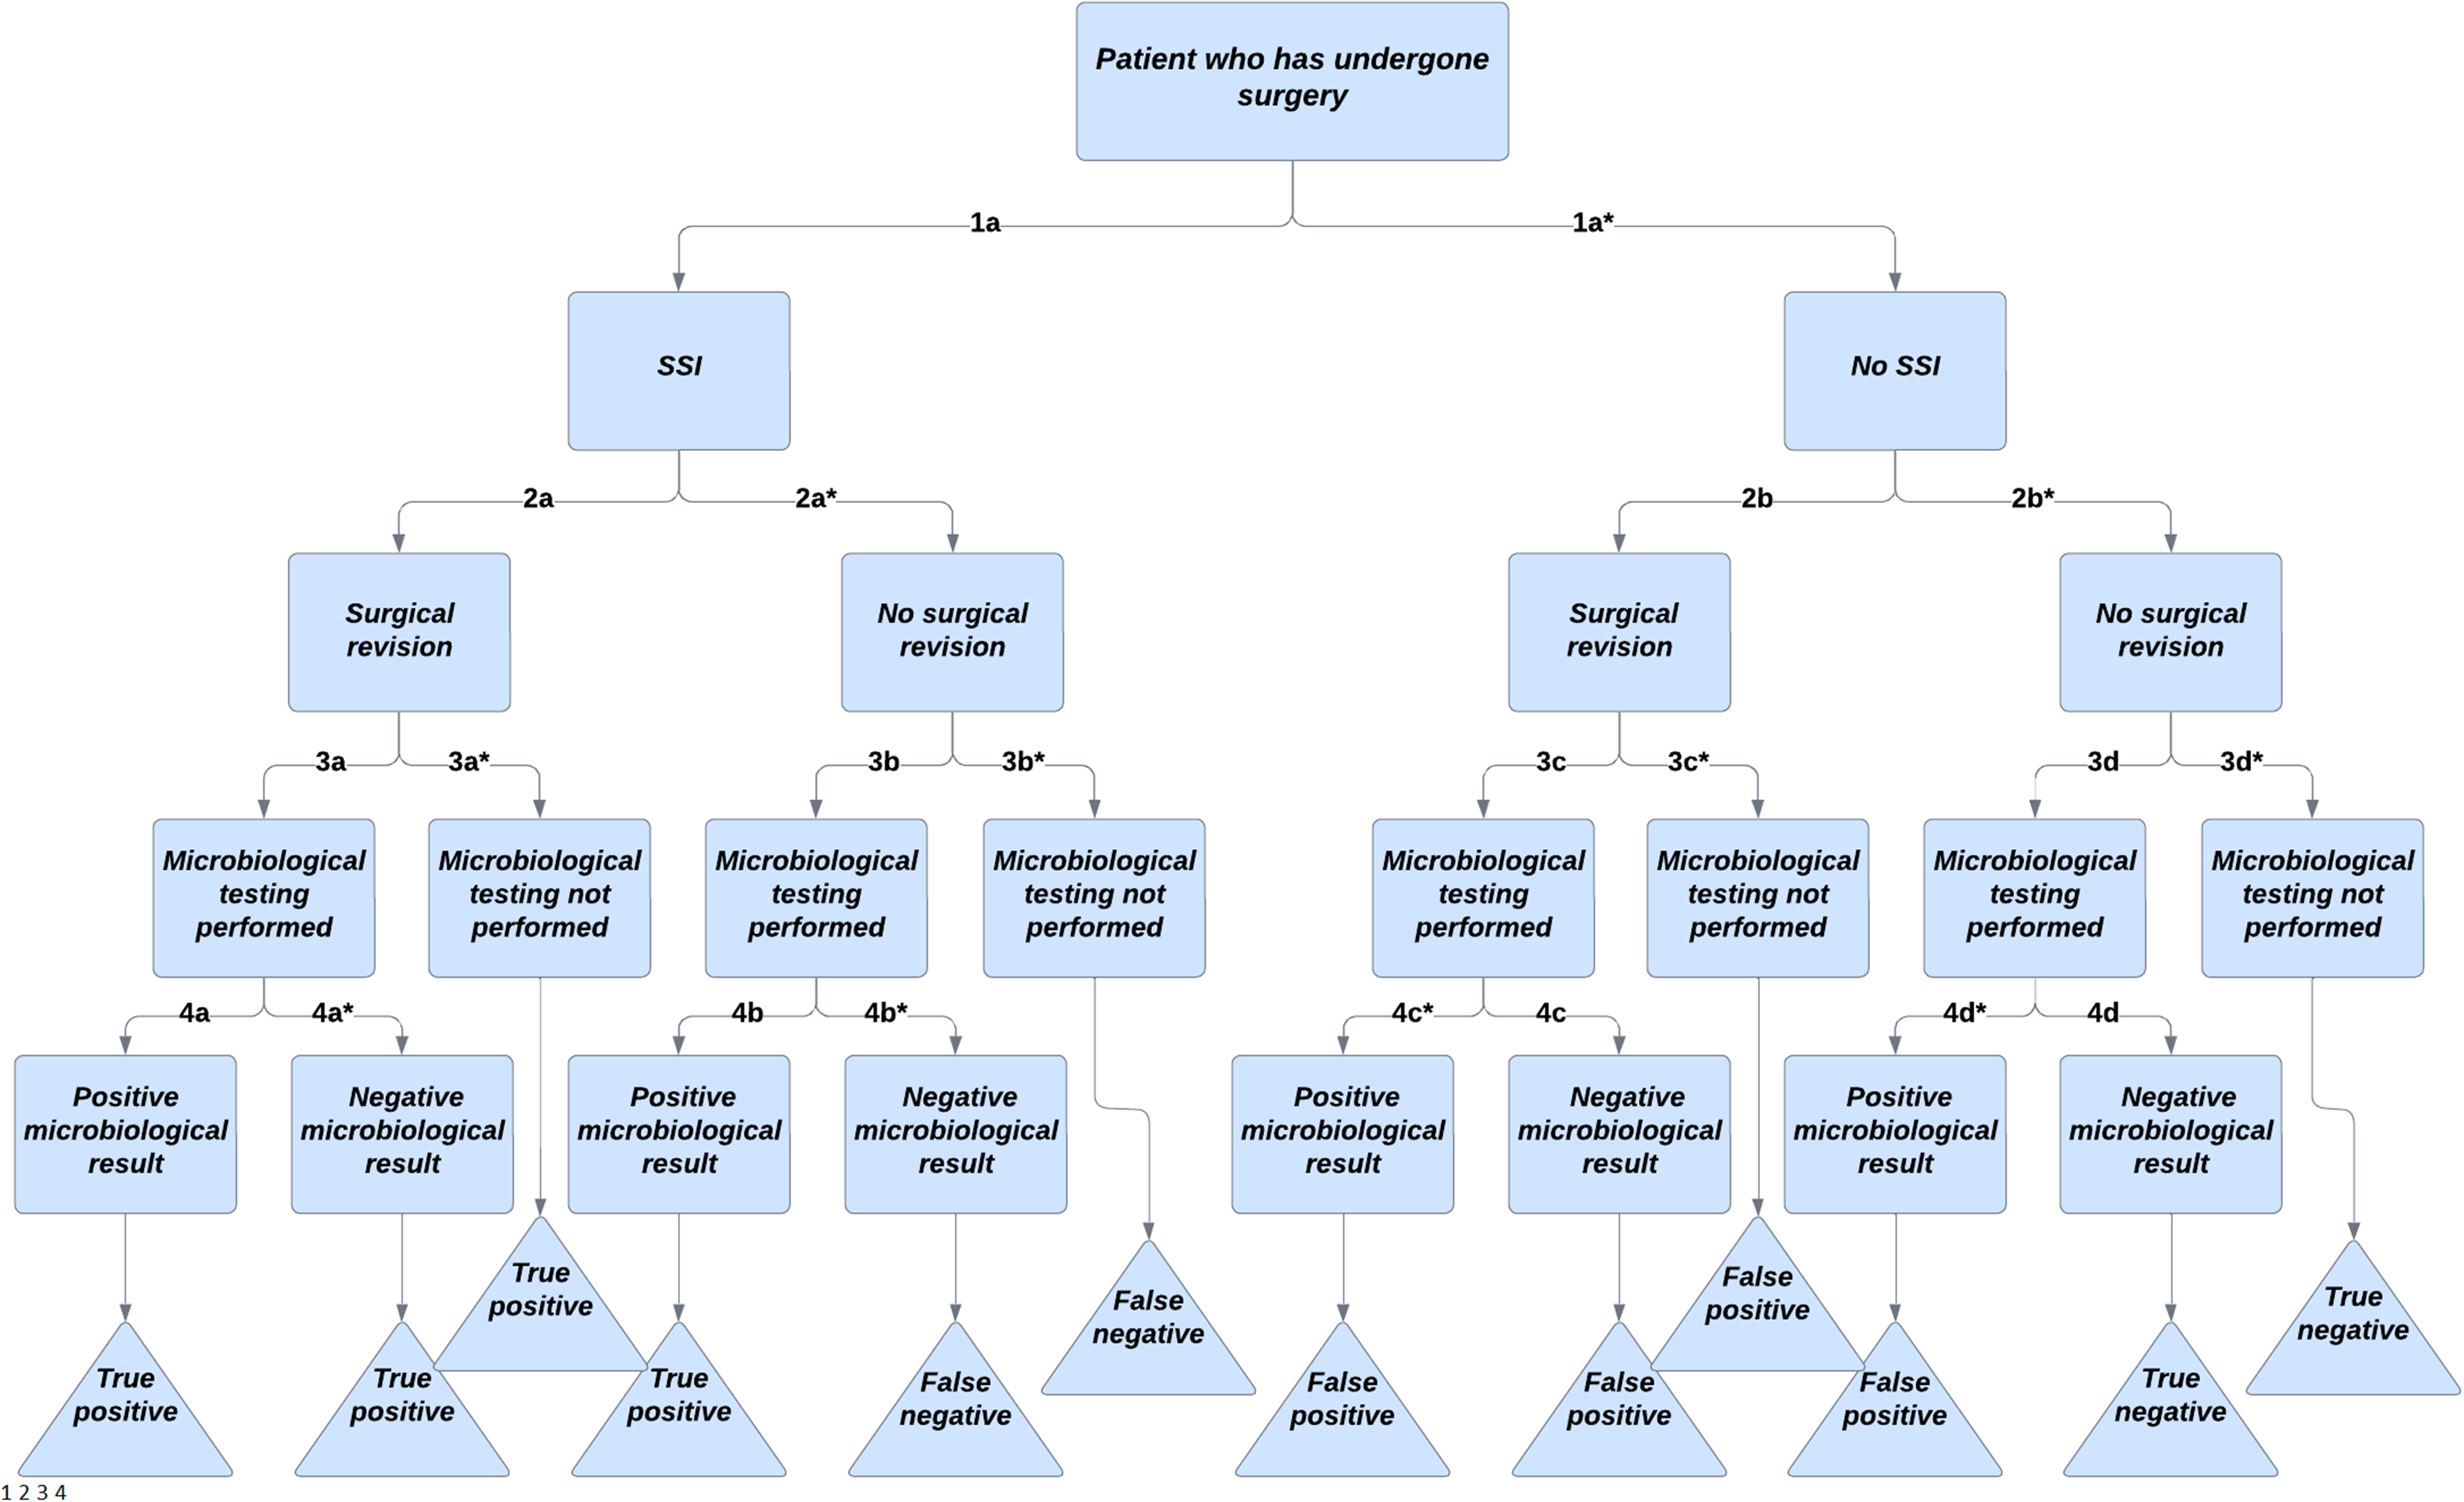
To evaluate the algorithm’s performance, we employed stochastic modeling using scenario trees (Figure 1).
Scenario tree outlining potential pathways and outcomes for a patient following surgery. 1The incidence of SSI was obtained from the scientific literature.24 2 The probability of surgical revision in cases of SSI was estimated using a multivariate regression model. 3 Probabilities for these scenarios were derived from expert opinions and are presented in Table 2. 4 The sensitivity and specificity of microbiological tests were also obtained from the scientific literature. No studies have directly assessed microbiological test performance specifically for SSIs. Instead, we referred to systematic reviews, meta-analyses, and randomized controlled trials reporting diagnostic performance of microbiological tests in general.Reference Luteijn, Hubben, Pechlivanoglou, Bonten and Postma18–Reference Avni, Leibovici and Paul22

The probabilities at each node of the scenario tree (Figure 1), representing the likelihood of different scenarios, were estimated using the following methods:
-
Multivariate regression model: The probability of surgical revision in cases of SSIs (marked with the label “2a” in Figure 1) was estimated using a multivariate regression model based on SPICMI surveillance data. This model applied a backward elimination method, guided by the Akaike Information Criterion (AIC), to identify the most parsimonious set of predictors. Key variables such as patient age, operating service, and comorbid conditions (e.g., active malignancy, malnutrition) were included to account for potential confounding factors, improving the model’s accuracy and predictive reliability.
-
Expert opinions and literature review to address missing data: For nodes where probabilities could not be derived from the SPICMI database, estimates were based on expert opinions and scientific literature. Expert surgeons, selected on a voluntary basis from hospitals participating in the SPICMI surveillance program, provided insights via a validated questionnaire validated by two surgeons who had assessed the clinical relevance, the clinical suitability and the clarity of each question and refined these questions during two working sessions. Each question corresponded to a node with no surveillance data available to estimate a probability. This questionnaire was refined by two senior surgeons to ensure clarity. Expert opinions were used to estimate probabilities (expressed as a percentage between 0% and 100%) based on their daily experience for scenarios marked with the labels 2b, 3a, 3b, 3c, and 3d in Figure 1. Variability in expert responses was addressed using probability distributions based on stochastic processes (e.g., PERT and uniform distributions).Reference García, Pérez and Rambaud 17
-
Scientific literature: Incidence rates of SSIs (marked with the label « 1 » in Figure 1) and the sensitivity and specificity of microbiological tests (marked with the labels 4a, 4b, 4c and 4d in Figure 1) were obtained from previously published studiesReference Luteijn, Hubben, Pechlivanoglou, Bonten and Postma18–Reference Avni, Leibovici and Paul22 through a narrative review of the literature.
To evaluate the performance of the SPICMI algorithm in detecting SSIs, key performance indicators—including sensitivity (Se), specificity (Sp), positive predictive value (PPV), NPV, and Youden’s index [(Se + Sp) – 1]—were calculated using Bayes’ theorem. Monte Carlo simulations (10,000 iterations) were conducted to generate statistical distributions for these indicators, using mc2d package (R software version 4.3.2). For each Monte Carlo iteration, probabilities were randomly sampled and combined along the branches of the tree using standard conditional probability rules, yielding the probability of each complete scenario. Scenarios were then classified as true positive, false positive, true negative, or false negative, according to the presence of an SSI and its detection by SPICMI criteria. Overall performance metrics (sensitivity, specificity, PPV, NPV) were derived from these classifications across 10,000 Monte Carlo iterations to ensure convergence and robustness of the estimates.
Each node of the tree was defined as a binary outcome with complementary probabilities (e.g., P(3a) and P(3a*) = 1 – P(3a)). This ensured that all clinical pathways were represented, including undetected SSIs, which were counted as false negatives and affected the estimated sensitivity of the algorithm. The whole analysis was conducted using R software (version 4.3.2, R Foundation for Statistical Computing). Adjusted predictions, representing the predicted probabilities of surgical revision, were obtained using the ggpredict function from the ggeffects package.Reference Lüdecke23
Results
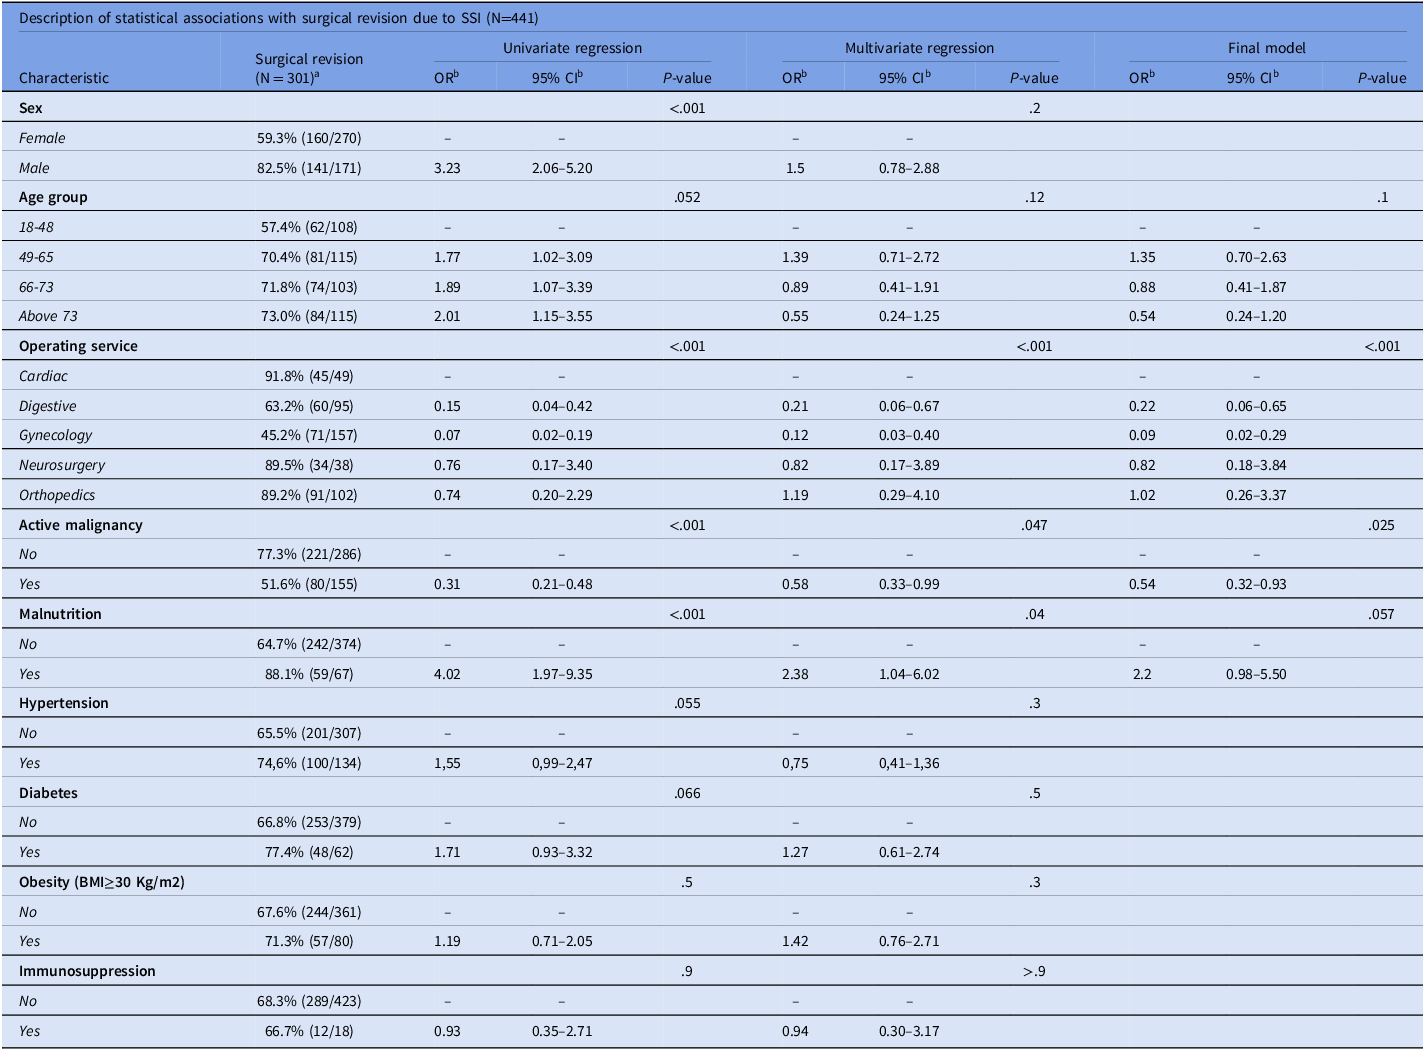
Among the 19,297 patients with complete comorbidity data, 441 (2.3%) developed an SSI. In univariate analysis (Table 1), male gender and malnutrition were significantly associated with a higher incidence of surgical revision, while active malignancy, digestive surgery, and gynecological surgery were associated with lower surgical revision rates. Multivariate analysis confirmed that digestive surgery (OR = 0.22, 95% CI: 0.06–0.65) and gynecological surgery (OR = 0.09, 95% CI: 0.02–0.29) had significantly lower surgical revision rates compared to cardiac surgery, as well as active malignancy (OR = 0.54, 95% CI: 0.32–0.93) compared to patients without malignancy, all else being equal. According to the ggpredict function in R, orthopedic surgery had a higher likelihood of requiring surgical revision following an SSI (0.92, 95% CI: 0.82–0.97) compared to digestive surgery (0.71, 95% CI: 0.56–0.82).
Univariate and multivariate analyses of risk factors associated with surgical revision due to SSI in 441 patients

a % (n/N).
b OR = Odds ratio, CI = Confidence interval.
Note. The final multivariable regression model was obtained using the backward elimination method based on AIC minimization.
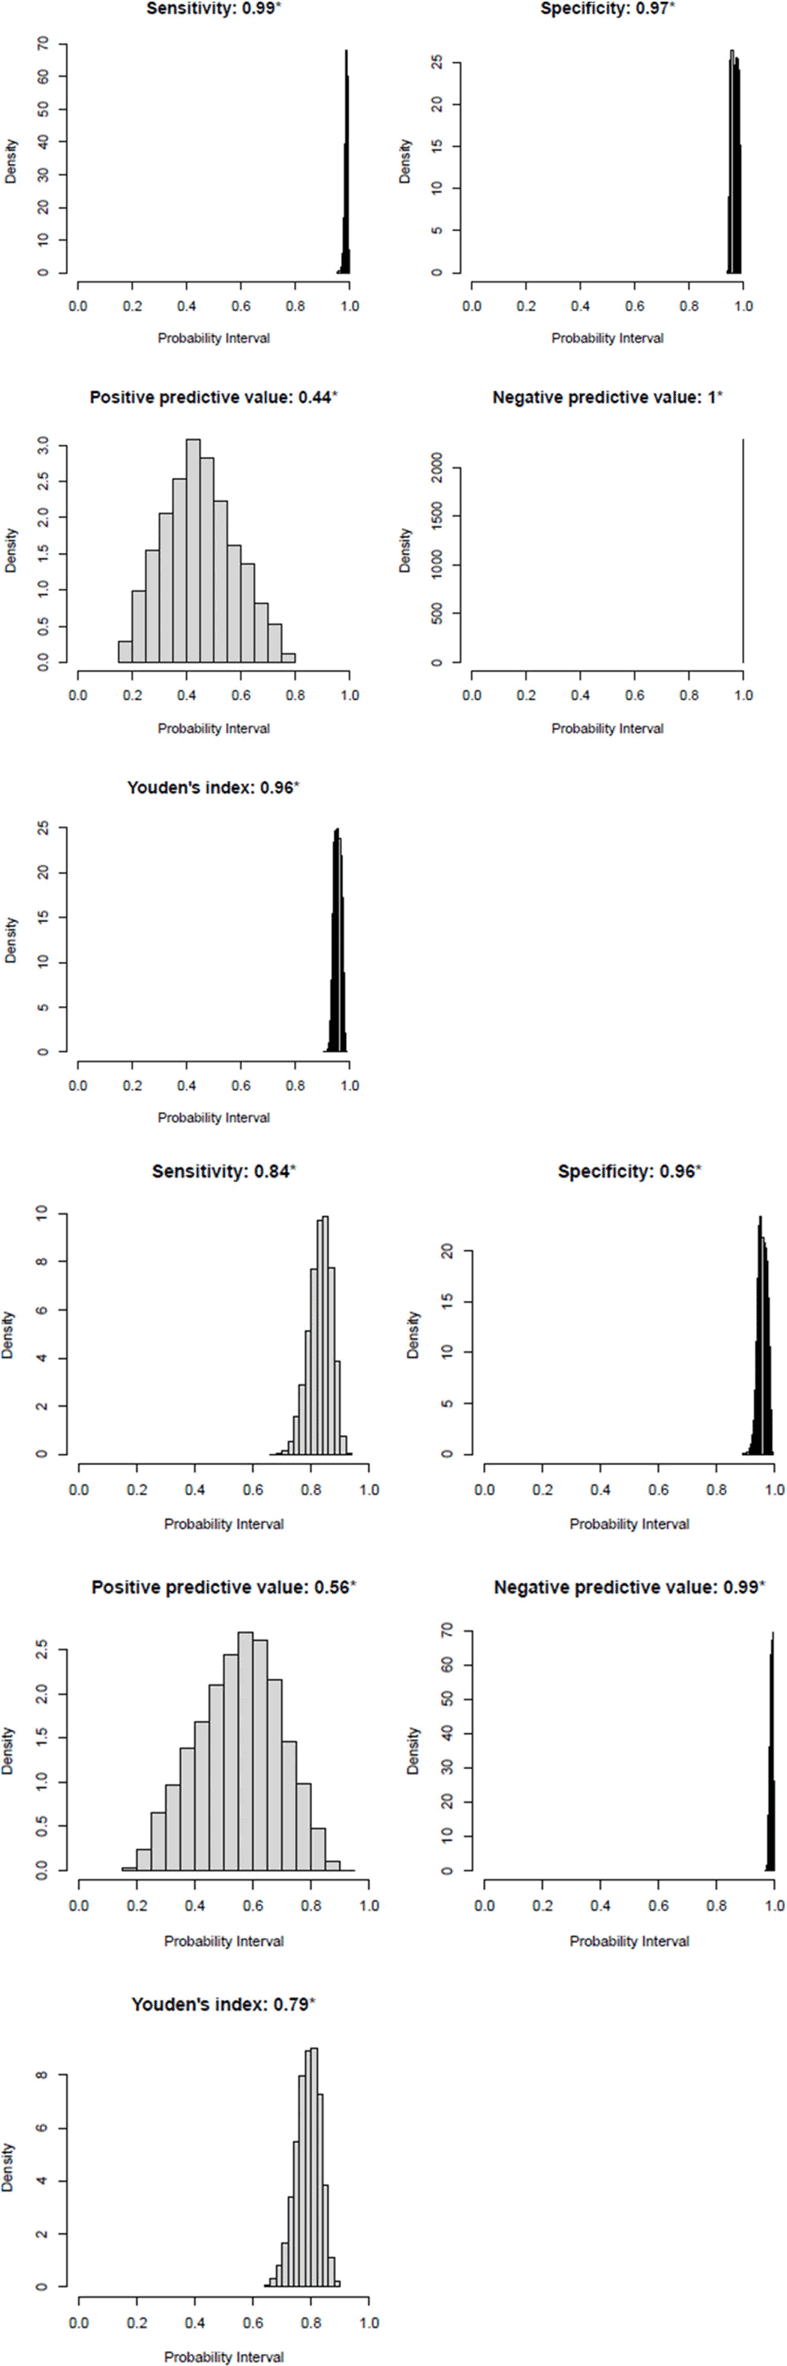
Orthopedic surgery demonstrated high diagnostic accuracy (Figure 2), with sensitivity ranging from 0.96 to 0.99 (median = 0.99), indicating a strong ability to detect true SSIs. Specificity was similarly high, ranging from 0.94 to 0.99 (median = 0.97), reflecting accurate identification of non-SSI cases. The PPV ranged from 0.16 to 0.79, with a median of 0.44, meaning that 44% of positive diagnoses were true SSIs. The NPV was very high, ranging from 0.99 to 1.00 (median = 1.00), indicating a near-perfect classification of negative results. However, this is largely driven by the very low incidence of SSI, which inherently inflates the NPV. Overall, Youden’s index ranged from 0.91 to 0.99 (median = 0.96), highlighting good diagnostic performance in orthopedic surgery.
Statistical distribution of the algorithm’s performance indicators generated through Monte Carlo simulations.

In contrast, digestive surgery demonstrated lower performance than orthopedic surgery (Figure 2), with sensitivity ranging from 0.67 to 0.93 (median = 0.84), indicating moderate detection ability. Specificity remained high, between 0.89 and 0.99 (median = 0.96), showing reliable identification of non-infected cases. PPV ranged from 0.17 to 0.91 (median = 0.56), indicating that 56% of positive results represented true SSIs. The NPV was also high, ranging from 0.97 to 1.00 (median = 0.99), suggesting that most negative results were accurate. As previously, this high NPV is largely explained by the very low incidence of SSI, which inherently boosts the NPV. However, Youden’s index was lower than in orthopedic surgery, ranging from 0.64 to 0.90 (median = 0.79), indicating reduced overall effectiveness.
Expert opinions
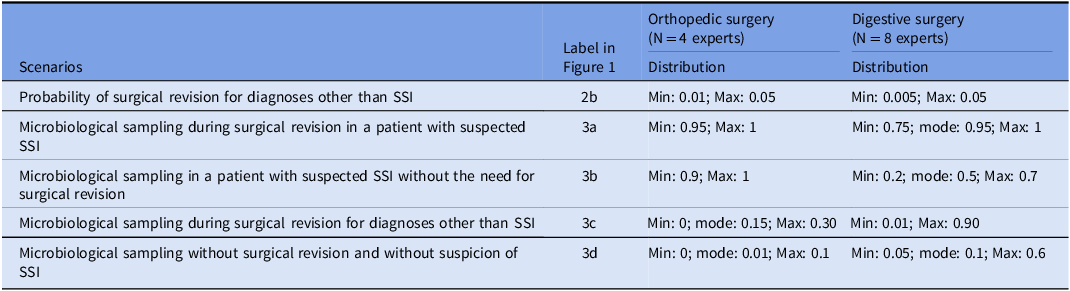
A total of 12 experts from various hospitals participating in SPICMI surveillance (four from orthopedic surgery and eight from digestive surgery) completed the questionnaire. Their responses revealed significant differences in clinical practices between the two specialties (Table 2).
Summary of expert responses

In cases of suspected SSI, patients were classified into two groups based on the scenario tree: those who underwent surgical revision and those who did not. Within each subgroup, microbiological testing was either performed or omitted.
Regarding microbiological sampling during surgical revision for suspected SSI (marked with the label “3a” in Figure 1), orthopedic surgery generally followed a systematic approach with minimal variability in decision-making. Expert opinions indicated strong uniformity in orthopedic surgery, with the probability of performing microbiological sampling ranging from 0.95 to 1. In contrast, microbiological sampling in digestive surgery was more variable, with probabilities ranging from 0.75 to 1 (mode: 0.95).
When surgical revision was deemed unnecessary but SSIs were still suspected, orthopedic surgery maintained a uniform and systematic approach to microbiological sampling (label “3b” in Figure 1), with probabilities ranging from 0.9 to 1. Conversely, digestive surgery exhibited greater variability, with sampling probabilities ranging from 0.2 to 0.7 (mode: 0.5).
In cases where an SSI was not suspected, the scenario tree again divided patients into two groups: those who underwent surgical revision and those who did not. Experts from both specialties reported a very low probability of surgical revision in non-SSI cases, consistently below 5% (label “2b” in Figure 1). Within these groups, microbiological testing was either performed or omitted.
In non-SSI cases requiring surgical revision, expert responses indicated significant variability in the probability of performing microbiological sampling, with probabilities ranging from 0.01 to 0.3 in orthopedic surgery and 0.01 to 0.9 in digestive surgery (label “3c” in Figure 1).
For non-SSI cases where surgical revision was not required, the probability of performing microbiological sampling (label “3d” in Figure 1) was lower in orthopedic surgery (0 to 0.1) than in digestive surgery, where it ranged from 0.05 to 0.6, with a mode of 0.1
Discussion
Using stochastic modeling based on scenario trees, we demonstrated that the algorithm used in the SPICMI program had acceptable performance in both orthopedic and digestive surgeries, particularly in accurately detecting SSIs. However, the algorithm performance varied according to those two main specialties, being globally better in orthopedic than in digestive surgery, as demonstrated by the Youden index.
Sensitivity was significantly higher in orthopedic surgery (0.96 to 0.99) compared to digestive surgery (0.67 to 0.93). In orthopedics, the primary detection criterion—surgical revision—was met in over 90% of SSI cases, likely explaining the higher sensitivity. In digestive surgery, surgical revisions followed SSIs in only 71% of cases, contributing to the lower sensitivity in this specialty. These findings are consistent with those of Van Rooden et al., who reported similar differences across surgical specialties in France, the Netherlands, and Spain.Reference Van Rooden, Tacconelli and Pujol12 Similarly, Petrosyan et al. found that a random forest algorithm for SSI detection achieved a sensitivity of 82.1% and specificity of 85.6%.Reference Petrosyan, Thavorn and Smith10 Based on these results, adding a detection criterion specific to digestive surgery, such as early postoperative antibiotic prescription,Reference Perkins, O’Keefe, Ardill and Potenza5 could improve sensitivity in this area. While this may increase false positives, manual validation within the semi-automated system would ensure accurate reclassification.
The SPICMI algorithm maintained consistently high specificity (90% to 100%) in both orthopedic and digestive surgeries, accurately identifying non-SSI cases. These findings align with a recent systematic review on machine learning algorithms for SSI detection, which reported pooled sensitivity estimates of 0.83 (95% CI: 0.78–0.87) and specificity of 0.92 (95% CI: 0.86–0.95).Reference Wu, Khair and Yang6
In both orthopedic and digestive surgeries, the PPV was relatively low, averaging around 0.5. This means that only half of the positive diagnoses corresponded to true SSIs. This finding is consistent with previous studies on algorithmic systems for SSI detection, which also reported low PPV in these specialties.Reference Petrosyan, Thavorn and Smith10,Reference Van Rooden, Tacconelli and Pujol12 It could be explained by the relatively low incidence of SSIs, generally below 5%. Given this low incidence, the algorithm achieved a very high NPV, close to 1 in both specialties. This indicates that when no alert is generated, the likelihood of an SSI truly being absent is nearly certain. These results suggest that automation of surveillance may allow excluding most patients without an SSI, helping clinical and IC teams to gain time in selecting only patients with suspected SSI who need to be confirmed by the surgeon.
By relying on two straightforward criteria—surgical revision and microbiological sampling—the algorithm achieved a very high NPV, allowing accurate classification of most non-SSI patients, although this finding should be interpreted in the context of the low incidence of SSI. However, the PPV was lower in both specialties, resulting in a higher number of false positives. This underscores the importance of clinical judgment in semi-automated surveillance systems like SPICMI. Although the algorithm flagged more cases than the actual SSI incidence, the clinician workload remained manageable since only a few cases required verification. This reduced the need for manual review by the surgical team or Infection Prevention and Control (IPC) staff, optimizing resource use. Surgeons played a key role in confirming false positives.
The strengths of this study include its large national sample and the integration of quantitative analysis with qualitative probabilistic approaches. However, caution is warranted when interpreting the results due to certain limitations. The study relied on expert opinion, which introduces a degree of subjectivity, and the relatively small sample of 12 experts from orthopedic and digestive surgery limits the generalizability of findings. Moreover, as most of the participating experts were from public hospitals, this could contribute to limiting the representativeness of the panel with respect to the national participation in SPICMI. Significant variability in expert responses was observed, particularly in digestive surgery, when estimating the likelihood of different scenarios. This variability was most pronounced in cases involving microbiological sampling during surgical revisions for non-SSI diagnoses or sampling without surgical revision or suspicion of SSI. Experts attributed this variability to the absence of standardized guidelines, as well as differences in clinical presentations, procedure types, and surgeon practices, highlighting potential heterogeneity in the algorithm’s performance across various clinical settings.
Additionally, the study was initially designed to evaluate all surgical specialties included in the SPICMI program, but specialties such as gynecology, neurosurgery, and cardiac surgery could not be assessed due to the lack of responses from surgeons in these specialties.
Plus, other SSIs meeting NHSN criteria or treated in the outpatient setting may be missed by the algorithm, and would therefore require manual review. Further validation of the SPICMI algorithm across these specialties is critical. As surgical revision is one of its main triggers, SSIs may have been under-detected in specialties with lower revision rates. Incorporating additional criteria—such as postoperative antibiotic prescriptions or rehospitalizations within 30 days post-surgery—may improve sensitivity and ensure consistent performance across all surgical specialties.
Acknowledgments
The authors extend their sincere gratitude to the members of the SPICMI Working Group for their invaluable contributions and expertise throughout this project. Special thanks are owed to Pierre Berger, Christel Bochaton, Gouly Cisse, Adeline Debreuve-Theresette, Arnaud Florentin, Béatrice Gegoux, Leslie Grammatico-Guyon, Véronique Merle, Jérémy Picard, Amine Si Ali, and Ghaya Ben Hmidene for their active involvement.
Financial support
The SPICMI program is supported by Santé Publique France (SPF).