1. Introduction
The presence of chaotic eddies over a wide range of length and time scales is a fundamental feature of turbulent fluid flow, and has been well documented over the years. In particular, in wall-bounded flows, the integral length scale depends on the wall-normal height: the smallest energy-containing eddies reside in the near-wall region and scale in inner units with the viscous length scale  $\delta _\nu =\nu /u_\tau$ (
 $\nu$ is the kinematic velocity of the fluid and
 $u_\tau$ is the friction velocity), whereas the largest energy-containing eddies span the entire wall-normal domain and scale in outer units with outer length scale
 $h$ (e.g. the half-height of a channel). The multi-scale flow topology of wall-bounded turbulence is perhaps best described by the attached-eddy hypothesis of Townsend (Reference Townsend1956, Reference Townsend1980), in which it was proposed that the energy-containing eddies of the logarithmic layer form a self-similar hierarchy and that the characteristic length scale is proportional to the distance between the eddy centre and the wall
 $y$. Townsend's idea can be extended to include the near-wall and outer regions in a more broad sense, and there is a growing body of numerical and experimental evidence supporting his original hypothesis and subsequent theory, including the linear growth of the characteristic spanwise length scale with distance from the wall (Tomkins & Adrian Reference Tomkins and Adrian2003), the existence of self-similar energy-containing velocity structures (del Álamo et al. Reference del Álamo, Jimenez, Zandonade and Moser2006; Hwang & Cossu Reference Hwang and Cossu2010c, Reference Hwang and Cossu2011; Lozano-Durán & Jiménez Reference Lozano-Durán and Jiménez2014; Hwang Reference Hwang2015) and the logarithmic wall-normal dependence of the streamwise and spanwise turbulence intensities (Jimenez & Hoyas Reference Jimenez and Hoyas2008; Marusic et al. Reference Marusic, Monty, Hultmark and Smits2013). Furthermore, it has been demonstrated recently that the self-similar energy balance originates from the logarithmic mean velocity profile and that these two fundamental features of wall-bounded turbulence are mutually equivalent (Hwang & Lee Reference Hwang and Lee2020), providing a theoretical basis of the attached eddy hypothesis of Townsend (Reference Townsend1956, Reference Townsend1980).
Owing to the property of the Navier–Stokes equations, the eddies of various forms and scales interact with each other nonlinearly and non-locally. Understanding the corresponding scale interaction processes has been one of the long-standing challenges in the analysis of turbulent flows. The best-known scale interaction process is undoubtedly the Richardson–Kolmogorov energy cascade (Kolmogorov Reference Kolmogorov1941), in which the production of turbulent kinetic energy (TKE) at the (large) integral length scale results in energy transfer down to the Kolmogorov length scale (i.e. the smallest possible length scale), at which TKE is dissipated into heat due to viscous effects. In wall-bounded shear flows, scale interactions are particularly vigorous near the wall, because all scales in the self-similar hierarchy are present through their inactive motions (Townsend Reference Townsend1980), and numerous studies have focussed on the interaction of near-wall ‘inner’ structures and near-wall-penetrating ‘log-layer/outer’ structures (e.g. Hutchins & Marusic Reference Hutchins and Marusic2007; Mathis, Hutchins & Marusic Reference Mathis, Hutchins and Marusic2009; Talluru et al. Reference Talluru, Baidya, Hutchins and Marusic2014; Duvvuri & McKeon Reference Duvvuri and McKeon2015; Agostini & Leschziner Reference Agostini and Leschziner2016; Zhang & Chernyshenko Reference Zhang and Chernyshenko2016; Baars, Hutchins & Marusic Reference Baars, Hutchins and Marusic2017). More recent analyses of the statistical structure of such interactions have revealed that the scale interaction processes in wall-bounded turbulence are dauntingly complex (Cimarelli et al. Reference Cimarelli, De Angelis, Jimenez and Casciola2016; Cho, Hwang & Choi Reference Cho, Hwang and Choi2018; Kawata & Alfredsson Reference Kawata and Alfredsson2018; Lee & Moser Reference Lee and Moser2019; Doohan, Willis & Hwang Reference Doohan, Willis and Hwang2021), especially when all integral length scales are taken into account. In particular, a wealth of new scale interaction processes have been identified, such as the involvement of larger energy-containing eddies in the energy cascade of smaller energy-containing eddies and energy transfer from small to large scales in the near-wall region (Cho et al. Reference Cho, Hwang and Choi2018; Doohan et al. Reference Doohan, Willis and Hwang2021).
The continuum of integral and dissipation length scales has hindered the study of the temporal dynamics of multi-scale turbulent flows, although certain progress has been made. In particular, it has been demonstrated that there exists a self-sustaining mechanism for the energy-containing eddies at each integral length scale and that this process can operate independently of the motion at other scales (Hamilton, Kim & Waleffe Reference Hamilton, Kim and Waleffe1995; Jiménez & Pinelli Reference Jiménez and Pinelli1999; Flores & Jiménez Reference Flores and Jiménez2010; Hwang & Cossu Reference Hwang and Cossu2010c, Reference Hwang and Cossu2011; Hwang Reference Hwang2015; Hwang & Bengana Reference Hwang and Bengana2016). The mechanism in question has been termed the ‘self-sustaining process’ (SSP) (Hamilton et al. Reference Hamilton, Kim and Waleffe1995; Waleffe Reference Waleffe1997) and it is based on the quasi-cyclic interaction of streaks and quasi-streamwise vortices, namely the amplification of streaks by streamwise vortices through the lift-up effect (Butler & Farrell Reference Butler and Farrell1993; del Álamo & Jimenez Reference del Álamo and Jimenez2006; Cossu, Pujals & Depardon Reference Cossu, Pujals and Depardon2009; Pujals et al. Reference Pujals, García-Villalba, Cossu and Depardon2009; Hwang & Cossu Reference Hwang and Cossu2010a,Reference Hwang and Cossub; Willis, Hwang & Cossu Reference Willis, Hwang and Cossu2010), the breakdown of streaks due to normal-mode instability and/or transient growth (Hamilton et al. Reference Hamilton, Kim and Waleffe1995; Schoppa & Hussain Reference Schoppa and Hussain2002; Park, Hwang & Cossu Reference Park, Hwang and Cossu2011; Cassinelli, de Giovanetti & Hwang Reference Cassinelli, de Giovanetti and Hwang2017; de Giovanetti, Sung & Hwang Reference de Giovanetti, Sung and Hwang2017; Lozano-Durán et al. Reference Lozano-Durán, Nikolaidis, Constantinou and Karp2021) and the nonlinear regeneration of the streamwise vortices (Hamilton et al. Reference Hamilton, Kim and Waleffe1995; Schoppa & Hussain Reference Schoppa and Hussain2002; Hwang & Bengana Reference Hwang and Bengana2016; Bae, Lozano-Duran & McKeon Reference Bae, Lozano-Duran and McKeon2021). Similar mechanisms have been proposed earlier (Benny Reference Benny1984; Hall & Smith Reference Hall and Smith1991). In particular, Hall & Smith (Reference Hall and Smith1991) formulated a self-consistent theory referred to as ‘vortex–wave’ interaction, where, in the context of the SSP, the ‘vortex’ is a structure composed of streamwise-uniform (or averaged) streaks and streamwise vortices and the ‘wave’ is the marginally stable inviscid streak-instability mode (or inviscid Rayleigh wave). The dynamics of the dissipative eddies are similarly complex: recent evidence indicates that the production and dissipation of TKE are dynamically correlated, and that the dissipation dynamics are instead far from equilibrium (e.g. Vassilicos Reference Vassilicos2015). In accordance with the notion of non-equilibrium turbulent dissipation, it has been observed that the instantaneous dissipation rate strongly depends on the production dynamics of the system (Goto & Vassilicos Reference Goto and Vassilicos2015). This has recently been corroborated by the analysis of a flow domain just large enough to sustain two adjacent spanwise integral length scales of motion, which we have termed ‘the minimal unit of multi-scale near-wall turbulence’ (here, the term ‘multi-scale’ implies the presence of multiple integral length scales of energy-containing motion of similar order). Even in such a relatively simple flow, the small-scale dissipation terms have been found to inherit the time scales of the large-scale SSP (Doohan et al. Reference Doohan, Willis and Hwang2021). Furthermore, the same study revealed that inter-scale energy transfer is intimately linked to the SSP of the donor scale; namely that the energy cascade from large to small scales is determined by the streak-instability stage of the large-scale SSP and that the energy transfer from small to large scales is determined by the streak-instability stage of the small-scale SSP, and appears to be related to the subharmonic-sinuous streak-instability mode in particular.
A recent breakthrough in the analysis of the turbulent dynamics has been the successful application of the concepts of dynamical systems theory, in which the temporal evolution of a turbulent velocity field is represented as a chaotic trajectory in an infinite-dimensional state space (e.g. Kerswell Reference Kerswell2005; Eckhardt et al. Reference Eckhardt, Schneider, Hof and Westerweel2007; Kawahara, Uhlmann & Van Veen Reference Kawahara, Uhlmann and Van Veen2012; Graham & Floryan Reference Graham and Floryan2020). The dynamical systems description of turbulent flow emerged with the computation of non-trivial invariant solutions of the Navier–Stokes equations, including equilibrium solutions of Couette flow (Nagata Reference Nagata1990; Clever & Busse Reference Clever and Busse1997), relative equilibrium solutions of Poiseuille flow (Waleffe Reference Waleffe1998, Reference Waleffe2001, Reference Waleffe2003) and relative periodic orbits of Couette flow (Kawahara & Kida Reference Kawahara and Kida2001), and multitudes of solutions have been discovered over the years for numerous flow configurations such as pipe flow (Faisst & Eckhardt Reference Faisst and Eckhardt2003; Wedin & Kerswell Reference Wedin and Kerswell2004; Duguet, Willis & Kerswell Reference Duguet, Willis and Kerswell2008; Viswanath Reference Viswanath2009; Willis, Cvitanović & Avila Reference Willis, Cvitanović and Avila2013; Budanur et al. Reference Budanur, Short, Farazmand, Willis and Cvitanović2017), channel flow (Viswanath Reference Viswanath2007; Gibson, Halcrow & Cvitanovic Reference Gibson, Halcrow and Cvitanovic2008; Gibson, Halcrow & Cvitanović Reference Gibson, Halcrow and Cvitanovic2009; Nagata & Deguchi Reference Nagata and Deguchi2013; Deguchi & Hall Reference Deguchi and Hall2014b; Park & Graham Reference Park and Graham2015) and boundary-layer flow (Khapko et al. Reference Khapko, Kreilos, Schlatter, Duguet, Eckhardt and Henningson2013; Kreilos et al. Reference Kreilos, Veble, Schneider and Eckhardt2013; Deguchi & Hall Reference Deguchi and Hall2014a). Typically, invariant solutions capture coherent structures such as streaks and quasi-streamwise vortices and their SSPs. As they are an equilibrium or time-periodic manifestation of these features, invariant solutions are also termed ‘exact coherent structures’. Invariant solutions form a skeleton for the dynamics of the flow in the infinite-dimensional state space. Analysis of their linear stability, i.e. the numerical computation of the eigenvalues and eigenmodes of converged solutions, then enables a finite-dimensional approximation to the local state space dynamics. The dynamical systems framework has been particularly successful in describing laminar–turbulent transition, including the calculation of the laminar–turbulent separatrix (the ‘edge’) and the attractor within it (the ‘edge state’) (Itano & Toh Reference Itano and Toh2001; Skufca, Yorke & Eckhardt Reference Skufca, Yorke and Eckhardt2006; Schneider, Eckhardt & Yorke Reference Schneider, Eckhardt and Yorke2007; Schneider et al. Reference Schneider, Gibson, Lagha, De Lillo and Eckhardt2008), the computation of spatially localised edge states and invariant solutions (Duguet, Schlatter & Henningson Reference Duguet, Schlatter and Henningson2009; Mellibovsky et al. Reference Mellibovsky, Meseguer, Schneider and Eckhardt2009; Schneider, Gibson & Burke Reference Schneider, Gibson and Burke2010a; Schneider, Marinc & Eckhardt Reference Schneider, Marinc and Eckhardt2010b; Brand & Gibson Reference Brand and Gibson2014; Gibson & Brand Reference Gibson and Brand2014), and the connection between invariant solutions and vortex–wave interaction (VWI) states has been identified (e.g. Hall & Smith Reference Hall and Smith1991; Hall & Sherwin Reference Hall and Sherwin2010; Deguchi, Hall & Walton Reference Deguchi, Hall and Walton2013; Deguchi & Hall Reference Deguchi and Hall2014b; Deguchi Reference Deguchi2015). Furthermore, it has been shown that simple invariant solutions well describe the self-sustaining dynamics at a single integral length scale (e.g. Jiménez & Simens Reference Jiménez and Simens2001; Viswanath Reference Viswanath2007; Gibson et al. Reference Gibson, Halcrow and Cvitanovic2009; Willis, Short & Cvitanović Reference Willis, Short and Cvitanović2016; Doohan, Willis & Hwang Reference Doohan, Willis and Hwang2019), using techniques such as computational-domain confinement in the near-wall region and over-damped large-eddy simulation in the logarithmic layer (Yang, Willis & Hwang Reference Yang, Willis and Hwang2019) and in the outer region (Rawat et al. Reference Rawat, Cossu, Hwang and Rincon2015; Hwang, Willis & Cossu Reference Hwang, Willis and Cossu2016). In particular, a number of previously computed invariant solutions have been found to scale in inner units (Deguchi Reference Deguchi2015; Eckhardt & Zammert Reference Eckhardt and Zammert2018; Yang et al. Reference Yang, Willis and Hwang2019; Azimi & Schneider Reference Azimi and Schneider2020). In recent years, efforts have also been made to extend the dynamical systems approach to multi-scale turbulence, including a multi-scale equilibrium solution of Rayleigh–Bénard convection (Motoki, Kawahara & Shimizu Reference Motoki, Kawahara and Shimizu2021) and a periodic orbit that captures the energy cascade in three-dimensional body-forced turbulence (van Veen, Vela-Martín & Kawahara Reference van Veen, Vela-Martín and Kawahara2019).
Despite this recent progress, the extent to which the dynamical systems framework can describe the dynamics of turbulence remains uncertain, especially when the flow exhibits multi-scale behaviour (i.e. at high Reynolds numbers). Indeed, while invariant solutions have been numerically continued to high Reynolds numbers in a number of previous studies (Wang, Gibson & Waleffe Reference Wang, Gibson and Waleffe2007; Viswanath Reference Viswanath2009; Deguchi & Hall Reference Deguchi and Hall2014b), the ability of these solutions to capture the properties of turbulence at that same Reynolds number is not very well understood. Even in the minimal unit of multi-scale near-wall turbulence (Doohan et al. Reference Doohan, Willis and Hwang2021), which is only twice the size of the minimal unit (Jiménez & Moin Reference Jiménez and Moin1991) in each spatial direction, the temporal dynamics are governed by various inter- and intra-scale processes, i.e. the energy cascade at both large and small scales, the driving of small-scale turbulent production by the energy cascade from large scale, the feeding of energy from small to large scales, and the large- and small-scale SSPs.
The objective of this study is to explore the state-space dynamics of a wall-bounded turbulent flow with two spanwise integral length scales. For this purpose, we again consider the minimal unit of multi-scale near-wall turbulence as in Doohan et al. (Reference Doohan, Willis and Hwang2021). The flow configuration studied is the shear stress-driven model of the inner-scaling part of near-wall turbulence (i.e. the mesolayer) in the absence of an outer flow (Doohan et al. Reference Doohan, Willis and Hwang2019), a ‘re-scaled’ model in viscous inner units for the near-wall region in the high friction Reynolds number limit  $Re_\tau \rightarrow \infty$. The wall-normal extent of the mesolayer increases asymptotically as
 $y^{+}\sim \sqrt {Re_\tau }$ (the superscript
 $^{+}$ denotes inner scaling) (e.g. Long & Chen Reference Long and Chen1981; Wei et al. Reference Wei, Fife, Klewicki and McMurtry2005) and so in the high-
 $Re_\tau$ limit, the mesolayer encompasses a hierarchy of length scales and not just the near-wall self-sustaining structures (Jiménez & Pinelli Reference Jiménez and Pinelli1999). But by confining the computational domain in the streamwise and spanwise directions, only motion with spanwise wavelengths
 $\lambda _z^{+}\approx 110, 220$ is sustained due to the periodic boundary conditions of the numerical simulation, and the related dynamics become relevant to the lower part of the mesolayer just above the buffer layer. Here, the minimal unit of multi-scale near-wall turbulence is analysed from a dynamical systems perspective. The edge state and 28 invariant solutions are computed, which are subsequently compared with the turbulent trajectory in a selection of phase portraits relating to the large- and small-scale SSPs and the large- and small-scale energy balance equations.
From a dynamical systems perspective, turbulence is viewed as a ‘chaotic random walk’ around a number of simple invariant solutions, such as travelling waves and periodic orbits, connected by heteroclinic/homoclinic orbits (e.g. Kerswell Reference Kerswell2005; Eckhardt et al. Reference Eckhardt, Schneider, Hof and Westerweel2007; Kawahara et al. Reference Kawahara, Uhlmann and Van Veen2012; Graham & Floryan Reference Graham and Floryan2020). Indeed, this approach has provided a sound description of the state space of turbulence at least in spatially confined simulations at transitional Reynolds numbers, and in many cases the turbulent state has been found to be organised around upper-branch travelling waves and periodic orbits (Gibson et al. Reference Gibson, Halcrow and Cvitanovic2009; Cvitanovic & Gibson Reference Cvitanovic and Gibson2010; Chandler & Kerswell Reference Chandler and Kerswell2013; Willis et al. Reference Willis, Short and Cvitanović2016). As such, a suitable averaging of these invariant solutions provides a meaningful dynamical/statistical description of turbulence (e.g. periodic orbit theory; Cvitanovic et al. Reference Cvitanovic, Artuso, Mainieri, Tanner, Vattay, Whelan and Wirzba2005; Chandler & Kerswell Reference Chandler and Kerswell2013). From this perspective, a large number of solutions at both large and small scales would enable us to examine whether minimal multi-scale (i.e. two-scale) near-wall turbulence can be characterised in terms of the solutions at each individual scale. If turbulence frequently visits the neighbourhood of some of the large- and small-scale solutions in the state space, a suitable average of invariant solutions would provide a meaningful quantitative description of the turbulent statistics. However, as shown in § 3.3, the turbulent state, visualised through many different phase portraits, does not approach anywhere near the travelling waves obtained even in the simplest multi-scale (i.e. two-scale) system. From this observation, it is therefore conjectured that multi-scale turbulence, even with two similar length scales, may not simply be interpreted in the state space as a trajectory visiting the invariant solutions at each scale. Instead, the trajectories would need to wander between inherently multi-scale solutions, as no evidence has been found to suggest the trajectories visit the invariant solutions at each scale. In this study, an analysis of the computed invariant solutions is performed, revealing that the solutions are only able to partially depict the scale-interaction processes of turbulence. They lack some of the key nonlinear processes, such as the mean–fluctuation interaction and direct/inverse energy cascade. Therefore, their utilisation and interpretation for modelling fully developed multi-scale turbulence requires extra care. Finally, we also report an invariant solution with two-scale energetics related to the ‘inverse’ energy cascade, and its physical relevance is discussed in the context of the previous work by Doohan et al. (Reference Doohan, Willis and Hwang2021) (§ 4.3).
This paper is organised as follows. The shear stress-driven flow model, and the two-scale energy balance equations and related observables are discussed in § 2. The invariant solutions computed are presented in § 3, together with their bifurcation diagrams and phase portraits. Finally, the invariant solutions are critically compared to the turbulent state in § 4, in terms of the mean–fluctuation interaction and direct/inverse energy cascade, and the conclusions are discussed in § 5.
2. Problem formulation
2.1. Shear stress-driven flow model
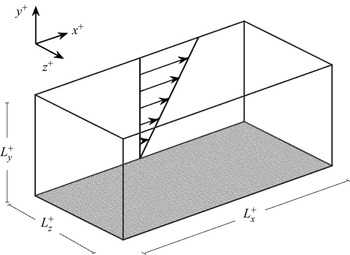
The shear stress-driven flow model of Doohan et al. (Reference Doohan, Willis and Hwang2019, Reference Doohan, Willis and Hwang2021) is considered as a model of wall-bounded turbulence, the flow geometry of which is sketched in figure 1. For full details of the construction and verification of the model, the reader may also refer to Doohan et al. (Reference Doohan, Willis and Hwang2019, Reference Doohan, Willis and Hwang2021). The fully developed turbulent flow in this model defines a time-averaged friction velocity  $u_\tau$. Using the friction velocity, this model is re-scaled in inner units, denoted by the superscript
 $^{+}$, where
 $t^{+}$ is time,
 $\boldsymbol {x}^{+}=(x^{+},y^{+},z^{+})$ are the streamwise, wall-normal and spanwise coordinates,
 $(L_x^{+},L_y^{+},L_z^{+})$ the domain dimensions and
 $\boldsymbol {u}^{+}=(u^{+},v^{+},w^{+})$ the corresponding velocity components. The wall is located at the lower boundary of the domain denoted by
 $y^{+}=0$. The velocity field can be expressed in terms of the mean and fluctuating components:
 $\boldsymbol {u}^{+}(\boldsymbol {x}^{+},t^{+})=\boldsymbol {U}^{+}(y^{+},t^{+})+\boldsymbol {u}'^{+}(\boldsymbol {x}^{+},t^{+})$, where
 $\boldsymbol {U}^{+}=\langle \boldsymbol {u}^{+} \rangle _{x^{+},z^{+}}$,
 $\boldsymbol {u}'^{+}=(u'^{+},v'^{+},w'^{+})$ and
 $\langle {\cdot }\rangle _{x^{+},z^{+}}$ denotes the average in the streamwise and spanwise directions. The time-averaged mean streamwise momentum equation is then given by
 \begin{equation} \frac{{\rm d}\bar{U}^{+}}{{{\rm d} y}^{+}} - \overline{\langle u'^{+}v'^{+}\rangle}_{x^{+},z^{+}} = 1, \end{equation}
where  $\overline {({\cdot })}$ denotes the average in time and
 $U^{+}$ is the streamwise component of
 $\boldsymbol {U}^{+}$. We note that (2.1) is approximately valid within the mesolayer for any wall-bounded parallel shear flow in the asymptotic limit
 $Re_\tau \rightarrow \infty$. For example, in pressure-driven channel flow, an extra term originating from the pressure gradient,
 $-y^{+}/Re_\tau$, vanishes in this limit, provided that
 $L_y^{+}$ is within the mesolayer, i.e.
 $y^{+}\lesssim \sqrt {Re_\tau }$ (e.g. Long & Chen Reference Long and Chen1981; Wei et al. Reference Wei, Fife, Klewicki and McMurtry2005). As
 $L_y^{+} \rightarrow \infty$, it is not possible to simulate the entirety of the mesolayer as
 $Re_\tau \rightarrow \infty$. Instead, by choosing a suitable
 $L_y^{+}$, our simulations resolve the inner-scaling dynamics related to the part of the flow within the mesolayer, i.e. the outer flow is explicitly excluded from the model with an asymptotic scaling, and the part of the inner-scaling flow dynamics, defined by the computational domain, is simulated in isolation like in the minimal flow unit (Jiménez & Moin Reference Jiménez and Moin1991). The choice for
 $L_y^{+}$ therefore determines the extent of the near-wall region and mesolayer simulated in the asymptotic limit
 $Re_\tau \rightarrow \infty$, typically informed by observations of near-wall turbulence: for example, in Doohan et al. (Reference Doohan, Willis and Hwang2019),
 $L_y^{+} \approx 90$ was found to be a reasonable choice with
 $L_z^{+} \approx 110$ and
 $L_x^{+} \approx 320$, providing the turbulence statistics and spectra almost identical to those from the minimal-flow-unit simulation in plane Couette flow for
 $y^{+}\lesssim 50$. In general, the flow statistics resolved in a simulation depend on the value of
 $L_y^{+}$. However, it remains unchanged below a certain wall-normal location in the flow domain, if
 $L_y^{+}$ is chosen to be sufficiently large.
Geometry of the shear stress-driven flow model.

The fluctuating velocity components are governed by the momentum equation
 \begin{align} \frac{\partial\boldsymbol{u}'^{+}}{\partial t^{+}} +(\boldsymbol{U}^{+}\boldsymbol{\cdot}\boldsymbol{\nabla})\boldsymbol{u}'^{+} +(\boldsymbol{u}'^{+}\boldsymbol{\cdot}\boldsymbol{\nabla})\boldsymbol{U}^{+}&={-}\boldsymbol{\nabla} p'^{+} +\nabla^{2}\boldsymbol{u}'^{+} \nonumber\\ &\quad -\left[(\boldsymbol{u}'^{+}\boldsymbol{\cdot}\boldsymbol{\nabla})\boldsymbol{u}'^{+} -\langle(\boldsymbol{u}'^{+}\boldsymbol{\cdot}\boldsymbol{\nabla})\boldsymbol{u}'^{+}\rangle_{x^{+},z^{+}}\right], \end{align}
where  $p'^{+}$ is the pressure fluctuation. The no-slip condition
 $\boldsymbol {u}^{+}= \boldsymbol {0}$ is imposed at
 $y^{+}=0$ to represent the stationary wall. At the upper boundary, a horizontally uniform shear stress is applied such that a prescribed bulk flow rate is maintained during the simulation. The imposed boundary condition is identical to that of Doohan et al. (Reference Doohan, Willis and Hwang2021). Periodic boundary conditions are applied in the streamwise and spanwise directions. The numerical simulations in this study were carried out with the diablo Navier–Stokes solver (Bewley Reference Bewley2014). This code employs the Fourier–Galerkin method in the streamwise and spanwise directions with a
 $2/3$ dealiasing rule, and a second-order finite difference scheme in the wall-normal direction. The temporal discretisation is based on the fractional-step algorithm (Kim & Moin Reference Kim and Moin1985), with implicit treatment of wall-normal derivatives using the Crank–Nicolson scheme and explicit treatment of the remaining terms using a low-storage third-order Runge–Kutta scheme. For further details about the model and its validation, the reader may refer to Doohan et al. (Reference Doohan, Willis and Hwang2019).
In this study, the number of integral length scales is restricted to two as in Doohan et al. (Reference Doohan, Willis and Hwang2021) to consider the simplest multi-scale dynamics of similar order, i.e. near-wall turbulence with two integral length scales of motion. To this end, the domain size is chosen to be  $(L_x^{+}=640,L_y^{+}=180,L_z^{+}=220)$ and due to the streamwise- and spanwise-periodic boundary conditions, enforced by expressing the velocity field as a sum of discrete modes according to the Fourier–Galerkin method, the largest velocity structures resolved have spanwise wavenumbers
 $n=1,2$ and spanwise wavelengths
 $\lambda _z^{+}\approx 220$ and
 $\lambda _z^{+}\approx 110$. However, given that the smallest integral length scale is approximately
 $\lambda _z^{+}\approx 110$ (Jiménez & Moin Reference Jiménez and Moin1991), the remaining smaller velocity structures with higher harmonics would not be viewed to be energy-containing. In this way, the model allows for the analysis of the temporal dynamics of near-wall turbulence sustained at approximately two spanwise integral length scales. Throughout this work, the minimal unit of multi-scale near-wall turbulence is denoted by
 $\varOmega _2$ and its simulation parameters are summarised in table 1.
Simulation parameters of the minimal unit of multi-scale near-wall turbulence,  $\varOmega _2$. Here,
 $(L_x^{+},L_y^{+},L_z^{+})$ denote the domain dimensions,
 $N_x$,
 $N_y$ and
 $N_z$ the number of grid points in the streamwise, wall-normal and spanwise directions respectively, and
 $T^{+}$ the duration of the flow simulation.

2.2. Two-scale energy balance
Having introduced the shear stress-driven flow model, the task at hand is to introduce the observables which would well represent the temporal dynamics at two spanwise integral length scales. In this study, we follow the approach in Doohan et al. (Reference Doohan, Willis and Hwang2021), where a binary decomposition of the fluctuating velocity field is first considered in order to separate the energy-containing eddies at each integral length scale, i.e.  $\boldsymbol {u}'^{+}=\boldsymbol {u}_l^{+}+\boldsymbol {u}_s^{+}$, where
 $\boldsymbol {u}_l^{+}=(u_l^{+},v_l^{+},w_l^{+})$ denotes the large-scale velocity field and
 $\boldsymbol {u}_s^{+}=(u_s^{+},v_s^{+},w_s^{+})$ the small-scale velocity field. Here,
 $\boldsymbol {u}_l^{+}$ and
 $\boldsymbol {u}_s^{+}$ are defined as
 $$\begin{gather} \boldsymbol{u}_l^{+}=\sum_{|m|\leqslant m_x}\,\sum_{|n|\leqslant 1}\widehat{\boldsymbol{u}_{m,n}'^{+}} \exp({{\rm i}(mk_{x0}^{+}x^{+}+nk_{z0}^{+}z^{+})});\quad |m|+|n|\neq 0, \end{gather}$$
 $$\begin{gather}\boldsymbol{u}_s^{+}=\sum_{|m|\leqslant m_x}\,\sum_{2 \leqslant|n|\leqslant n_z}\widehat{\boldsymbol{u}_{m,n}'^{+}} \exp({{\rm i}(mk_{x0}^{+}x^{+}+nk_{z0}^{+}z^{+})}), \end{gather}$$
where  $\widehat {({\cdot })}$ denotes the Fourier coefficients,
 $k_{x0}^{+}$ and
 $k_{z0}^{+}$ are the fundamental streamwise and spanwise wavenumbers, and
 $m_x$ and
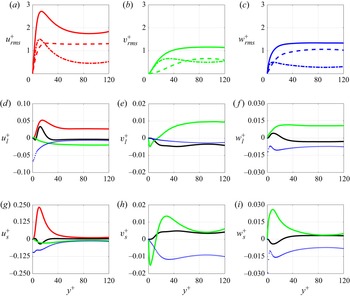
 $n_z$ are the number of harmonics in the streamwise and spanwise directions. This decomposition is based entirely on the spanwise wavelength and all streamwise wavelengths are included (apart from the spatial mean), because the size of energy-containing eddies in wall-bounded turbulence is well characterised by the spanwise length scale and they are composed of structures of various streamwise length scales (Hwang Reference Hwang2015). The root-mean-squared velocity profiles and their large- and small-scale components are shown in figures 2(a)–2(c). The large-scale structures are relatively uniform across the wall-normal domain (dashed lines) whereas the small-scale structures are much more pronounced near the wall (dash-dotted lines), consistent with Townsend's hypothesis (Townsend Reference Townsend1980). Note that these results (and those in subsequent sections) are plotted over the interval
 $y^{+}\in [0,120]$ so as to exclude the flow region immediately below the upper boundary.
Root-mean-squared velocity profiles  $(a)$
 $u^{+}_{rms}$,
 $(b)$
 $v^{+}_{rms}$ and
 $(c)$
 $w^{+}_{rms}$ (solid lines), decomposed into their large-scale (dashed lines) and small-scale (dash-dotted lines) components. Time-averaged, wall-normal profiles of a selection of terms on the right-hand side of (d)–(f) (2.4) and (g)–(i) (2.5): turbulent production (red), inter-scale turbulent transport (black), pressure strain (green) and dissipation (blue) of
 $(d)$
 $E^{+}_{ul}$ (
 $P^{+}_{ul},-T^{+}_{\updownarrow,ul},\varPi ^{+}_{ul},\epsilon ^{+}_{ul}$),
 $(e)$
 $E^{+}_{vl}$ (
 $-T^{+}_{\updownarrow,vl},\varPi ^{+}_{vl},\epsilon ^{+}_{vl}$),
 $(\,f)$
 $E^{+}_{wl}$ (
 $-T^{+}_{\updownarrow,wl},\varPi ^{+}_{wl},\epsilon ^{+}_{wl}$),
 $(g)$
 $E^{+}_{us}$ (
 $P^{+}_{us},T^{+}_{\updownarrow,us},\varPi ^{+}_{us},\epsilon ^{+}_{us}$),
 $(h)$
 $E^{+}_{vs}$ (
 $T^{+}_{\updownarrow,vs},\varPi ^{+}_{vs},\epsilon ^{+}_{vs}$) and
 $(i)$
 $E^{+}_{ws}$ (
 $T^{+}_{\updownarrow,ws},\varPi ^{+}_{ws},\epsilon ^{+}_{ws}$).

Substitution of  $\boldsymbol {u}_l^{+}$ and
 $\boldsymbol {u}_s^{+}$ into (2.2) yields the large- and small-scale momentum equations
 \begin{equation} \left.\begin{gathered} \frac{\partial \boldsymbol{u}^{+}_l}{\partial t^{+}} +(\boldsymbol{U}^{+}\boldsymbol{\cdot}\boldsymbol{\nabla})\boldsymbol{u}^{+}_l={-}(\boldsymbol{u}^{+}_l\boldsymbol{\cdot}\boldsymbol{\nabla})\boldsymbol{U}^{+} -\boldsymbol{\nabla} p^{+}_l +\nabla^{2}\boldsymbol{u}^{+}_l \\ -\mathcal{P}_l\{(\boldsymbol{u}^{+}_l\boldsymbol{\cdot}\boldsymbol{\nabla})\boldsymbol{u}^{+}_l +(\boldsymbol{u}^{+}_l\boldsymbol{\cdot}\boldsymbol{\nabla})\boldsymbol{u}^{+}_s +(\boldsymbol{u}^{+}_s\boldsymbol{\cdot}\boldsymbol{\nabla})\boldsymbol{u}^{+}_l +(\boldsymbol{u}^{+}_s\boldsymbol{\cdot}\boldsymbol{\nabla})\boldsymbol{u}^{+}_s\} \end{gathered}\right\} \end{equation}
and
 \begin{equation} \left.\begin{gathered} \frac{\partial \boldsymbol{u}^{+}_s}{\partial t^{+}} +(\boldsymbol{U}^{+}\boldsymbol{\cdot}\boldsymbol{\nabla})\boldsymbol{u}^{+}_s={-}(\boldsymbol{u}^{+}_s\boldsymbol{\cdot}\boldsymbol{\nabla})\boldsymbol{U}^{+} -\boldsymbol{\nabla} p^{+}_s +\nabla^{2}\boldsymbol{u}^{+}_s \\ -\mathcal{P}_s\{ (\boldsymbol{u}^{+}_s\boldsymbol{\cdot}\boldsymbol{\nabla})\boldsymbol{u}^{+}_s +(\boldsymbol{u}^{+}_s\boldsymbol{\cdot}\boldsymbol{\nabla})\boldsymbol{u}^{+}_l +(\boldsymbol{u}^{+}_l\boldsymbol{\cdot}\boldsymbol{\nabla})\boldsymbol{u}^{+}_s +(\boldsymbol{u}^{+}_l\boldsymbol{\cdot}\boldsymbol{\nabla})\boldsymbol{u}^{+}_l\}, \end{gathered}\right\} \end{equation}
where  $p'^{+}=p_l^{+}+p_s^{+}$ are the large- and small-scale pressure fluctuations that enforce continuity of the large- and small-scale velocity fields, and
 $\mathcal {P}_l\{{\cdot }\}$ and
 $\mathcal {P}_s\{{\cdot }\}$ denote projection onto large and small scales, respectively. Using (2.4) and (2.5), the componentwise energy-balance equations at each scale can be defined, as detailed in Doohan et al. (Reference Doohan, Willis and Hwang2021). Multiplying (2.4) by
 $\boldsymbol {u}_l^{+}$ and averaging in the streamwise and spanwise directions with some further rearrangement of nonlinear terms, the large-scale energy balance equation is written as
 $$\begin{gather} \frac{\partial E^{+}_{ul}}{\partial t^{+}}= P^{+}_{ul}-T^{+}_{u,\updownarrow}+T^{+}_{ul,-}+T^{+}_{ul,\#}+\varPi^{+}_{ul}+T^{+}_{\nu,ul}+\epsilon^{+}_{ul}, \end{gather}$$
 $$\begin{gather}\frac{\partial E^{+}_{vl}}{\partial t^{+}}= T^{+}_{p,vl}-T^{+}_{v,\updownarrow}+T^{+}_{vl,-}+T^{+}_{vl,\#} +\varPi^{+}_{vl}+T^{+}_{\nu,vl}+\epsilon^{+}_{vl}, \end{gather}$$
 $$\begin{gather}\frac{\partial E^{+}_{wl}}{\partial t^{+}}={-}T^{+}_{w,\updownarrow}+T^{+}_{wl,-}+T^{+}_{wl,\#} +\varPi^{+}_{wl}+T^{+}_{\nu,wl}+\epsilon^{+}_{wl}, \end{gather}$$
where
 \begin{equation} E^{+}_{ul}=\tfrac{1}{2}\langle (u_l^{+})^{2} \rangle_{x^{+},z^{+}}, \quad E^{+}_{vl}=\tfrac{1}{2}\langle (v_l^{+})^{2} \rangle_{x^{+},z^{+}} \quad \mathrm{and} \quad E^{+}_{wl}=\tfrac{1}{2}\langle (w_l^{+})^{2} \rangle_{x^{+},z^{+}} \end{equation}
are large-scale streamwise, wall-normal and spanwise kinetic energy,  $P^{+}_{ul}$ is large-scale turbulent production,
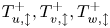 $T^{+}_{u,\updownarrow }, T^{+}_{v,\updownarrow }, T^{+}_{w,\updownarrow }$ are streamwise, wall-normal and spanwise ‘inter-scale’ turbulent transport,
 $T^{+}_{ul,-}, T^{+}_{vl,-}, T^{+}_{wl,-}$ large-scale streamwise, wall-normal and spanwise ‘intra-scale spatial’ turbulent transport,
 $T^{+}_{ul,\#}, T^{+}_{vl,\#}, T^{+}_{wl,\#}$ large-scale streamwise, wall-normal and spanwise ‘inter-scale spatial’ turbulent transport,
 $\varPi ^{+}_{ul}$,
 $\varPi ^{+}_{vl}$ and
 $\varPi ^{+}_{wl}$ large-scale streamwise, wall-normal and spanwise pressure strain,
 $T^{+}_{p,vl}$ is large-scale pressure transport,
 $T^{+}_{\nu,ul}$,
 $T^{+}_{\nu,vl}$ and
 $T^{+}_{\nu,wl}$ are large-scale streamwise, wall-normal and spanwise viscous transport, and
 $\epsilon ^{+}_{ul}$,
 $\epsilon ^{+}_{vl}$ and
 $\epsilon ^{+}_{wl}$ are large-scale streamwise, wall-normal and spanwise dissipation. Similarly, using (2.5) the small-scale energy balance equation is obtained as
 $$\begin{gather} \frac{\partial E^{+}_{us}}{\partial t^{+}}= P^{+}_{us}+T^{+}_{u,\updownarrow}+T^{+}_{us,-}+T^{+}_{us,\#} +\varPi^{+}_{us}+T^{+}_{\nu,us}+\epsilon^{+}_{us}, \end{gather}$$
 $$\begin{gather}\frac{\partial E^{+}_{vs}}{\partial t^{+}}= T^{+}_{p,vs}+T^{+}_{v,\updownarrow}+T^{+}_{vs,-}+T^{+}_{vs,\#} +\varPi^{+}_{vs}+T^{+}_{\nu,vs}+\epsilon^{+}_{vs}, \end{gather}$$
 $$\begin{gather}\frac{\partial E^{+}_{ws}}{\partial t^{+}}= T^{+}_{w,\updownarrow}+T^{+}_{ws,-}+T^{+}_{ws,\#} +\varPi^{+}_{ws}+T^{+}_{\nu,ws}+\epsilon^{+}_{ws}, \end{gather}$$
in which
 \begin{equation} E^{+}_{us}=\tfrac{1}{2}\langle (u_s^{+})^{2} \rangle_{x^{+},z^{+}}, \quad E^{+}_{vs}=\tfrac{1}{2}\langle (v_s^{+})^{2} \rangle_{x^{+},z^{+}} \quad \mathrm{and} \quad E^{+}_{ws}=\tfrac{1}{2}\langle (w_s^{+})^{2} \rangle_{x^{+},z^{+}} \end{equation}
are small-scale streamwise, wall-normal and spanwise kinetic energy,  $P^{+}_{us}$ is small-scale turbulent production,
 $T^{+}_{us,-}, T^{+}_{vs,-}, T^{+}_{ws,-}$ are small-scale streamwise, wall-normal and spanwise ‘intra-scale spatial’ turbulent transport,
 $T^{+}_{us,\#}, T^{+}_{vs,\#}, T^{+}_{ws,\#}$ small-scale streamwise, wall-normal and spanwise ‘inter-scale spatial’ turbulent transport,
 $\varPi ^{+}_{us}$,
 $\varPi ^{+}_{vs}$ and
 $\varPi ^{+}_{ws}$ are small-scale streamwise, wall-normal and spanwise pressure strain,
 $T^{+}_{p,vs}$ is small-scale pressure transport,
 $T^{+}_{\nu,us}$,
 $T^{+}_{\nu,vs}$ and
 $T^{+}_{\nu,ws}$ small-scale streamwise, wall-normal and spanwise viscous transport, and
 $\epsilon ^{+}_{us}$,
 $\epsilon ^{+}_{vs}$ and
 $\epsilon ^{+}_{ws}$ small-scale streamwise, wall-normal and spanwise dissipation. The definitions of the terms in the large- and small-scale energy balance equations are given in full in supplementary material § 1 available at https://doi.org/10.1017/jfm.2022.686.
Some key features of the terms defined in (2.6) and (2.8) are subsequently discussed. The turbulent production terms  $P^{+}_{ul}$ and
 $P^{+}_{us}$ originate from the first linear term in the right-hand side of (2.4) and (2.5), and they represent the linear mechanisms through which the large- and small-scale velocity fluctuations extract energy from the mean velocity. If averaged in time and the wall-normal direction, the production terms are perfectly balanced with the dissipation terms:
 \begin{equation} \overline{\langle P^{+}_{ul}+P^{+}_{us} \rangle_{y^{+}}}=\overline{\langle \epsilon^{+}_{ul}+\epsilon^{+}_{vl}+\epsilon^{+}_{wl}+\epsilon^{+}_{us}+\epsilon^{+}_{vs}+\epsilon^{+}_{ws} \rangle_{y^{+}}}. \end{equation}
The pressure strain and transport terms involve both linear and nonlinear mechanisms, because the pressure is driven by ‘fast’ linear and ‘slow’ nonlinear terms in (2.6) and (2.8) (Kim Reference Kim1989). From the continuity equation, the pressure strain terms at each scale also satisfy  $-\varPi ^{+}_{ul}=\varPi ^{+}_{vl}+\varPi ^{+}_{wl}$ and
 $-\varPi ^{+}_{us}=\varPi ^{+}_{vs}+\varPi ^{+}_{ws}$, playing a crucial role in the distribution of TKE produced in the streamwise component to the wall-normal and spanwise components (Cho et al. Reference Cho, Hwang and Choi2018). In particular, at the integral length scale, this process was found to be closely associated with the streak instability/breakdown in the SSP at each scale (Doohan et al. Reference Doohan, Willis and Hwang2021). Turbulent transport, which originates from the nonlinear terms in (2.4) and (2.5), is broken down into ‘inter-scale’ transport (with subscript ‘
 $_\updownarrow$’), ‘inter-scale spatial’ transport (with subscript ‘
 $_\#$’) and ‘intra-scale spatial’ transport (with subscript ‘
 $_-$’). The inter-scale transport terms,
 $$\begin{gather} T^{+}_{u,\updownarrow}=\langle u_l^{+}(\boldsymbol{u}^{+}_l\boldsymbol{\cdot}\boldsymbol{\nabla} u_s^{+})\rangle_{x^{+},z^{+}} - \langle u_s^{+}(\boldsymbol{u}^{+}_s\boldsymbol{\cdot}\boldsymbol{\nabla} u_l^{+}) \rangle_{x^{+},z^{+}}, \end{gather}$$
 $$\begin{gather}T^{+}_{v,\updownarrow}=\langle v_l^{+}(\boldsymbol{u}^{+}_l\boldsymbol{\cdot}\boldsymbol{\nabla} v_s^{+})\rangle_{x^{+},z^{+}} - \langle v_s^{+}(\boldsymbol{u}^{+}_s\boldsymbol{\cdot}\boldsymbol{\nabla} v_l^{+}) \rangle_{x^{+},z^{+}}, \end{gather}$$
 $$\begin{gather}T^{+}_{w,\updownarrow}=\langle w_l^{+}(\boldsymbol{u}^{+}_l\boldsymbol{\cdot}\boldsymbol{\nabla} w_s^{+})\rangle_{x^{+},z^{+}} - \langle w_s^{+}(\boldsymbol{u}^{+}_s\boldsymbol{\cdot}\boldsymbol{\nabla} w_l^{+}) \rangle_{x^{+},z^{+}}, \end{gather}$$
depend on both large- and small-scale velocity components and are shared by (2.6) and (2.8) with opposite sign, indicating that they play a role in the direct same-component exchange of TKE between different scales. The ‘inter-scale spatial’ transport terms also represent a type of scale interaction and depend on both large- and small-scale velocity components. However, the resulting energy transfer only takes place locally in space (i.e. in the wall-normal direction), because there is no ‘net’ transfer generated from
 \begin{equation} \left.\begin{gathered} \langle T^{+}_{ul,\#} \rangle_{y^{+}}=\langle T^{+}_{vl,\#} \rangle_{y^{+}}=\langle T^{+}_{wl,\#} \rangle_{y^{+}}=0, \\ \langle T^{+}_{us,\#} \rangle_{y^{+}}=\langle T^{+}_{vs,\#} \rangle_{y^{+}}=\langle T^{+}_{ws,\#} \rangle_{y^{+}}=0, \end{gathered}\right\} \end{equation}
as per their definitions (see supplementary material § 1). Finally, the ‘intra-scale spatial’ transport terms are only associated with the redistribution of energy across space induced by velocity components of the same scale. Given the nature of the turbulent transport terms discussed here, the primary focus in this study will be given to studying the inter-scale direct turbulent transport in (2.11). The statistics of the production, inter-scale turbulent transport, pressure strain and dissipation terms discussed previously are shown in figure 2. For further discussion of these variables, the reader may refer to Doohan et al. (Reference Doohan, Willis and Hwang2021), in which their statistical characteristics, temporal dynamics and cross-correlations are extensively studied. Note that the statistical profiles of the intra- and inter-scale spatial turbulent transport terms are plotted in figure 4 of that work.
2.3. Observables
Time-dependent observables, required for the construction of phase portraits, are now defined by suitably averaging the terms in (2.6) and (2.8) in the wall-normal direction. Here, it should be mentioned that the decomposition (2.3) for the energy-balance equations (2.6) and (2.8) is only introduced as a matter of convenience. Indeed, the energy transfer dynamics have been found to vary considerably across the wall-normal domain. For instance,  $E_{us}^{+}$ in (2.8) not only contains the energy of the small-scale anisotropic near-wall coherent structures (e.g. streaks) but also that of relatively isotropic small-scale eddies generated by the energy cascade from the large-scale structures. Given the two completely different origins of the dynamics involved in
 $E_{us}^{+}$ depending on the wall-normal location, the limits of integration in
 $y^{+}$ have been chosen carefully as discussed in detail in Doohan et al. (Reference Doohan, Willis and Hwang2021). In subsequent sections, the same notation is used to denote the
 $y^{+}$-averaged terms but the corresponding limits of integration are also indicated for the time-dependent observables: for example,
 $T^{+}_{u,\updownarrow }|_{45}^{120}$ is the streamwise inter-scale turbulent transport term averaged over the interval
 $y^{+}\in [45,120]$.
While the observables defined with the terms in (2.6) and (2.8) are useful to understand the energy transfer dynamics between large and small scales, they are not very informative about the dynamics of the coherent structures within each scale. The dynamics of the structures at each scale has been well understood in terms of the SSP which involves the interplay between rolls, streaks and the streak-instability waves (e.g. Hamilton et al. Reference Hamilton, Kim and Waleffe1995; Hwang & Bengana Reference Hwang and Bengana2016). Therefore, the observables representing these fundamental structural elements are also defined by further decomposing the velocity components into their streamwise-independent and streamwise-dependent parts. The kinetic energies of large-scale straight streaks (ss), wavy streaks (ws), straight rolls (sr) and wavy rolls (wr) are defined as
 $$\begin{gather} E^{+}_{ss,l}(t^{+})=\left.\tfrac{1}{2}\langle \langle u_l^{+} \rangle_{x^{+}}^{2} \rangle_{z^{+}}\right|_{0}^{120}, \end{gather}$$
 $$\begin{gather}E^{+}_{ws,l}(t^{+})=\left.\tfrac{1}{2}\langle (u_l^{+}- \langle u_l^{+} \rangle_{x^{+}})^{2} \rangle_{x^{+},z^{+}}\right|_{0}^{120}, \end{gather}$$
 $$\begin{gather}E^{+}_{sr,l}(t^{+})=\left.\tfrac{1}{2}\langle \langle v_l^{+} \rangle_{x^{+}}^{2} + \langle w_l^{+} \rangle_{x^{+}}^{2} \rangle_{z^{+}}\right|_{0}^{120}, \end{gather}$$
 $$\begin{gather}E^{+}_{wr,l}(t^{+})=\left.\tfrac{1}{2}\langle (v_l^{+}- \langle v_l^{+} \rangle_{x^{+}})^{2} + (w_l^{+}- \langle w_l^{+} \rangle_{x^{+}})^{2} \rangle_{x^{+},z^{+}}\right|_{0}^{120}, \end{gather}$$
respectively, while the kinetic energies of small-scale straight streaks, wavy streaks, straight rolls and wavy rolls are defined as
 $$\begin{gather} E^{+}_{ss,s}(t^{+})=\left.\tfrac{1}{2}\langle \langle u_s^{+} \rangle_{x^{+}}^{2} \rangle_{z^{+}}\right|_{0}^{45}, \end{gather}$$
 $$\begin{gather}E^{+}_{ws,s}(t^{+})=\left.\tfrac{1}{2}\langle (u_s^{+}- \langle u_s^{+} \rangle_{x^{+}})^{2} \rangle_{x^{+},z^{+}}\right|_{0}^{45}, \end{gather}$$
 $$\begin{gather}E^{+}_{sr,s}(t^{+})=\left.\tfrac{1}{2}\langle \langle v_s^{+} \rangle_{x^{+}}^{2} + \langle w_s^{+} \rangle_{x^{+}}^{2} \rangle_{z^{+}}\right|_{0}^{45}, \end{gather}$$
 $$\begin{gather}E^{+}_{wr,s}(t^{+})=\left.\tfrac{1}{2}\langle (v_s^{+}- \langle v_s^{+} \rangle_{x^{+}})^{2} + (w_s^{+}- \langle w_s^{+} \rangle_{x^{+}})^{2} \rangle_{x^{+},z^{+}}\right|_{0}^{45}, \end{gather}$$
respectively. Finally, it has been found that there exists an inverse energy transfer from small to large scales in the region close to the wall (Cho et al. Reference Cho, Hwang and Choi2018), which has been referred to as ‘feeding’ (Doohan et al. Reference Doohan, Willis and Hwang2021). The structures that emerge from the feeding process are primarily localised streamwise and spanwise velocity fluctuations, and they are ‘inactive’ in the sense that they carry little to no Reynolds shear stress (Townsend Reference Townsend1980). Following Doohan et al. (Reference Doohan, Willis and Hwang2021), the large-scale inactive structures resulting from the streamwise feeding process are measured through the near-wall kinetic energy of wavy streamwise motion
 \begin{equation} E^{+}_{wu,i}=\left.\tfrac{1}{2}\langle(u_l^{+}- \langle u_l^{+} \rangle_{x^{+}})^{2} \rangle_{x^{+},z^{+}}\right|_{0}^{20}. \end{equation}
3. Invariant solutions
3.1. Computation of solutions
Doohan et al. (Reference Doohan, Willis and Hwang2019) computed invariant solutions for a single-scale minimal unit using the Newton–Krylov–Hooksetp algorithm (Viswanath Reference Viswanath2007, Reference Viswanath2009; Gibson et al. Reference Gibson, Halcrow and Cvitanovic2008; Willis et al. Reference Willis, Cvitanović and Avila2013). Given a velocity field  $\boldsymbol {u}^{+}$ that is expected to be close to an invariant solution, this method minimises the relative error
 \begin{equation} r=\frac{||\sigma({-}s_x^{+},-s_z^{+})\,{\boldsymbol{\varPhi}}^{T^{+}} (\boldsymbol{u}^{+})-\boldsymbol{u}^{+}||}{||\boldsymbol{u}^{+}||}, \end{equation}
where  $\boldsymbol {\varPhi }^{T^{+}}$ is the Navier–Stokes propagator, which integrates
 $\boldsymbol {u}^{+}$ forward in time by a period
 $T^{+}$, and
 $\sigma$ applies a spatial shift to the resulting velocity field by distances
 $-s_x$ and
 $-s_z$. The minus sign indicates that these shifts are in the negative
 $x$ and
 $z$ direction, in particular to counter the downstream advection of the solutions. The phase speeds of the solution are
 $c_x^{+}=s_x^{+}/T^{+}$,
 $c_z^{+}=s_z^{+}/T^{+}$, being careful to ensure that the shifts have not been aliased by a period of the domain. For periodic orbits,
 $T^{+}$ also needs to be determined, while for travelling waves the choice of
 $T^{+}$ is arbitrary, usually taken to be of order
 $10$. The domain
 $\varOmega _1$ in which the solutions were calculated by Doohan et al. (Reference Doohan, Willis and Hwang2019) had dimensions
 $L_x^{+}=320$,
 $L_y^{+}=90$ and
 $L_z^{+}=110$, i.e. each dimension is half that of the domain
 $\varOmega _2$ of the present study, given in table 1. Although this is quite a difference in domain size, it is expected that it should be possible to use the same Newton-based algorithm to numerically continue at least a subset of the invariant solutions to
 $\varOmega _2$.
During the continuation, the aspect ratio of the flow domain  $L_x^{+}:L_y^{+}:L_z^{+}$ is held fixed, and the shift-reflect symmetry
 \begin{equation} [u^{+},v^{+},w^{+}](x^{+},y^{+},z^{+}) = [u^{+},v^{+},-w^{+}](x^{+}+L_x^{+}/2,y^{+},-z^{+}) \end{equation}
is preserved. It is also possible to numerically continue the invariant solutions by increasing the wall-normal domain height from  $L_y^{+}=90$ to
 $L_y^{+}=180$ while maintaining
 $L_x^{+}=320$ and
 $L_z^{+}=110$ fixed. These solutions can then be concatenated in the streamwise and spanwise directions, forming a solution with four copies of the structure in the larger two-scale domain
 $\varOmega _2$. These solutions satisfy the periodic boundary conditions of
 $\varOmega _2$, so that the concatenated velocity field is an exact solution in
 $\varOmega _2$ with the same phase speeds
 $c_x^{+}$ and
 $c_z^{+}$, and time period
 $T^{+}$. Solutions constructed in this manner exhibit the half-shift-reflect symmetry
 \begin{equation} [u^{+},v^{+},w^{+}](x^{+},y^{+},z^{+}) = [u^{+},v^{+},-w^{+}](x^{+}+L_x^{+}/4,y^{+},-z^{+}), \end{equation}
where here  $L_x^{+}=640$ is the streamwise dimension of
 $\varOmega _2$. A critical limitation of the latter continuation approach is that these structures, due to their streamwise and spanwise periodicity within the flow domain, do not include the fundamental streamwise and spanwise wavenumbers, nor indeed all wavenumbers associated with odd
 $m$ and
 $n$ in (2.3). Clearly, the solutions computed in this manner do not capture the large-scale structures with spanwise wavelength
 $\lambda _z^{+}=220$ in (2.3a). Therefore, the invariant solutions obtained using the concatenation approach will be called the small-scale solutions, whereas those obtained through fixed-aspect ratio numerical continuation will be called the large-scale solutions.
Likewise, it is acknowledged that the continuation approach is also not ideal, in the sense that there is no explicit introduction of activity at multiple length scales. There is no robust approach, however, to finding or constructing such solutions. The search for recurrences, or quiescent periods, in the turbulent dynamics has been fruitful in identifying solutions in minimal domains, but the substantial extra degrees of freedom of the two-scale domain imply that the probability of experiencing a sufficiently close recurrence is vanishingly small. We have experimented with the superposition of some large- and small-scale solutions in order to construct a two-scale solution without success. Solutions that inherently include multi-scale activity might also be more naturally represented by a relative periodic orbit. However, as the period natural to the self-sustaining cycle at each scale is unlikely to be the same, this implies that periods for the overall multi-scale orbit may be infinite (quasi-periodic) or too long to be captured at present.
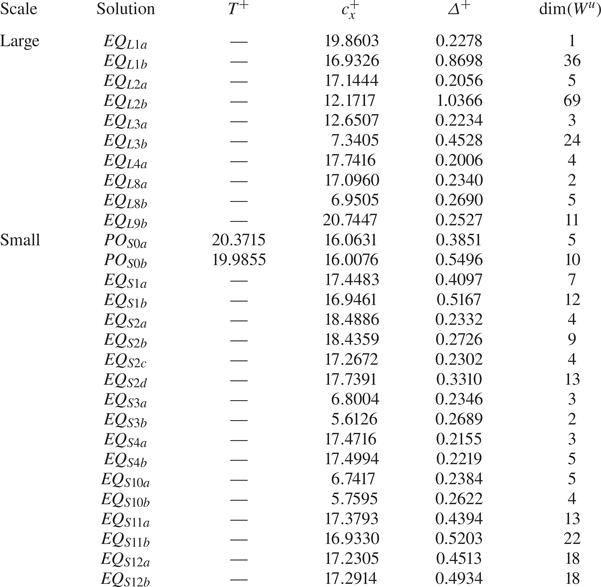
Using the continuation and concatenation approaches, in total, 10 large-scale solutions and 18 small-scale solutions have been computed in the minimal unit of multi-scale near-wall turbulence  $\varOmega _2$. The relative error
 $r$ of all solutions reported in this work is less than
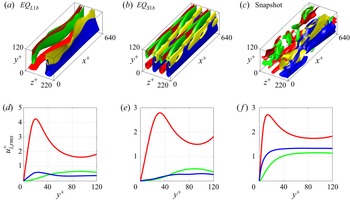
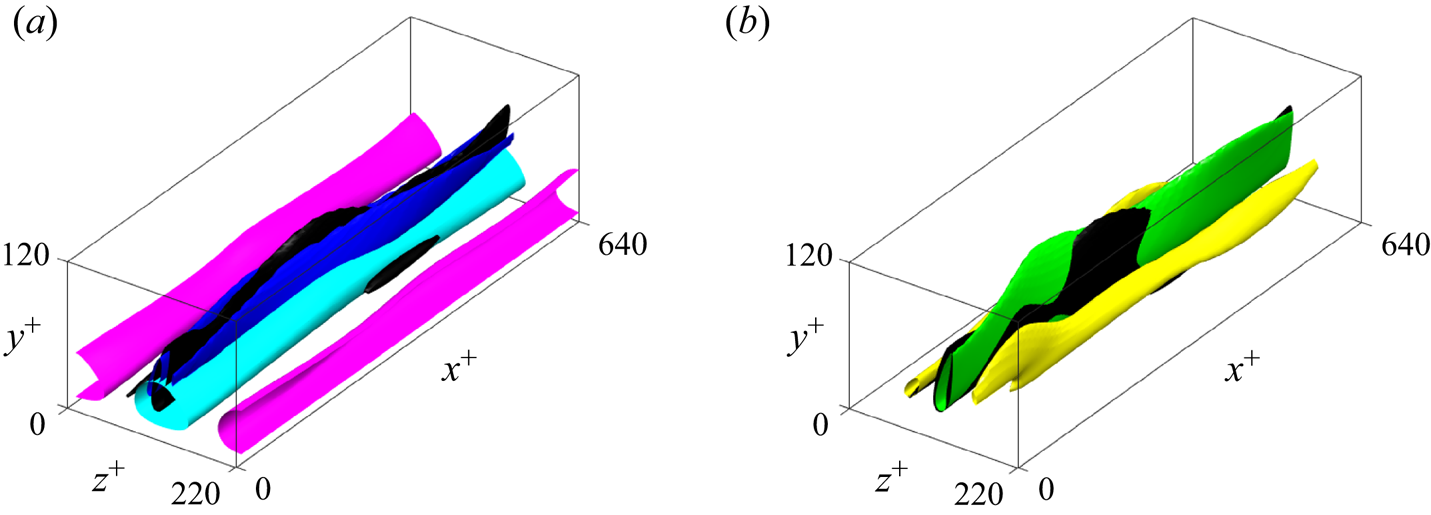
 $10^{-6}$. Their properties are summarised in table 2. A representative large-scale solution (
 $EQ_{L1b}$) and small-scale solution (
 $EQ_{S1b}$) are plotted in figure 3, together with a turbulent snapshot for reference. A detailed description of each of the large- and small-scale solutions is given in supplementary material § 2.
Properties of the large- and small-scale invariant solutions in the minimal unit of multi-scale near-wall turbulence  $\varOmega _2$: the time period
 $T^{+}$, the phase speed
 $c_x^{+}$, the wall shear rate
 $\varDelta ^{+}$ and the dimension of the unstable manifold within the corresponding subspace
 $\textrm {dim}(W^{u})$. The values of
 $c_x^{+}$ and
 $\varDelta ^{+}$ of
 $PO_{S0a}$ and
 $PO_{S0b}$ are averages over the corresponding time period
 $T^{+}$.

Velocity field visualisation and root mean squared velocity profiles of two invariant solutions and the turbulent state. High- and low-speed streaks  $u'^{+}$ are shown in red/blue, and positive and negative wall-normal velocity isosurfaces
 $v'^{+}$ are shown in yellow/green respectively: (a,d)
 $EQ_{L1b}$,
 $u'^{+}=\pm 3.50$,
 $v'^{+}=\pm 0.90$; (b,e)
 $EQ_{S1b}$,
 $u'^{+}=\pm 2.20$,
 $v'^{+}=\pm 0.50$; (c,f) a turbulent snapshot,
 $u'^{+}=\pm 3.50$,
 $v'^{+}=\pm 2.00$. The
 $u^{+}_{rms}$,
 $v^{+}_{rms}$ and
 $w^{+}_{rms}$ profiles are shown in red, green and blue, respectively.

3.2. Bifurcation of solutions
As described previously, the large-scale solutions are obtained through fixed-aspect ratio numerical continuation from the minimal unit  $\varOmega _1$ to the minimal unit of multi-scale near-wall turbulence
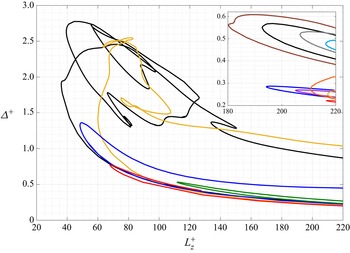
 $\varOmega _2$. However, it is also of interest to analyse the bifurcation of both large- and small-scale solutions over the domain size in order to establish connections between the solutions. The invariant solutions are continued over a range of values of the spanwise domain width
 $L_z^{+}$ whereas maintaining the aspect ratio of the flow domain fixed. The numerical continuation is carried out using a pseudo-arclength continuation algorithm and the resulting
 $(L_z^{+},\varDelta ^{+})$ bifurcation diagram is plotted in figure 4, where
 $\varDelta ^{+}$ is the time-averaged wall shear rate:
 \begin{equation} \varDelta^{+}=\left.\frac{{\rm d}\bar{U}^{+}}{{{\rm d}y}^{+}}\right\vert_{y^{+}=0} .\end{equation}
We note that the time-averaged wall shear rate of turbulent state is unity (i.e.  $\varDelta ^{+}=1$; see (2.1)).
The  $(L_z^{+},\varDelta ^{+})$ bifurcation diagram of the large-scale invariant solutions: black line,
 $EQ_{L1a}$ and
 $EQ_{L1b}$; gold line,
 $EQ_{L2a}$ and
 $EQ_{L2b}$; dark blue line,
 $EQ_{L3a}$ and
 $EQ_{L3b}$; red line,
 $EQ_{L4a}$; dark green line,
 $EQ_{L8a}$ and
 $EQ_{L8b}$. The insert shows the
 $(L_z^{+},\varDelta ^{+})$ bifurcation diagram of the small-scale invariant solutions: brown line,
 $PO_{S0a}$ and
 $PO_{S0b}$; black line,
 $EQ_{S1a}$ and
 $EQ_{S1b}$; gold line,
 $EQ_{S2a}$ and
 $EQ_{S2b}$; orange line,
 $EQ_{S2c}$ and
 $EQ_{S2d}$; dark blue line,
 $EQ_{S3a}$ and
 $EQ_{S3b}$; red line,
 $EQ_{S4a}$ and
 $EQ_{S4b}$; purple line,
 $EQ_{S10a}$ and
 $EQ_{S10b}$; grey line,
 $EQ_{S11a}$ and
 $EQ_{S11b}$; light blue line,
 $EQ_{S12a}$ and
 $EQ_{S12b}$. The
 $\varDelta ^{+}$ values of
 $PO_{S0a}$ and
 $PO_{S0b}$ are averages over the corresponding time period
 $T^{+}$.

The large-scale solutions  $EQ_{L1a}$ and
 $EQ_{L1b}$ emerge in a saddle-node bifurcation at
 $L_z^{+}\approx 35$ (black line). A secondary solution curve emerges at
 $L_z^{+}\approx 77$ on the upper branch, which exhibits highly erratic behaviour at low values of
 $L_z^{+}$ before rejoining the primary solution curve at the same point. The solutions
 $EQ_{L2a}$ and
 $EQ_{L2b}$ appear in a saddle-node bifurcation at
 $L_z^{+}\approx 60$ (gold line). The upper branch is highly complex at
 $L_z^{+}\approx 80$, but it varies smoothly with
 $L_z^{+}$ above
 $L_z^{+}\approx 90$, along which the solution
 $EQ_{L2b}$ was obtained. The solutions
 $EQ_{L3a}$ and
 $EQ_{L3b}$ (dark blue line),
 $EQ_{L4a}$ (red line) and
 $EQ_{L8a}$ and
 $EQ_{L8b}$ (dark green line) also emerge in saddle-node bifurcations at
 $L_z^{+}\approx 47$,
 $L_z^{+}\approx 67$ and
 $L_z^{+}\approx 112$, respectively. The upper branch of
 $EQ_{L4a}$ could not be traced up to
 $L_z^{+}=220$, because the relative error began to increase above the desired threshold. Furthermore,
 $EQ_{L9b}$ was not amenable to fixed-aspect ratio numerical continuation and so it does not appear in figure 4.
The  $(L_z^{+},\varDelta ^{+})$ bifurcation diagram of the small-scale solutions is plotted in the insert in figure 4, all of which also emerge in saddle-node bifurcations. However, the bifurcation points occur at much higher values of
 $L_z^{+}$, ranging from
 $L_z^{+}\approx 180$ for
 $PO_{S0a}$ and
 $PO_{S0b}$ (brown line) to
 $L_z^{+}\approx 217$ for
 $EQ_{S2a}$ and
 $EQ_{S2b}$ (gold line). It should be recalled that the small-scale solutions are obtained through velocity field concatenation and so they capture two sets of small-scale structures with spanwise wavelengths
 $\lambda _z^{+}=110$, as defined in (2.3). Therefore, this range of values of the bifurcation points is consistent with twice the characteristic spacing of near-wall streaks (e.g. Kline et al. Reference Kline, Reynolds, Schraub and Runstadler1967). The proximity of
 $\varOmega _2$ to the bifurcation points of the small-scale solutions would also explain the lack of velocity field diversity in supplementary material § 2.2, because there would be little difference between lower- and upper-branch solutions close to the bifurcation point and more diverse solutions may emerge at higher values of
 $L_z^{+}$. Finally, it is evident that the values of the wall shear rate
 $\varDelta ^{+}$ of most of the large- and small-scale solutions in
 $\varOmega _2$ (i.e.
 $L_z^{+}=220$ in figure 4) are considerably lower than that of the corresponding turbulent state (
 $\varDelta ^{+}=1$). Only
 $EQ_{L1b}$ and
 $EQ_{L2b}$ attain values comparable to that of the mean turbulent state (see table 2).
3.3. Phase portraits
The visualisation of the state space using suitably defined phase portraits is a key concept in the dynamical systems framework, which helps to rationalise the chaotic dynamics in terms of the geometrical structure of trajectories in the state space. While equilibria correspond to points in the state space, their stable and unstable manifolds characterise the local state space dynamics. In low-dimensional dynamical systems, the hope was that a sufficiently large number of such invariant solutions (including periodic orbits) would be able to offer physical insight into the global state-space dynamics of turbulence (Kerswell Reference Kerswell2005; Eckhardt et al. Reference Eckhardt, Schneider, Hof and Westerweel2007; Kawahara et al. Reference Kawahara, Uhlmann and Van Veen2012; Graham & Floryan Reference Graham and Floryan2020). Indeed, this approach has been successful in the characterisation of transition to turbulence in wall-bounded shear flows (e.g. Gibson et al. Reference Gibson, Halcrow and Cvitanovic2008; Kreilos & Eckhardt Reference Kreilos and Eckhardt2012; Zammert & Eckhardt Reference Zammert and Eckhardt2015), especially when the computational domain of interest is sufficiently small to avoid the further complexity of spatiotemporal effects (for the spatiotemporal nature of transition, see the review by Barkley Reference Barkley2016). Furthermore, for a turbulent flow at sufficiently low Reynolds numbers, in which the dynamics are dominated by the SSP at a single integral length scale (Jiménez & Moin Reference Jiménez and Moin1991; Hamilton et al. Reference Hamilton, Kim and Waleffe1995; Doohan et al. Reference Doohan, Willis and Hwang2019), it has been observed that the upper-branch solutions typically resemble the turbulent state (e.g. Gibson et al. Reference Gibson, Halcrow and Cvitanovic2009; Willis et al. Reference Willis, Cvitanović and Avila2013; Doohan et al. Reference Doohan, Willis and Hwang2019), whereas a few of the lower-branch solutions constitute the edge state (e.g. Itano & Toh Reference Itano and Toh2001; Skufca et al. Reference Skufca, Yorke and Eckhardt2006; Schneider et al. Reference Schneider, Eckhardt and Yorke2007, Reference Schneider, Gibson, Lagha, De Lillo and Eckhardt2008).
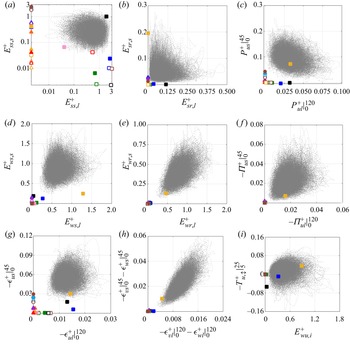
Having computed a number of solutions in  $\varOmega _2$ and analysed their bifurcation behaviour, the ability of the invariant solutions to capture the dynamics of near-wall turbulence with two integral length scales of motion is now assessed. Recalling the large-scale kinetic energy terms in (2.13), the small-scale kinetic energy terms in (2.14) and the terms in the large- and small-scale energy balance equations in (2.6) and (2.8), the turbulent trajectory and the large- and small-scale solutions are plotted in various phase portraits in figure 5.
Phase portraits of the turbulent trajectory (dotted grey line) and the invariant solutions in the following planes:  $(a)$
 $(E^{+}_{ss,l},E^{+}_{ss,s})$;
 $(b)$
 $(E^{+}_{sr,l},E^{+}_{sr,s})$;
 $(c)$
 $(P^{+}_{ul}|_{0}^{120},P^{+}_{us}|_{0}^{45})$;
 $(d)$
 $(E^{+}_{ws,l},E^{+}_{ws,s})$;
 $(e)$
 $(E^{+}_{wr,l},E^{+}_{wr,s})$;
 $(\,f)$
 $(-\varPi ^{+}_{ul}|_{0}^{120},-\varPi ^{+}_{us}|_{0}^{45})$;
 $(g)$
 $(-\epsilon ^{+}_{ul}|_{0}^{120},-\epsilon ^{+}_{us}|_{0}^{45})$;
 $(h)$
 $(-\epsilon ^{+}_{vl}|_{0}^{120}-\epsilon ^{+}_{wl}|_{0}^{120},-\epsilon ^{+}_{vs}|_{0}^{45}-\epsilon ^{+}_{ws}|_{0}^{45})$;
 $(i)$
 $(E^{+}_{wu,i},-T^{+}_{u,\updownarrow }|_{5}^{25})$. The edge state and the large-scale equilibrium solutions are plotted as squares, the small-scale equilibrium solutions as triangles and the small-scale periodic orbits as circles. The colour scheme is identical to that in figure 4, with the addition of the edge state in brown and
 $EQ_{L9b}$ in pink. Lower-branch solutions have unfilled symbols and upper-branch solutions have filled symbols. The values for the edge state,
 $PO_{S0a}$ and
 $PO_{S0b}$ are averages over the corresponding time period
 $T^{+}$.

The  $(E^{+}_{ss,l},E^{+}_{ss,s})$ phase portrait is shown in figure 5
 $(a)$. As expected, the small-scale equilibrium solutions (triangles) and small-scale periodic orbits (circles) do not capture any large-scale structures and lie along the ordinate, exhibiting a wide range of values of
 $E^{+}_{ss,s}$. Indeed, this is observed in all of the remaining phase portraits in figures 5(b)–5(i). The large-scale solutions (squares) exhibit significant values of
 $E^{+}_{ss,l}$, some of which are close to the maximum values attained by the turbulent trajectory, consistent with the strong straight streaks identified in the velocity field visualisations in supplementary material figure 2. However, most of the large-scale solutions do not feature typical values of
 $E^{+}_{ss,s}$ and are positioned well below the turbulent trajectory in figure 5
 $(a)$. This indicates that there is little development of small-scale structures during the numerical continuation of invariant solutions from
 $\varOmega _1$ to
 $\varOmega _2$, at least in most cases. Only
 $EQ_{L1b}$ (filled black square) exhibits considerable values of both
 $E^{+}_{ss,l}$ and
 $E^{+}_{ss,s}$, whereas
 $EQ_{L4a}$ (unfilled red square) and
 $EQ_{L9b}$ (filled pink square) are close to the minimum values attained by the turbulent trajectory.
The  $(E^{+}_{sr,l},E^{+}_{sr,s})$ phase portrait is plotted in figure 5
 $(b)$. With the exception of
 $EQ_{L2a}$ (unfilled gold square) and
 $EQ_{L2b}$ (filled gold square), it is apparent that the large-scale solutions (squares) only capture large-scale straight rolls and lie along the abscissa, whereas the small-scale solutions (triangles and circles) only capture small-scale straight rolls and lie along the ordinate. In particular,
 $EQ_{L1b}$ (filled black square),
 $EQ_{L4a}$ (unfilled red square) and
 $EQ_{L9b}$ (filled pink square) exhibit negligible values of
 $E^{+}_{sr,s}$. Therefore, it is evident that the large-scale solutions only capture the large-scale SSP (apart from
 $EQ_{L2a}$ and
 $EQ_{L2b}$) and the small-scale solutions only capture the small-scale SSP. Furthermore, the values of
 $E^{+}_{sr,l}$ attained by the large-scale solutions and the values of
 $E^{+}_{sr,s}$ attained by the small-scale solutions are considerably lower than the mean turbulent values of each, consistent with the weak wall-normal and spanwise velocity fluctuations observed in the root-mean-squared velocity profiles in supplementary material figure 2 and figure 3. Solution
 $EQ_{L2b}$ is the only large-scale solution that features significant values of both
 $E^{+}_{ss,s}$ in figure 5
 $(a)$ and
 $E^{+}_{sr,s}$ in figure 5
 $(b)$, but it exhibits negligible values of both
 $E^{+}_{ss,l}$ and
 $E^{+}_{sr,l}$. This indicates that it captures the small-scale SSP rather than the large-scale SSP, which requires further investigation (see § 4.3 for a further discussion). Likewise,
 $EQ_{L2a}$ attains a non-negligible value of
 $E^{+}_{ss,s}$ in figure 5
 $(a)$ and a very small value of
 $E^{+}_{sr,s}$ in figure 5
 $(b)$, suggesting that it is a subdued manifestation of the small-scale SSP.
In the  $(P^{+}_{ul}|_{0}^{120},P^{+}_{us}|_{0}^{45})$ phase portrait in figure 5
 $(c)$,
 $EQ_{L2b}$ (filled gold square) is the only solution that exhibits considerable values of both large- and small-scale turbulent production, indicative of two-scale energetics. However, this is counterintuitive because it does not capture the large-scale SSP, as discussed previously, and so the analysis of
 $EQ_{L2b}$ is deferred to § 4.3. With the exception of
 $EQ_{L2a}$ (unfilled gold square) and
 $EQ_{L2b}$, the large-scale solutions (squares) only attain non-negligible values of large-scale production and the small-scale solutions (triangles and circles) only attain non-negligible values of small-scale production, consistent with the previous results relating to the large- and small-scale SSPs. In particular,
 $EQ_{L1b}$ (filled black square) exhibits a negligible value of
 $P^{+}_{us}|_{0}^{45}$, implying that the structures associated with the large value of
 $E^{+}_{ss,s}$ in figure 5
 $(a)$ are passively driven by the large-scale dynamics of the solution. The values of
 $P^{+}_{ul}|_{0}^{120}$ attained by the large-scale solutions and the values of
 $P^{+}_{us}|_{0}^{45}$ attained by the small-scale solutions are also considerably lower than the mean turbulent values of each. This issue will be discussed in detail in § 4.1.
In the  $(E^{+}_{ws,l},E^{+}_{ws,s})$ phase portrait in figure 5
 $(d)$, it is apparent that the invariant solutions even fail to reproduce some fundamental features at each scale. With the exception of
 $EQ_{L2b}$ (filled gold square), the large-scale solutions (squares) do not capture prominent large- or small-scale wavy streaks and are clustered between the minimum values attained by the turbulent trajectory and the origin, nor do the small-scale solutions (triangles and circles) which lie along the ordinate well below the minimum values of
 $E^{+}_{ws,s}$. This failure is even more obvious in the
 $(E^{+}_{wr,l},E^{+}_{wr,s})$ phase portrait in figure 5
 $(e)$, in which both the large- and small-scale solutions (apart from
 $EQ_{L2b}$) capture neither large- nor small-scale wavy rolls and are positioned at the origin. These observations indicate that
 $x^{+}$-dependent structures are largely absent from the invariant solutions, consistent with the prominent elongated structures identified in the velocity field visualisations in supplementary material figures 2 and 3. Considering the large-scale solutions, we note that the numerical continuation from
 $\varOmega _1$ to
 $\varOmega _2$ is equivalent to increasing the ‘effective’ Reynolds number, while fixing the domain size. Therefore, the dominance of more elongated structures in the velocity fields can be explained by the fact that the straight streaks can be driven by straight rolls with lower energy at higher Reynolds number (e.g. Butler & Farrell Reference Butler and Farrell1993; Schmid & Henningson Reference Schmid and Henningson2001). The lower energy of the straight rolls should also be related to the less-wavy streaks, as the straight rolls originates from a nonlinear interaction between the wavy streaks (i.e. the nonlinear mechanism of the streak instability). This observation is also consistent with the VWI asymptotic theory by Hall & Sherwin (Reference Hall and Sherwin2010), although the theory is not necessarily applicable to all the large-scale solutions found here (see supplementary material § 2.1 and Doohan et al. Reference Doohan, Willis and Hwang2019). In computing the small-scale solutions on the other hand, the smaller values of
 $E^{+}_{ws,s}$ and
 $E^{+}_{wr,s}$ would be more related to the fact that these solutions are not very far from the bifurcation points (figure 4). In such a regime, both upper- and lower-branch equilibrium solutions are well depicted only with single streamwise Fourier mode, which would lead to considerably reduced values of
 $E^{+}_{ws,s}$ and
 $E^{+}_{wr,s}$ (Pausch et al. Reference Pausch, Yang, Hwang and Eckhardt2019).
The inability of the invariant solutions to capture  $x^{+}$-dependent structures has a knock-on effect on the large- and small-scale energy balance equations (2.6) and (2.8). In particular, given that
 $\varPi ^{+}_{ul}$ and
 $\varPi ^{+}_{us}$ depend on
 $(u_l^{+})_{x^{+}}$ and
 $(u_s^{+})_{x^{+}}$, respectively (see supplementary material equations (1.5
 $a$) and (1.13
 $a$)), the large- and small-scale solutions exhibit negligible values of both large- and small-scale streamwise pressure strain in the
 $(-\varPi ^{+}_{ul}|_{0}^{120},-\varPi ^{+}_{us}|_{0}^{45})$ phase portrait in figure 5
 $(\,f)$ and are positioned at the origin (apart from
 $EQ_{L2b}$ (filled gold square)). As the role of the streamwise pressure strain terms is to re-distribute streamwise TKE to the wall-normal and spanwise components, this would also explain the weak wall-normal and spanwise velocity fluctuations observed in the root-mean-squared velocity profiles in supplementary material figures 2 and 3. Consequently, most of the large- and small-scale solutions are dominated by the streamwise velocity fluctuations. This also manifests in the
 $(-\epsilon ^{+}_{ul}|_{0}^{120},-\epsilon ^{+}_{us}|_{0}^{45})$ phase portrait in figure 5
 $(g)$ and the
 $(-\epsilon ^{+}_{vl}|_{0}^{120}-\epsilon ^{+}_{wl}|_{0}^{120},-\epsilon ^{+}_{vs}|_{0}^{45}-\epsilon ^{+}_{ws}|_{0}^{45})$ phase portrait in figure 5
 $(h)$. The large-scale solutions (squares) attain non-negligible values of large-scale streamwise dissipation and lie mostly along the abscissa (apart from
 $EQ_{L2b}$), while the small-scale solutions (triangles and circles) attain non-negligible values of small-scale streamwise dissipation and lie along the ordinate. However, the large- and small-scale solutions exhibit negligible values of both large- and small-scale wall-normal and spanwise dissipation, and are positioned at the origin again, because there is little wall-normal and spanwise TKE to dissipate.
Finally, the absence of structures at either large or small scale renders turbulent transport largely trivial. In the  $(E^{+}_{wu,i},-T^{+}_{u,\updownarrow }|_{5}^{25})$ phase portrait in figure 5
 $(i)$ for example, both large- and small-scale solutions feature negligible values of streamwise inter-scale turbulent transport and lie along the abscissa, apart from
 $EQ_{L1b}$ (filled black square) and
 $EQ_{L2b}$ (filled gold square), which are discussed in §§ 4.2 and 4.3 respectively.
4. Turbulent dynamics and invariant solutions
Thus far, a large number of invariant solutions have been obtained in a computational domain that can host coherent structures at two integral length scales. According to the dynamical systems description of turbulence (e.g. Kerswell Reference Kerswell2005; Eckhardt et al. Reference Eckhardt, Schneider, Hof and Westerweel2007; Kawahara et al. Reference Kawahara, Uhlmann and Van Veen2012; Graham & Floryan Reference Graham and Floryan2020), many upper-branch solutions have been found to be a good proxy for the turbulent state, at least for turbulence in spatially confined domains at transitional Reynolds numbers (i.e. flow in the minimal unit, e.g. Gibson et al. Reference Gibson, Halcrow and Cvitanovic2009; Cvitanovic & Gibson Reference Cvitanovic and Gibson2010; Chandler & Kerswell Reference Chandler and Kerswell2013; Willis et al. Reference Willis, Short and Cvitanović2016), in which the solutions provide a decent statistical/dynamical description of the flow characteristics. Similarly, in the minimal unit of multi-scale near-wall turbulence and with a relatively large number of travelling-wave solutions, one could envisage that the turbulent trajectory visits the upper-branch solutions at both large and small scales in the state space, especially because there is little scale separation. It would then be possible to define a suitable averaging between the large- and small-scale states for a quantitative statistical description of the flow. However, the phase portraits of the previous section, defined using a set of physically relevant observables, revealed that the turbulent trajectory does not visit the neighbourhood of any of the invariant solutions computed (figure 5), despite the fact that they are all obtained by suitable numerical continuation from the minimal unit of near-wall turbulence, in which a number of solutions (especially the upper-branch states) previously captured many features of the turbulent state (Doohan et al. Reference Doohan, Willis and Hwang2019).
The observation above presents a challenge in determining the structure of the state-space of turbulent flow at high Reynolds numbers. In particular, the phase portraits in figure 5 imply that the SSPs captured by the large- and small-scale invariant solutions are not sufficient for the description of multi-scale turbulence, even for relatively simple two-scale near-wall turbulence. This highlights the need to compute inherently multi-scale solutions that may structure the state space, and the importance of other inter- and intra-scale processes. Thus, exactly what physical processes are absent from the single-scale solutions? This shortcoming has been found to be intricately linked to several key scale interaction processes: (1) mean–fluctuation interaction; (2) energy cascade; (3) inverse energy transfer (i.e. the feeding process). In the remainder of this work, the aforementioned issues are discussed in detail.
4.1. Mean–fluctuation interaction
Most of the invariant solutions in the present study depict either large- or small-scale structures. It is therefore evident that one of the key processes not captured by the invariant solutions is their interaction. The most fundamental interaction between the two scales takes place through the mean velocity, and it can be explained by applying the velocity field decomposition in (2.3) to the mean momentum equation for invariant solutions:
 \begin{equation} \frac{{\rm d}\bar{U}^{+}}{{{\rm d} y}^{+}} - \overline{\langle u_l^{+}v_l^{+}\rangle}_{x^{+},z^{+}} - \overline{\langle u_s^{+}v_s^{+}\rangle}_{x^{+},z^{+}} = \varDelta^{+}. \end{equation}
Here, the wall shear rate  $\varDelta ^{+}$ varies with the solution, because the inner-scaling introduced in § 2.1 is based on the friction velocity of the mean turbulent state.
For the fully developed turbulent state, the mean shear is driven by both large and small scales, and at the same time, it is the only energy source at both scales (see (2.4) and (2.5) or (2.6) and (2.8)). In the absence of Reynolds shear stress at either large or small scale, the mean shear  $\textrm {d}\bar {U}^{+}/{\textrm {d}y}^{+}$ would diminish and there would be a subsequent reduction in production at the other scale, given their definitions in supplementary material equations (1.1) and (1.9). This would also account for the low wall shear rate values of the invariant solutions (i.e.
 $\varDelta ^{+}$) observed in figure 4 and table 2. Further to this, in the minimal unit of multi-scale near-wall turbulence, there exists a production mechanism at small scale driven by the energy cascade from the large scale (i.e. the driving of small-scale turbulent production in Doohan et al. Reference Doohan, Willis and Hwang2021). Therefore, in the absence of the large-scale structures, this process would not occur, which would also contribute to the lower values of wall shear rate of the small-scale invariant solutions.
It is worth mentioning that the mean–fluctuation interaction discussed here was the key modelling idea of the early work developed in the context of the so-called quasilinear approximation (Malkus Reference Malkus1956; Herring Reference Herring1963), where the fluctuation dynamics are simply modelled with the marginally stable linearised Navier–Stokes equations around the mean. A modern variant of this approach has shown that if the self-interacting nonlinear terms in (2.4) and (2.5) are modelled suitably at all integral length scales, the mean–fluctuation interaction plays a key role in characterising the general statistical behaviour of high-Reynolds-number turbulence (Hwang & Eckhardt Reference Hwang and Eckhardt2020; Skouloudis & Hwang Reference Skouloudis and Hwang2021). Among all the invariant solutions found in this study, it appears that only  $EQ_{L2b}$ contains healthy mean–fluctuation interaction at both large and small scales, as it exhibits non-zero production at both scales (filled gold square in figure 5c). Accordingly,
 $EQ_{L2b}$ appears to best resemble turbulent state, although this needs further discussion (§ 4.3).
4.2. Energy cascade
Another important feature of the turbulent state that is not captured by most of the invariant solutions is the energy cascade. With the exception of  $EQ_{L2b}$, to be discussed in § 4.3, none of the invariant solutions are approached by turbulent state in all phase portraits related to energy cascade and turbulent dissipation (figures 5f–5h). In particular, the streamwise pressure strain of these invariant solutions at both large and small scales is negligibly small (figure 5f), resulting in negligibly small wall-normal and spanwise dissipation (figure 5h). Furthermore, many large-scale solutions exhibit negligibly small dissipation at small scale (square symbols in figures 5g and 5h), indicating that they do not contain a proper mechanism for the energy cascade. A notable exception to this is
 $EQ_{L1b}$, the upper branch of a family of large-scale solutions (
 $EQ_{L1a}$/
 $EQ_{L1b}$), which appears to capture a transfer of streamwise TKE from large to small scales in figure 5(
 $i$). Although this solution has very little wall-normal and spanwise dissipation at small scale, a considerable amount of small-scale streamwise dissipation is present (filled black square in figure 5g).
To better understand the dissipation of the invariant solutions, the energy-cascade-related variables of  $EQ_{L1b}$ are visualised in figure 6, i.e. large- and small-scale streamwise velocity fluctuations, streamwise inter-scale turbulent transport at small scale
 \begin{equation} T^{+}_{us,c}={-}u_s^{+}\mathcal{P}_s\{\boldsymbol{u}^{+}_s\boldsymbol{\cdot}\boldsymbol{\nabla} u_l^{+} + \boldsymbol{u}^{+}_l\boldsymbol{\cdot}\boldsymbol{\nabla} u_s^{+} + \boldsymbol{u}^{+}_l\boldsymbol{\cdot}\boldsymbol{\nabla} u_l^{+}\}, \end{equation}
and small-scale streamwise dissipation
 \begin{equation} \epsilon^{+}_{us,\square}={-}\boldsymbol{\nabla} u_s^{+}\boldsymbol{\cdot}\boldsymbol{\nabla} u_s^{+}. \end{equation}
The streamwise inter-scale turbulent transport and small-scale dissipation isosurfaces are unusually elongated in the streamwise direction; these are also localised around the low-speed large-scale streak (figure 6 $a$) as observed in Doohan et al. (Reference Doohan, Willis and Hwang2021). This streamwise inter-scale turbulent transport appears to generate intense small-scale streamwise velocity fluctuations (
 $u_s^{+}$) in the same region, as seen in figure 6(
 $b$), which explains the large value of
 $E^{+}_{ss,s}$ observed in figure 5
 $(a)$ (filled black square). This is also consistent with the negligibly small production at small scale,
 $P^{+}_{us}|_{0}^{45}$ of
 $EQ_{L1b}$ (filled black square in figure 5
 $c$), indicating that
 $EQ_{L1b}$ captures a particular scale interaction process resulting in the transfer of energy within the streamwise velocity component.
Flow field of energy cascade in  $EQ_{L1b}$:
 $(a)$ isosurfaces of
 $u_l^{+}=\pm 3.00$ (pink/cyan),
 $T^{+}_{us,c}=0.15$ (black) and
 $\epsilon _{us,\square }^{+}=-0.10$ (blue);
 $(b)$ isosurfaces of
 $T^{+}_{us,c}=0.15$ (black),
 $u_s^{+}=2.25$ (yellow) and
 $u_s^{+}=-3.00$ (green).

The energy cascade and dissipation mechanism of  $EQ_{L1b}$, however, appears to be very different from that of the turbulent state. Figure 7 compares the streamwise dissipation,
 \begin{equation} \epsilon_{u,\square}'^{+}={-}\boldsymbol{\nabla} u'^{+}\boldsymbol{\cdot}\boldsymbol{\nabla} u'^{+}, \end{equation}
of two invariant solutions  $EQ_{L1a}$ and
 $EQ_{L1b}$ with that of turbulent state. Both of the invariant solutions have highly elongated dissipation structures with very little downstream undulation, in accordance with the observation in figure 6, whereas the dissipation structures of the turbulent state are much more isotropic and chaotic. These highly anisotropic dissipation structures are a general feature of the invariant solutions except for
 $EQ_{L2b}$, as indicated by the phase portraits of streamwise pressure strain (figure 5
 $f$) and wall-normal and spanwise dissipations (figure 5
 $h$). Therefore, this implies that these invariant solutions do not exhibit the mechanism of turbulent dissipation related to isotropic smaller-scale structures (Kolmogorov Reference Kolmogorov1941).
Isosurfaces of  $u'^{+}$ (cyan) and
 $\epsilon _{u,\square }^{'+}$ (blue) of
 $(a)$
 $EQ_{L1a}$,
 $u'^{+}=-2.50$,
 $\epsilon _{u,\square }^{'+}=-0.01$;
 $(b)$
 $EQ_{L1b}$,
 $u'^{+}=-3.50$,
 $\epsilon _{u,\square }^{'+}=-0.04$;
 $(c)$ a turbulent snapshot,
 $u'^{+}=-3.00$,
 $\epsilon _{u,\square }^{'+}=-0.04$. Here,
 $\epsilon _{u,\square }^{'+}= -\boldsymbol {\nabla } u'^{+} \boldsymbol{\cdot} \boldsymbol {\nabla } u'^{+}$.

The precise origin of this difference can be explained using a quasilinear approximation (e.g. Thomas et al. Reference Thomas, Lieu, Jovanovic, Farrell, Ioannou and Gayme2014; Farrell et al. Reference Farrell, Ioannou, Jiménez, Constantinou, Lozano-Durán and Nikolaidis2016; Hernandez & Hwang Reference Hernandez and Hwang2021), which has been found to offer a good reduced theoretical description for many equilibrium-type invariant solutions (Pausch et al. Reference Pausch, Yang, Hwang and Eckhardt2019). We now decompose the velocity fluctuation into the streamwise mean and the rest, i.e.  $\boldsymbol {u}'^{+}=\boldsymbol {u}^{+}_1+\boldsymbol {u}^{+}_2$ where
 $\boldsymbol {u}^{+}_1=\langle \boldsymbol {u}'^{+} \rangle _{x^{+}}$. If the invariant solutions of interest are in the form of travelling waves with a constant
 $c_x^{+}$ (i.e. a relative equilibrium solution), the resulting equations of motion are written as
 \begin{align} (\boldsymbol{\bar{U}}^{+}\boldsymbol{\cdot}\boldsymbol{\nabla})\boldsymbol{u}^{+}_1 &={-}(\boldsymbol{u}^{+}_1\boldsymbol{\cdot}\boldsymbol{\nabla})\boldsymbol{\bar{U}}^{+} -\boldsymbol{\nabla} p^{+}_1+\nabla^{2}\boldsymbol{u}^{+}_1 -(\boldsymbol{u}^{+}_1\boldsymbol{\cdot}\boldsymbol{\nabla})\boldsymbol{u}^{+}_1 -\langle(\boldsymbol{u}^{+}_2\boldsymbol{\cdot}\boldsymbol{\nabla})\boldsymbol{u}^{+}_2\rangle_{x^{+}} \nonumber\\ &\quad +\langle\overline{(\boldsymbol{u}^{+}_1\boldsymbol{\cdot}\boldsymbol{\nabla}) \boldsymbol{u}^{+}_1+(\boldsymbol{u}^{+}_1\boldsymbol{\cdot}\boldsymbol{\nabla}) \boldsymbol{u}^{+}_2+(\boldsymbol{u}^{+}_2\boldsymbol{\cdot}\boldsymbol{\nabla}) \boldsymbol{u}^{+}_1+(\boldsymbol{u}^{+}_2\boldsymbol{\cdot}\boldsymbol{\nabla}) \boldsymbol{u}^{+}_2}\rangle_{x^{+},z^{+}}, \end{align}
 \begin{align} &-c_x^{+}\frac{\partial \boldsymbol{u}^{+}_2}{\partial x^{+}} +[(\boldsymbol{\bar{U}}^{+}+\boldsymbol{u}^{+}_1)\boldsymbol{\cdot}\boldsymbol{\nabla}]\boldsymbol{u}^{+}_2 +(\boldsymbol{u}^{+}_2\boldsymbol{\cdot}\boldsymbol{\nabla})(\boldsymbol{\bar{U}}^{+}+\boldsymbol{u}^{+}_1)={-}\boldsymbol{\nabla}p^{+}_2 +\nabla^{2}\boldsymbol{u}^{+}_2+\mathcal{N} \end{align}
with
 \begin{equation} \mathcal{N}={-}(\boldsymbol{u}^{+}_2\boldsymbol{\cdot}\boldsymbol{\nabla}) \boldsymbol{u}^{+}_2+\langle(\boldsymbol{u}^{+}_2\boldsymbol{\cdot}\boldsymbol{\nabla}) \boldsymbol{u}^{+}_2\rangle_{x^{+}}. \end{equation}
Here, (4.4a) offers a description of the streamwise independent streaks and rolls (or vortices), whereas (4.4b) is for the instability wave arising from the streaks. In the quasilinear approximation (Pausch et al. Reference Pausch, Yang, Hwang and Eckhardt2019),  $\mathcal {N}$ is ignored, resulting in (4.4b) being a linearised equation about a streaky base flow (i.e.
 $\boldsymbol {\bar {U}}^{+}+\boldsymbol {u}^{+}_1$). In this case, the non-trivial solution of (4.4b) is obtained from a marginally stable eigenmode. Lastly, in the limit of large computational domain (or equivalently in the limit of large ‘effective’ Reynolds number; see Doohan et al. Reference Doohan, Willis and Hwang2019), many solutions described by (4.4) can be approximated by VWI theory (Hall & Sherwin Reference Hall and Sherwin2010), where the last term in (4.4a) is modelled as a forcing along the critical layer of (4.4b). Among the invariant solutions found in this study,
 $EQ_{L1a}$,
 $EQ_{L2a}$,
 $EQ_{L3a}$ and
 $EQ_{L4a}$ have previously been shown to follow the VWI description in the limit of large computational domain (see supplementary material § 2.1 and Doohan et al. Reference Doohan, Willis and Hwang2019).
Now, (4.4) suggests that the key difference between many of the invariant solutions and the turbulent state obviously lies in the importance of  $\mathcal {N}$ in (4.4b): for the invariant solutions, it is either small or sometimes negligible, whereas for the turbulent state, it is probably non-negligibly large most of the time. The nonlinear term
 $\mathcal {N}$ is essentially an interaction between streamwise waves. Therefore, this must be the mechanism of the energy transfer from long streamwise wavelengths to short ones, explaining the difference in the extent of streamwise undulation between the invariant solutions and the turbulent state. Indeed, it has been found that the removal of this term in direct numerical simulation of homogeneous shear turbulence leads to almost complete suppression of the energy cascade in the streamwise direction, resulting in highly anistropic small-scale dissipative structures (Hernandez & Hwang Reference Hernandez and Hwang2021), consistent with the phase portraits of pressure strain and dissipation in figure 5.
Despite the evident difference in the energy cascade and turbulent dissipation, it must be pointed out that both the invariant solutions and the turbulent state share the same production term in (4.4b) (i.e. the third term). In fact, in the inviscid limit, (4.4b) with  $\mathcal {N}=0$ becomes singular in the critical layer (Hall & Horseman Reference Hall and Horseman1991), i.e. the layer at which
 $\langle u^{+}\rangle _{x^{+}}=c_x^{+}$. Therefore, the dissipation of the invariant solutions is expected to be organised around the critical layer, as is indeed confirmed by the cross-streamwise view of streamwise dissipation in figures 8(a) and 8(b) (note that the relatively strong streamwise dissipation in figure 8(a) is organised around the critical layer at the flank of the low-speed streak, whereas that in figure 8(b) appears just above the high-speed streaks and in the near-wall region of the low-speed streak similar to the turbulent state). However, it is striking that a very similar feature is also observed for the turbulent state, as shown in figures 8(c)–8(e) (note that a critical layer cannot be defined in this case, thus an appropriate constant streamwise velocity for large-scale structures (
 $u^{+}=13$) is chosen to mimic the critical layer). This suggests that the dissipation process of the turbulent state is presumably initiated by such a layer related to the streak instability, confirming the strong dynamical correlation between the streak instability and turbulent dissipation observed in Doohan et al. (Reference Doohan, Willis and Hwang2021). It would be interesting to see whether this behaviour persists at high Reynolds numbers, and this remains an open question to be explored in the future.
Isocontours of  $\langle \epsilon _{u,\square }^{'+}\rangle _{x^{+}}$ (blue) and
 $\langle u^{+}\rangle _{x^{+}}=c_x^{+}$ (black line) of
 $(a)$
 $EQ_{L1a}$ and
 $(b)$
 $EQ_{L1b}$. (c)–(e) Isocontours of
 $\epsilon _{u,\square }^{'+}$ (blue) and
 $u^{+}=13$ (black line) of three turbulent snapshots in time.

Finally, it should be mentioned that the role of the unsteady term, not shown in (4.4), must not be ignored. There is a body of evidence that the unsteadiness and intermittency in the flow play a crucial role in the mechanism of the energy cascade (e.g. see the review by Vassilicos (Reference Vassilicos2015), and the references therein). Figure 9 shows a time series of turbulence production at large scale, turbulent transport and dissipation at large and small scale reproduced from the simulation of Doohan et al. (Reference Doohan, Willis and Hwang2021). It appears that the observables related to the energy cascade fluctuate with strong intermittent behaviour. The most prominent dissipation events, which occur following strong production events, would be related to the generation of highly isotropic small-scale structures from the energy cascade of the turbulent state. Indeed, it has recently been shown that the dissipation event in wall-bounded turbulence is strongly correlated with streak breakdown, the process ensuing the streak instability (Doohan et al. Reference Doohan, Willis and Hwang2021). Having unsteadiness in (4.4b) would allow its instability to grow further from the marginally stable state and the growth could then be slowed down by the nonlinear term  $\mathcal {N}$, which mediates the energy cascade in the streamwise wavenumber space. In this respect, periodic orbits embedded in the turbulent state could offer a better description of the energy cascade and dissipation, although their computation appears to be challenging in the minimal unit of the multi-scale near-wall turbulence as has been discussed (see also § 5 for a further discussion). However, if they are computable, they should provide a much better representation of the turbulent dynamics, as has been demonstrated for simpler cases (Cvitanovic & Gibson Reference Cvitanovic and Gibson2010; Chandler & Kerswell Reference Chandler and Kerswell2013; Willis et al. Reference Willis, Short and Cvitanović2016). Such periodic orbits could subsequently be used to approximate the full statistical and dynamical behaviour through the cycle expansion (e.g. Cvitanovic et al. Reference Cvitanovic, Artuso, Mainieri, Tanner, Vattay, Whelan and Wirzba2005; Chandler & Kerswell Reference Chandler and Kerswell2013), although the applicability of this technique to high-Reynolds-number turbulence remains an open question from both theoretical and technical perspectives.
Time series of  $(a)$
 $P^{+}_{ul}|_{0}^{120}$ (red) and
 $\epsilon ^{+}_{ul}|_{0}^{120}$ (blue), and
 $(b)$
 $P^{+}_{ul}|_{0}^{120}$ (red),
 $T^{+}_{u,\updownarrow }|_{45}^{120}$ (black) and
 $\epsilon ^{+}_{us}|_{45}^{120}$ (blue).

4.3. Inverse energy transfer: feeding
Now, we discuss the solution  $EQ_{L2b}$, whose behaviour has been found to be quite different from the other solutions in the various phase portraits (figure 5). It has been observed that
 $EQ_{L2b}$ is the only invariant solution that captures substantial turbulent production at both large and small scales (figure 5c). Furthermore, it is the only solution that exhibits a wall shear rate greater than that of the turbulent mean at
 $\varDelta ^{+}\approx 1.03$ and it is the most unstable solution, with a
 $69$-dimensional unstable manifold (see table 2).
The solution  $EQ_{L2b}$ clearly reproduces most elements of the small-scale SSP, including small-scale straight rolls
 $E^{+}_{sr,s}$, straight streaks
 $E^{+}_{ss,s}$, wavy streaks
 $E^{+}_{ws,s}$ and wavy rolls
 $E^{+}_{wr,s}$ (figure 5). However, it features negligible values of both
 $E^{+}_{ss,l}$ and
 $E^{+}_{sr,l}$ and so it does not capture the key flow structures involved in the large-scale SSP at all, even though it attains a significant value of large-scale turbulent production
 $P^{+}_{ul}|_{0}^{120}$. Instead, the large-scale structures detected in
 $EQ_{L2b}$ appear to be
 $x^{+}$-dependent, thus the solution exhibits considerable values of both
 $E^{+}_{ws,l}$ and
 $E^{+}_{wr,l}$. The co-existence of the SSP at small scale and highly
 $x^{+}$-dependent structures at large scale is reminiscent of the inverse energy transfer from small to large scales (i.e. the feeding process), which has been discussed extensively in Doohan et al. (Reference Doohan, Willis and Hwang2021). We note that this process is associated with a ‘net’ inverse energy transfer in the region close to the wall and differs from the ‘backscatter’, which refers to the instantaneous inverse energy transfer in the energy cascade.
In order to compare  $EQ_{L2b}$ to the feeding scale interaction process in the region close to the wall, the
 $(E^{+}_{wu,i},-T^{+}_{u,\updownarrow }|_{5}^{25})$ phase portrait is plotted in figure 5(i), where
 $-T^{+}_{u,\updownarrow }|_{5}^{25}$ is streamwise inter-scale turbulent transport defined in (2.11a) and
 $E^{+}_{wu,i}$ is the near-wall kinetic energy of wavy streamwise inactive motion defined in (2.15). Along the turbulent trajectory,
 $-T^{+}_{u,\updownarrow }|_{5}^{25}$ fluctuates about zero, where positive values represent the transfer of energy from small to large scales (streamwise feeding) and negative values represent the transfer of energy from large to small scales (the streamwise energy cascade). On average, the streamwise inter-scale turbulent transport term is positive over the interval
 $y^{+}\in [5,25]$, as seen in the statistical analysis in figure 2(d). In particular,
 $EQ_{L2b}$ (filled gold square) exhibits substantial positive values of both
 $-T^{+}_{u,\updownarrow }|_{5}^{25}$ and
 $E^{+}_{wu,i}$ and is positioned in the first quadrant, confirming that it indeed captures the transfer of energy from small to large scales and the resulting localised streamwise inactive motion at large scale, i.e. a streamwise feeding event.
In order to examine the streamwise feeding event captured by  $EQ_{L2b}$, the velocity field is shown in figure 10(a). The isosurfaces of low-speed small-scale streaks
 $u_s^{+}=-2.50$ are shown in orange, large-scale streamwise turbulent transport
 $T^{+}_{ul,f}=0.25$ in black and high- and low-speed large-scale streaks
 $u_l^{+}=\pm 3.20$ in pink and cyan, respectively. Here, the large-scale streamwise turbulent transport (i.e. turbulent transport from small to large scale in the streamwise component at large scale) is defined as
 \begin{equation} T^{+}_{ul,f}={-}u_l^{+}\mathcal{P}_l\{\boldsymbol{u}^{+}_l\boldsymbol{\cdot}\boldsymbol{\nabla} u_s^{+} + \boldsymbol{u}^{+}_s\boldsymbol{\cdot}\boldsymbol{\nabla} u_l^{+} + \boldsymbol{u}^{+}_s\boldsymbol{\cdot}\boldsymbol{\nabla} u_s^{+}\}, \end{equation}
and the wall-normal range of the visualisation is  $y^{+}\in [0,45]$. Near the wall, the solution exhibits meandering small-scale streaks, a manifestation of the small-scale SSP as mentioned previously. The isosurfaces of large-scale streamwise turbulent transport appear in between the low-speed small-scale streaks and are localised in both the streamwise and spanwise directions. This is similar to the snapshots of streamwise feeding events in figure 23 of Doohan et al. (Reference Doohan, Willis and Hwang2021). The turbulent transport isosurfaces are well aligned with the large-scale streaks and are also highly localised. In particular, the streamwise turbulent transport contributes almost entirely to the high-speed large-scale streaks, consistent with the streamwise feeding event in figure 21 of Doohan et al. (Reference Doohan, Willis and Hwang2021) and the POD analysis in figure 24 of that work.
Solution  $EQ_{L2b}$:
 $(a)$ isosurfaces of
 $u_s^{+}=-2.50$ (orange),
 $T^{+}_{ul,f}=0.25$ (black) and
 $u_l^{+}=\pm 3.20$ (pink/cyan);
 $(b)$ positive/negative isocontours of
 $u'^{+}$ (red/blue) and positive isocontours of
 $T^{+}_{ul,f}$ (black) at
 $y^{+}\approx 10$;
 $(c)$ isosurfaces of
 $P^{+}_{us,\square }=0.30$ (yellow),
 $T^{+}_{ul,f}=0.25$ (black) and
 $P^{+}_{ul,\square }=0.20$ (red).

The streamwise velocity field  $u'^{+}$ and large-scale streamwise turbulent transport
 $T^{+}_{ul,f}$ at
 $y^{+}\approx 10$ are also plotted in figure 10(b). The isocontours of the high- and low-speed streaks are shown in red and blue, respectively, and positive large-scale streamwise turbulent transport in black. It is immediately obvious that
 $EQ_{L2b}$ captures the subharmonic sinuous streak instability mode (Schoppa & Hussain Reference Schoppa and Hussain2002) with mirror-symmetric high- and low-speed streaks, strikingly similar to that identified in the POD analysis in figure 24 of Doohan et al. (Reference Doohan, Willis and Hwang2021). Given its mathematical definition (i.e. an instability mode, the spanwise wavelength of which is twice greater than the spanwise spacing of the base-flow streaks), the emergence of a ‘subharmonic’ streak instability mode in
 $EQ_{L2b}$ explains why this solution exhibits an energy transfer from small to large scale. In addition, as before, the localised streamwise turbulent transport isocontours match up with the high-speed streaks, indicating that the streamwise feeding process emanates from high-speed small-scale streaks and favours the formation of high-speed large-scale streaks, as seen in figure 10(a).
All these observations are entirely consistent with the analysis in Doohan et al. (Reference Doohan, Willis and Hwang2021) and so it is clear that  $EQ_{L2b}$ is representative of a streamwise feeding event. In addition, the subharmonic sinuous streak instability mode appears to underpin the manifestation of small-scale SSP in this case. However, the feeding of energy from small to large scales captured by
 $EQ_{L2b}$ does not fully explain the considerable values of both large- and small-scale turbulent production it exhibits in figure 5(c). While small-scale production reflects the presence of the small-scale SSP mentioned previously, the appearance of large-scale production in the absence of the large-scale SSP is not obvious. Indeed, in the analysis of the feeding processes in Doohan et al. (Reference Doohan, Willis and Hwang2021), there was no observed increase in large-scale production in response to streamwise turbulent transport from small to large scales.
In order to investigate the two-scale energetics of  $EQ_{L2b}$ in more detail, the velocity field is shown again in figure 10(c). The isosurfaces of small-scale turbulent production
 $P^{+}_{us,\square }=0.30$ are shown in yellow, large-scale streamwise turbulent transport
 $T^{+}_{ul,f}=0.25$ in black and large-scale turbulent production
 $P^{+}_{ul,\square }=0.20$ in red. Here, the large- and small-scale turbulent production terms are defined as
 $$\begin{gather} P^{+}_{ul,\square}={-}U^{+}_{y^{+}}u_l^{+}v_l^{+}, \end{gather}$$
 $$\begin{gather}P^{+}_{us,\square}={-}U^{+}_{y^{+}}u_s^{+}v_s^{+}. \end{gather}$$
and the streamwise turbulent transport isosurfaces are identical to those plotted in figure 10(a). The small-scale production isosurfaces meander slightly in the streamwise direction and match up with the small-scale streaks, corresponding to the small-scale SSP. On the other hand, the large-scale production isosurfaces are localised in both the streamwise and spanwise directions, consistent with the highly localised large-scale streaks. In particular, the large-scale production isosurfaces are well aligned with the streamwise turbulent transport isosurfaces. This appears to suggest that the streamwise TKE transferred from small to large scales is substantial enough to be acted upon by the mean shear and consequently that the streamwise feeding process can indeed modulate localised large-scale turbulent production. Therefore, the two-scale energetics of  $EQ_{L2b}$ are composed of the small-scale SSP, the feeding of streamwise TKE from small to large scales and the resulting localised large-scale turbulent production and streaks, all of which are supported by the subharmonic sinuous streak instability mode.
As mentioned earlier, the large-scale production seen in  $EQ_{L2b}$ was not identified in our recent analysis of turbulent state (Doohan et al. Reference Doohan, Willis and Hwang2021), revealing some seemingly non-trivial inconsistency between
 $EQ_{L2b}$ and turbulent state. It is, however, worth mentioning that the turbulent state contains the SSP at large scale as a production mechanism, whereas
 $EQ_{L2b}$ does not. Therefore, this inconsistency suggests that the SSP at large scale might have suppressed the production mechanism driven by the feeding event, although this needs further investigation and is beyond the scope of the present study.
5. Conclusion and discussion
In the present study, the state space of the minimal unit of multi-scale near-wall turbulence (i.e. two integral length scales of motion) has been explored through the computation of the edge state, 26 travelling wave solutions and 2 periodic orbits. Given the similar size of the two scales, it seemed reasonable that the turbulent trajectory may visit some of these solutions at both large and small scales, so that a suitable average of the solutions could then be defined for a quantitative description of turbulent state, as in the minimal flow unit. However, the phase portrait visualisations using a set of suitably defined observables for the two-scale dynamics has revealed that the turbulent state does not approach any of the computed invariant solutions, despite their considerable number. We conjecture that inherently multi-scale solutions are necessary, even for this simplest model of multi-scale turbulence. This observation is reminiscent of the work by Kerswell & Tutty (Reference Kerswell and Tutty2007), who found that the turbulent trajectory does not spend a significant amount of time near the travelling waves that were known at the time. This eventually led to many subsequent studies in the search for periodic orbits for the description of the dynamics of the turbulent state (e.g. Cvitanovic & Gibson Reference Cvitanovic and Gibson2010; Chandler & Kerswell Reference Chandler and Kerswell2013; Willis et al. Reference Willis, Short and Cvitanović2016). In this study, the limitations of such simple travelling-wave solutions are more evidently revealed. The invariant solutions presented in § 3 (see also supplementary material § 2) fail to reproduce both the intra-scale and inter-scale energetics:  $EQ_{L2a}$ and the small-scale solutions only capture the small-scale SSP, whereas the remaining large-scale solutions only capture the large-scale SSP. At both large and small scales, the wavy streaks and wavy rolls of the SSP are significantly weaker, which in turn inhibits the streamwise pressure strain in redistributing streamwise TKE to the wall-normal and spanwise components, and so the solutions are almost entirely dominated by streamwise velocity fluctuations. In addition, in the absence of structures at either large or small scale, the turbulent transport terms are largely trivial and so the scale interaction processes are obstructed. Although it is expected that the edge state, the VWI states and the small-scale solutions would not fully capture the turbulent dynamics, it is interesting to observe that the upper-branch solutions perform unsuccessfully. In particular,
 $EQ_{L1b}$, which is the stress-driven analogue of Nagata's upper-branch solution (Nagata Reference Nagata1990), is typically representative of the mean turbulent state in the minimal unit (Doohan et al. Reference Doohan, Willis and Hwang2019) and yet it is positioned at the origin in multiple phase portraits considered in figure 5. Accounting for all the observations, we conjecture here that the state space representation of invariant solutions featuring only single-scale dynamics is insufficient for near-wall turbulence with multiple integral length scales of motion, even though the numerical set-up of this study only captures two length scales.
Among the computed solutions, we have shown that  $EQ_{L2b}$ is a two-scale invariant solution of wall-bounded shear flow that captures a scale interaction process, namely the feeding of energy from small to large scales recently discovered by Doohan et al. (Reference Doohan, Willis and Hwang2021). Given the non-zero production at large scale, this is a two-scale solution, the behaviour of which essentially originates from a subharmonic sinuous instability of the small-scale streaks. It should, however, be mentioned that this is not the first invariant solution that features the subharmonic sinuous instability mode. The solutions of Itano & Generalis (Reference Itano and Generalis2009), identical to
 $EQ_7/EQ_8$ in Gibson et al. (Reference Gibson, Halcrow and Cvitanovic2009), the hairpin-like solution of Shekar & Graham (Reference Shekar and Graham2018) in plane Poiseulle flow and the solution presented in Deguchi & Hall (Reference Deguchi and Hall2014a) and Deguchi & Hall (Reference Deguchi and Hall2017) for the asymptotic suction boundary layer also exhibit a subharmonic sinuous instability like
 $EQ_{L2b}$ in the present study. In this respect, the contribution of the present study lies in the identification of the physical processes that such invariant solutions describe with a rigorous examination of the scale-interaction dynamics of the turbulent state (Doohan et al. Reference Doohan, Willis and Hwang2021). It is also worth pointing out that all these solutions have often been related to the hairpin vortex dynamics proposed by Adrian (Reference Adrian2007), and, interestingly, the same flow structure was also observed in the study of the nonlinear optimal growth for turbulent channel flow at low Reynolds numbers (Farano et al. Reference Farano, Cherubini, Robinet and De Palma2017). The analysis here and in Doohan et al. (Reference Doohan, Willis and Hwang2021), however, suggests that the solutions and/or the flow fields of this type would be more precisely related to the energy transfer from small to large scale through the feeding process.
The unsuccessful dynamical systems description of near-wall turbulence with two integral length scales of motion can essentially be attributed to the lack of multi-scale invariant solutions, the computation of which is significantly more challenging. All invariant solutions presented here, apart from  $PO_{S0a}$ and
 $PO_{S0b}$, are equilibrium solutions, in which the structures of a particular length scale propagate through the flow domain with constant phase speed. This is a severe restriction for a multi-scale solution, where, critically, the mean advection velocity of turbulent fluctuations varies with both the distance from the wall and the streamwise and spanwise wavelengths (i.e. the Taylor's hypothesis; see also del Álamo & Jiménez Reference del Álamo and Jiménez2009). It is highly unlikely that the structures at each integral length scale in such a multi-scale solution would naturally propagate with the same phase speed (see also the range of values in table 2). Therefore, the expected form for a multi-scale invariant solution in the present two-scale system would be a periodic (or quasi-periodic) orbit, and equilibrium solutions more naturally capture structures at a single integral length scale. Accordingly, to the best of the authors’ knowledge, the only multi-scale solution yet discovered is of Rayleigh–Bénard convection (Motoki et al. Reference Motoki, Kawahara and Shimizu2021), in which there is no mean advection.
In this regard, the approach to computing solutions in this study can be criticised to certain extent: both the large- and small-scale solutions presented here are obtained through numerical continuation of equilibrium solutions from the minimal unit. In particular, the continuation of the large-scale solutions from  $\varOmega _1$ to
 $\varOmega _2$ leads to little development of small-scale structures and the concatenation of the small-scale solutions explicitly suppresses large-scale structures. However, there is no robust approach to computing multi-scale solutions. As mentioned in § 3.1, several initial conditions generated by the superposition of some large- and small-scale solutions have been tried in the hope of computing a multi-scale invariant solutions, but this effort has been unsuccessful. Furthermore, given the large Lyapunov exponent expected from the multi-scale turbulent state (i.e. flow at high Reynolds numbers), it is unlikely that any initial condition taken directly from the turbulent trajectory would easily converge, let alone to a solution with two integral length scales of motion.
The role of symmetry reduction in the computation of multi-scale invariant solutions should also be addressed. Flow symmetries such as the shift-reflect symmetry (3.2) are often imposed in order to reduce the dimensionality of the turbulent state space and to aid in the computation of solutions. However, the symmetry imposed must also be consistent with the flow physics, for example the shift-reflect symmetry captures the sinuous streak instability mode: the dominant streak breakdown mechanism of the SSP (Hamilton et al. Reference Hamilton, Kim and Waleffe1995; Cassinelli et al. Reference Cassinelli, de Giovanetti and Hwang2017; de Giovanetti et al. Reference de Giovanetti, Sung and Hwang2017). The identification of a flow symmetry that is relevant to multi-scale near-wall turbulence is particularly difficult, if not impossible, and even in the minimal unit of multi-scale near-wall turbulence, the solutions representing the large- and small-scale SSPs exhibit different symmetry shifts (§ 3.1) and the feeding from small to large scales is associated with the mirror-symmetric subharmonic sinuous streak instability mode. Notwithstanding the great difficulties involved, the applicability of the notion of the state space in the dynamical systems framework to multi-scale wall-bounded turbulence will in future rely on the computation of asymmetric multi-scale periodic orbits.
It should be stressed that the discussion here does not preclude the existence of multi-scale invariant solutions in shear flows. Such a solution may well exist, as has been proposed recently in an asymptotic theory (Hall Reference Hall2018; Blackburn, Deguchi & Hall Reference Blackburn, Deguchi and Hall2021). Here, we only point out that the computation of such a multi-scale invariant solution from the full Navier–Stokes equations is computationally very difficult with the methods available, even in this simple two-scale system, due to vanishing recurrences and large leading Lyapunov exponents. The difficulties expected in the computation of multi-scale invariant solutions directly relevant to the turbulent state certainly present an important challenge to the description of fully developed turbulence from a dynamical systems perspective. However, it is worth mentioning that invariant solutions have played a central role in illuminating the precise mechanisms of transition, together with recent statistical-mechanics-based approaches (see Avila et al. (Reference Avila, Moxey, de Lozar, Avila, Barkley and Hof2011), Barkley (Reference Barkley2016) and the references therein). From the perspective of turbulence research, the true value of invariant solutions perhaps lies in the fact that they are exact solutions to the Navier–Stokes equations. Therefore, they contain ‘precise dynamical information’ that can be analysed with the Navier–Stokes equations in a completely ‘deterministic’ manner and the present study is one such example that demonstrates this. Once some physically relevant invariant solutions are found, they provide significant benefit over the flow fields obtained by various conditional averaging and/or simple flow visualisations. Indeed, the ambiguity created by statistical averaging and the arbitrary interpretation of visualised flow fields have blurred the precise physical mechanisms underpinned by the governing equations, and this has often been a starting point of some long-standing and non-trivial debates (e.g. the existence and dynamical relevance of hairpin vortices). In this respect, the computation of invariant solutions of the Navier–Stokes equations has provided valuable physical insight into the precise clockwork of turbulence without creating such ambiguity. It is therefore important to find a way to overcome and/or bypass the difficulty in the computation of multi-scale invariant solutions for high-Reynolds-number turbulence.
In this regard, it is finally worth pointing out that many known invariant solutions are often computed from highly simplified systems rather than the full system: for example, the solutions in the minimal unit (e.g. Waleffe Reference Waleffe1998; Jiménez & Simens Reference Jiménez and Simens2001; Kawahara & Kida Reference Kawahara and Kida2001; Gibson et al. Reference Gibson, Halcrow and Cvitanovic2009; Willis et al. Reference Willis, Short and Cvitanović2016; Doohan et al. Reference Doohan, Willis and Hwang2019), the large-scale and self-similar solutions with an eddy viscosity model for turbulent dissipation (e.g. Rawat et al. Reference Rawat, Cossu, Hwang and Rincon2015; Hwang et al. Reference Hwang, Willis and Cossu2016; Yang et al. Reference Yang, Willis and Hwang2019) and the time-periodic solution for a simplified energy cascade (van Veen et al. Reference van Veen, Vela-Martín and Kawahara2019). Before computing invariant solutions, each of these studies have first devised a system with a drastically reduced number of degrees of freedom, but without losing the key dynamics of interest. In a similar vein, the key to overcoming this challenge may lie in the development of a robust reduced-order model that can capture the scale interaction dynamics as currently understood. A similar effort was, in fact, attempted in the 1980s (e.g. Aubry et al. Reference Aubry, Holmes, Lumley and Stone1988). Given modern computing power and the emergence of novel data-driven techniques, it is now timely to develop a robust reduced-order model that faithfully describes the dynamics of fully developed turbulence. Once such a reduced-order model is available, the concepts of dynamical systems theory such as invariant solutions could be applied, and may overcome the challenges identified in this work. Our on-going effort is also currently being made in this direction (Khoo, Chan & Hwang Reference Khoo, Chan and Hwang2021).
Supplementary material
Supplementary material is available at https://doi.org/10.1017/jfm.2022.686.
Funding
This work was supported by the European Office of Aerospace Research and Development (EOARD) (FA9550-19-1-7021; Program Manager: Dr D. Smith). Y.H. also gratefully acknowledges the financial support of the Leverhulme Trust (RPG-2019-123) and the Engineering and Physical Sciences Research Council (EPSRC; EP/T009365/1) in the UK. Q.Y. acknowledges the Natural Science Foundation of China (11802322).
Declaration of interests
The authors report no conflict of interest.