Background
Bloodstream infections are a leading cause of high-acuity presentations to emergency departments (EDs),Reference Goto and Al-Hasan1 and blood cultures are essential for pathogen-specific therapy and antimicrobial stewardship. However, the incidence of true positive blood cultures in the ED is only 1.4–12.2%, with positive results impacting treatment decisions only 0.18–2.8% of the time.Reference Schinkel, Boerman and Bennis2,Reference Mountain, Bailey, O’Brien and Jelinek3 When cultures return negative, these results also rarely alter the initial treatment course; treatment decisions using empiric antibiotic guidelines are usually made in the ED before culture results are available.Reference Girón-Ortega JA, Fernández-Guerrero and De Oca Arjona4
Timely antimicrobial administration and performing blood cultures prior to that are quality measures in many centers, potentially leading to unnecessary blood cultures. Inappropriate blood cultures done in the ED have downstream consequences; blood culture contamination rates are higher when done in the ED, and are associated with a prolonged length of stay, inappropriate antibiotic use, bacterial resistance, and premature removal of indwelling lines.Reference Fabre, Klein and Salinas5–Reference Bates, Goldman and Lee7 Beyond direct costs, over-ordering perpetuates a culture of diagnostic inertia: patients with negative blood cultures frequently continue empiric antimicrobial therapy without reassessment, with one prospective multicentre cohort reporting inappropriate antibiotic treatment in 40% of culture-negative patients at 48 hours.Reference Girón-Ortega JA, Fernández-Guerrero and De Oca Arjona4
Previous diagnostic stewardship efforts to develop blood culture decision rules have produced scores with good predictive performance, including the Shapiro Score (area under curve (AUC) 0.68),Reference Quintero Montealegre, Flórez Monroy and Garzón Herazo8,Reference Shapiro, Wolfe, Wright, Moore and Bates9 the ID-Bacter Score (AUC 0.74),Reference Quintero Montealegre, Flórez Monroy and Garzón Herazo8 and the BAROC Score (AUC 0.76).Reference Pehlivan, Douillet and Jérémie10 In theory, these scores could achieve significant reductions in blood culture use (10% for BAROC, 26.7% for Shapiro), while maintaining acceptable false negative rates of 2–5%. Reference Quintero Montealegre, Flórez Monroy and Garzón Herazo8–Reference Takeshima, Yamamoto and Noguchi11 A previous study of 149 clinicians found that most were comfortable with a 5% false negative rate,Reference Lautenbach, Localio and Nachamkin12 suggesting these performance characteristics fall within clinically acceptable ranges. However, despite their theoretical promise, these scores have not been widely implemented,Reference Eliakim-Raz, Bates and Leibovici13 possibly due to practical barriers.
Many scores require blood test results, conflicting with ED workflows where providers order all tests at initial IV cannulation, often after triage.Reference Quintero Montealegre, Flórez Monroy and Garzón Herazo8,Reference Shapiro, Wolfe, Wright, Moore and Bates9 Others require extensive data entry,Reference Pehlivan, Douillet and Jérémie10 electronic health record integration,Reference Schinkel, Boerman and Bennis2 or subjective clinical assessments.Reference Shapiro, Wolfe, Wright, Moore and Bates9,Reference Pehlivan, Douillet and Jérémie10 Furthermore, existing rules do not leverage common early warning scores such as quick sequential organ failure assessment (qSOFA), systemic inflammatory response syndrome (SIRS) and National Early Warning Score (NEWS), already widely deployed for sepsis risk stratification.Reference Usman, Usman and Ward14
To our knowledge, no existing rules combine triage-available clinical variables with a routine laboratory biomarker in a two-step sequential framework. We therefore aimed to derive and externally validate a two-step diagnostic stewardship rule integrating triage-available clinical variables with a routine laboratory biomarker to guide blood culture ordering in patients presenting with suspected infection.
Methods
Study design and setting
This was a retrospective prediction model derivation and external validation study conducted at two independent EDs.
Derivation site
Model derivation was performed at Singapore General Hospital (SGH), a 1,800 bed tertiary medical center in Singapore with an annual ED census of approximately 130,000 patients. Consecutive blood cultures drawn between 20th April 2025 and 20th July 2025 were included.
SGH ED serves a predominantly elderly population with multiple co-morbidities, including transplant and oncology patients. During the study period, blood culture ordering decisions were typically made by trainees in consultation with fully qualified Emergency Physicians (EP), without standardized department or hospital protocols. Patients undergoing blood culture collection generally had their cultures drawn by junior doctors and were admitted for follow-up of culture results. All consecutive patients above 18 years old for whom blood cultures were drawn were included, without exclusions.
Validation site
External validation was performed at St Paul’s Hospital (SPH), a 500-bed tertiary academic medical center in Vancouver, Canada (∼80,000 annual ED visits). The validation cohort comprised 808 consecutive cultures from 2016to 2019 among adults with suspected sepsis, defined as suspected infection and ≥2 SIRS criteria at triage per institutional protocol.Reference MacRedmond, Hollohan, Stenstrom, Nebre, Jaswal and Dodek15 Exclusion criteria included septic shock, injection drug use, immunocompromise (HIV not on anti-retroviral therapy; active chemotherapy, corticosteroids); indwelling venous catheters; and hospitalization or surgical procedure in the previous 2 weeks. Of 1,038 patients screened at SPH, 230 were excluded: 78 (33.9%) were excluded for septic shock, 91 (39.6%) for injection drug use, 42 (18.3%) for immunocompromised status, 8 (3.5%) for indwelling venous catheters, and 11 (4.8%) for recent hospitalization or surgery.
Reporting of this study followed the Transparent Reporting of a multivariable prediction model for Individual Prognosis Or Diagnosis (TRIPOD) reporting guidelines.Reference Collins, Reitsma, Altman and Moons16
Outcomes
The primary outcome was blood culture positivity, defined as growth of a clinically significant pathogen. In the derivation cohort, final microbiology reports were reviewed and criteria from Bates et al.Reference Bates17 were applied to distinguish true positives from contaminants. In the validation cohort, a microbiologist assessed blood culture results to determine positivity when it was unclear if a positive culture was due to contamination.
Secondary outcomes included the proportion of blood cultures that would be obtained under the rule, the percentage reduction in cultures compared to culturing all patients, the false negative rate and the distribution of cultures between Step 1 and 2.
Predictors
-
Step 1 candidate predictors (available at triage) included age, NEWS, qSOFA score, and SIRS criteria (excluding white blood cell component). These were selected based on clinical input, implementation feasibility and literature review.Reference Sharma, Chouhan, Yadav and Shrimal18,Reference Jeppesen, Dalsgaard and Ovesen19
-
Step 2 candidate predictors (available after initial blood draw) included leucocyte count, neutrophil count, NLR, white blood cell count (WBC), lactate and CRP.Reference Jiang, Liu and Yu20
The final diagnosis was also extracted and categorized broadly based on ICD code groupings into one of “respiratory”, “intra-abdominal”, “urinary”, “skin and soft tissue”, and “source unclear” to allow for preplanned subgroup analysis.
Sample size
No formal sample size calculation was performed. The derivation sample included all consecutive eligible encounters during the 3-month study period (N = 1,224), with 117 positive cultures providing approximately 23 events per candidate predictor in Step 1 (4 predictors) and 19 events per candidate predictor in Step 2 (6 predictors).
Missing data
Complete-case analysis was used for each variable. The validation cohort had complete data for all variables. Patients with missing data for a specific predictor were excluded from analyses involving that predictor but retained for other analyses.
Statistical analysis and derivation of clinical rule
To narrow down candidates for our rule, we first performed a univariate comparison of clinical scores and laboratory values between patients with positive blood cultures and those without. Continuous and ordinal variables were summarized using median and interquartile range (IQR). Group comparisons were conducted using the Wilcoxon rank-sum test (two-sided). For each comparison, we additionally reported rank-biserial correlation (r) as an effect size, where positive values indicate higher values in the blood-culture-positive group.
Based on univariate results and clinical considerations, we selected NEWS, age, and NLR as rule components. Age stratification was incorporated because older adults often exhibit blunted physiologic responses to infection- with a resulting lower NEWS score despite significant illness severity.Reference Tupper, Redfern and Harrison21,Reference Clifford, Dy-Boarman, Haase, Maxvill, Pass and Alvarez22
We defined the following cutoffs: age in 5-year increments (65–80 years), NEWS thresholds of 3–5 (aligned with existing sepsis protocolsReference Inada-Kim23), and NLR increments of 0.5 (range 5–10 based on literatureReference Jiang, Liu and Yu20,Reference Gurol, Ciftci, Terzi, Atasoy, Ozbek and Koroglu24 ). We specified candidate rules as follows: Step 1, to be used in triage, recommended blood cultures based on age-stratified NEWS thresholds. Patients not meeting Step 1 criteria proceeded to Step 2, which is assessed when the blood test results are out, which recommended cultures if NLR exceeded a prespecified threshold. We performed an exhaustive grid search across all clinically plausible threshold combinations.
For each candidate rule, we calculated: (1) proportion of encounters in which cultures would be obtained; (2) percentage reduction in cultures; (3) proportion of culture-positive cases missed (false-negative rate); and 4) proportion of cultures triggered in Step 1 versus Step 2. The final rule was selected as the candidate achieving the greatest culture reduction while maintaining false-negative rate of <5%.
After deriving the two-step SCANNED (Stepwise Culture Assessment with NEWS and NLR in ED) rule, internal validation of the SCANNED rule was performed in the derivation cohort using nonparametric bootstrapping with 2000 resamples drawn with replacement. In each resample we recalculated all performance metrics and summarized uncertainty using percentile-based 95% confidence intervals.
External validation was performed by applying the fixed, prespecified rule to the independent SPH cohort and computing the same performance metrics.
We also evaluated rule performance stratified by infection source category. To assess whether inclusion of immunocompromised patients in derivation influenced rule performance, a sensitivity analysis was performed excluding patients with neutropenia (absolute neutrophil count (ANC) <1.5 x 10 ^ 9/L). The derivation data set lacked structured fields for immunocompromised status or indwelling vascular access; neutropenia was selected as the most objective available proxy.
All statistical analysis was conducted using R v4.5.2 (R Foundation, Vienna, Austria).
Ethical approval
Ethics review was deemed exempt by the SingHealth Centralised Institutional Review Board due to the use of deidentified data. The ethics review board of Providence Health Care and the University of British Columbia approved this study for the SPH cohort.
Results
Derivation and validation cohorts
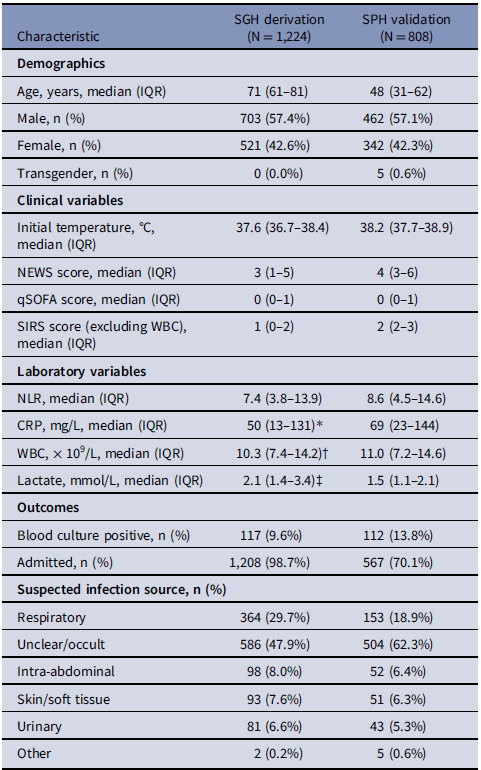
The derivation cohort comprised 1,224 encounters from SGH with a median age of 71 years (IQR 61–81), while the external validation cohort comprised 808 encounters from SPH with a median age of 48 years (IQR 31–62). Sex distribution was similar across cohorts SGH 703 (57.4%) male vs SPH 462 (57.1%). Blood culture positivity was 117 (9.6%) in SGH and 112 (13.8%) in SPH. Admission rates were 1,208 (98.7%) in SGH and 567 (70.1%) in SPH (Table 1). In the derivation cohort, CRP was missing in 27.7% (339/1,224) and white blood cell count in 6.6% (81/1,224).
Baseline characteristics of derivation and validation cohorts

Table 1. Long description
The table compares baseline characteristics of derivation and validation cohorts across various categories. It has 16 rows and 4 columns. The columns are labeled as Characteristic, SGH derivation (N = 1,224), and SPH validation (N = 808). The rows are grouped into Demographics, Clinical variables, Laboratory variables, and Outcomes. Row 1: Age, years, median (IQR), SGH derivation 71 (61-81), SPH validation 48 (31-62). Row 2: Male, n (%), SGH derivation 703 (57.4%), SPH validation 462 (57.1%). Row 3: Female, n (%), SGH derivation 521 (42.6%), SPH validation 342 (42.3%). Row 4: Transgender, n (%), SGH derivation 0 (0.0%), SPH validation 5 (0.6%). Row 5: Initial temperature, °C, median (IQR), SGH derivation 37.6 (36.7-38.4), SPH validation 38.2 (37.7-38.9). Row 6: NEWS score, median (IQR), SGH derivation 3 (1-5), SPH validation 4 (3-6). Row 7: qSOFA score, median (IQR), SGH derivation 0 (0-1), SPH validation 0 (0-1). Row 8: SIRS score (excluding WBC), median (IQR), SGH derivation 1 (0-2), SPH validation 2 (2-3). Row 9: NLR, median (IQR), SGH derivation 7.4 (3.8-13.9), SPH validation 8.6 (4.5-14.6). Row 10: CRP, mg/L, median (IQR), SGH derivation 50 (13-131), SPH validation 69 (23-144). Row 11: WBC, x 10^9/L, median (IQR), SGH derivation 10.3 (7.4-14.2), SPH validation 11.0 (7.2-14.6). Row 12: Lactate, mmol/L, median (IQR), SGH derivation 2.1 (1.4-3.4), SPH validation 1.5 (1.1-2.1). Row 13: Blood culture positive, n (%), SGH derivation 117 (9.6%), SPH validation 112 (13.8%). Row 14: Admitted, n (%), SGH derivation 1,208 (98.7%), SPH validation 567 (70.1%). Row 15: Suspected infection source, n (%), Respiratory, SGH derivation 364 (29.7%), SPH validation 153 (18.9%). Row 16: Suspected infection source, n (%), Unclear/occult, SGH derivation 586 (47.9%), SPH validation 504 (62.3%). Row 17: Suspected infection source, n (%), Intra-abdominal, SGH derivation 98 (8.0%), SPH validation 52 (6.4%). Row 18: Suspected infection source, n (%), Skin/soft tissue, SGH derivation 93 (7.6%), SPH validation 51 (6.3%). Row 19: Suspected infection source, n (%), Urinary, SGH derivation 81 (6.6%), SPH validation 43 (5.3%). Row 20: Suspected infection source, n (%), Other, SGH derivation 2 (0.2%), SPH validation 5 (0.6%).
* CRP missing in 339 (27.7%) of SGH cohort.
† WBC missing in 81 (6.6%) of SGH cohort.
‡ Lactate missing in 887 (72.5%) of SGH cohort).
IQR, interquartile range; NEWS, National Early Warning Score; qSOFA, quick Sequential Organ Failure Assessment.
SIRS, Systemic Inflammatory Response Syndrome; NLR, neutrophil-lymphocyte ratio; CRP, C-reactive protein; WBC, white blood cell count.
The validation cohort had higher baseline severity scores (median NEWS 4 vs 3, SIRS 2 vs 1) and inflammatory markers (median NLR 8.6 vs 7.4, CRP 69 vs 50 mg/L) compared with the derivation cohort. Initial temperature was higher in SPH (median 38.2°C vs 37.6°C). Suspected infection sources differed between sites, with SGH having more respiratory (29.7% vs 18.9%) and fewer unclear/occult (47.9% vs 62.3%) sources.
Model derivation
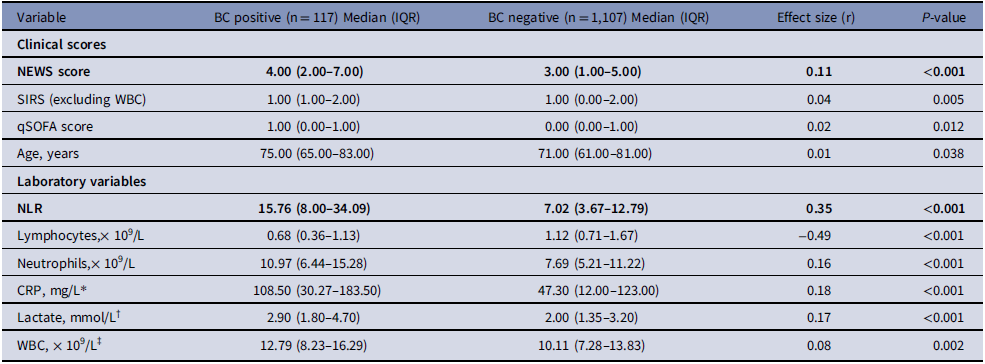
Univariate analysis of the derivation cohort found that blood-culture-positive patients had higher illness severity by NEWS (median 4 vs 3; P < .001) and modestly higher SIRS (excluding WBC) and qSOFA scores (P = .005 and P = .012, respectively), while age was slightly higher in the positive group (median 75 vs 71 years; P = .038). Among the lab variables, NLR showed the strongest association with blood culture positivity (median 15.76 vs 7.02; P < .001) compared to the other tests (Table 2).
Univariate analysis of candidate predictors in derivation cohort (N = 1,224)

Table 2. Long description
A table comparing clinical scores and laboratory variables between BC positive (n = 117) and BC negative (n = 1,107) groups. The table has 12 rows and 5 columns. Column headers are Variable, BC positive (n = 117) Median (IQR), BC negative (n = 1,107) Median (IQR), Effect size (r), and P-value. Row labels include clinical scores such as NEWS score, SIRS (excluding WBC), qSOFA score, and Age, as well as laboratory variables like NLR, Lymphocytes, Neutrophils, CRP, Lactate, and WBC. Each row provides median values with interquartile ranges for both BC positive and BC negative groups, along with effect sizes and P-values. Notable trends include higher NEWS scores, NLR, Neutrophils, CRP, and Lactate levels in the BC positive group compared to the BC negative group, with corresponding lower P-values indicating statistical significance.
* CRP available in 895 patients (82 positive, 813 negative).
† Lactate available in 340 patients (45 positive, 295 negative).
‡ WBC available in 1,151 patients (107 positive, 1,044 negative).
Effect size r = rank-biserial correlation; positive values indicate higher values in blood culture-positive group.
NEWS, National Early Warning Score; SIRS, Systemic Inflammatory Response Syndrome; qSOFA, quick Sequential Organ Failure Assessment; NLR, neutrophil-lymphocyte ratio; CRP, C-reactive protein; WBC, white blood cell count; IQR, interquartile range.
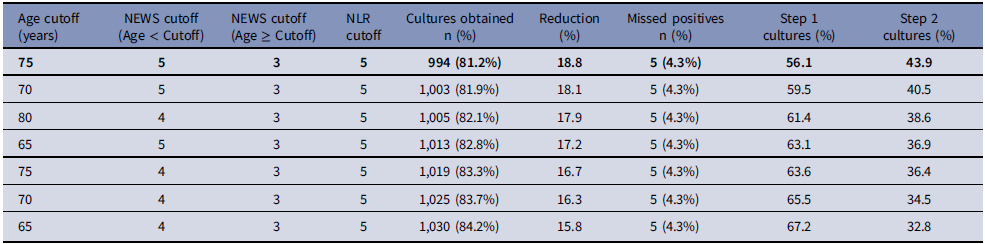
The grid search identified a total of 7 candidate rules that fulfilled the prespecified criteria (Table 3). The rule that resulted in the largest reduction in blood cultures used an age cutoff of 75 years, with Step 1 culturing patients with NEWS ≥5 if age < 75 or NEWS ≥ 3 if age ≥ 75, and Step 2 culturing remaining patients with NLR ≥ 5 (Figure 1).
The SCANNED (Stepwise Culture Assessment with NEWS and NLR in ED) rule.

Grid search results: candidate rules meeting prespecified criteria (<5% false-negative rate)

Table 3. Long description
The table presents a comparison of candidate rules for reducing blood cultures based on age cutoffs, NEWS (National Early Warning Score) cutoffs, NLR (Neutrophil to Lymphocyte Ratio) cutoffs, and the resulting reduction in cultures, missed positives, and the percentage of cultures in Step 1 and Step 2. The table has 8 rows and 10 columns. Column headers are Age cutoff (years), NEWS cutoff (Age < Cutoff), NEWS cutoff (Age ≥ Cutoff), NLR cutoff, Cultures obtained n (%), Reduction (%), Missed positives n (%), Step 1 cultures (%), and Step 2 cultures (%). Row 1: Age cutoff 75 years, NEWS cutoff 5 (Age < Cutoff), NEWS cutoff 3 (Age ≥ Cutoff), NLR cutoff 5, Cultures obtained 994 (81.2 percent), Reduction 18.8 percent, Missed positives 5 (4.3 percent), Step 1 cultures 56.1 percent, Step 2 cultures 43.9 percent. Row 2: Age cutoff 70 years, NEWS cutoff 5 (Age < Cutoff), NEWS cutoff 3 (Age ≥ Cutoff), NLR cutoff 5, Cultures obtained 1,003 (81.9 percent), Reduction 18.1 percent, Missed positives 5 (4.3 percent), Step 1 cultures 59.5 percent, Step 2 cultures 40.5 percent. Row 3: Age cutoff 80 years, NEWS cutoff 4 (Age < Cutoff), NEWS cutoff 3 (Age ≥ Cutoff), NLR cutoff 5, Cultures obtained 1,005 (82.1 percent), Reduction 17.9 percent, Missed positives 5 (4.3 percent), Step 1 cultures 61.4 percent, Step 2 cultures 38.6 percent. Row 4: Age cutoff 65 years, NEWS cutoff 5 (Age < Cutoff), NEWS cutoff 3 (Age ≥ Cutoff), NLR cutoff 5, Cultures obtained 1,013 (82.8 percent), Reduction 17.2 percent, Missed positives 5 (4.3 percent), Step 1 cultures 63.1 percent, Step 2 cultures 36.9 percent. Row 5: Age cutoff 75 years, NEWS cutoff 4 (Age < Cutoff), NEWS cutoff 3 (Age ≥ Cutoff), NLR cutoff 5, Cultures obtained 1,019 (83.3 percent), Reduction 16.7 percent, Missed positives 5 (4.3 percent), Step 1 cultures 63.6 percent, Step 2 cultures 36.4 percent. Row 6: Age cutoff 70 years, NEWS cutoff 4 (Age < Cutoff), NEWS cutoff 3 (Age ≥ Cutoff), NLR cutoff 5, Cultures obtained 1,025 (83.7 percent), Reduction 16.3 percent, Missed positives 5 (4.3 percent), Step 1 cultures 65.5 percent, Step 2 cultures 34.5 percent. Row 7: Age cutoff 65 years, NEWS cutoff 4 (Age < Cutoff), NEWS cutoff 3 (Age ≥ Cutoff), NLR cutoff 5, Cultures obtained 1,030 (84.2 percent), Reduction 15.8 percent, Missed positives 5 (4.3 percent), Step 1 cultures 67.2 percent, Step 2 cultures 32.8 percent.
Highlighted row = selected final rule (maximum reduction with <5% false-negative rate).
NEWS, National Early Warning Score; NLR, neutrophil-lymphocyte ratio.
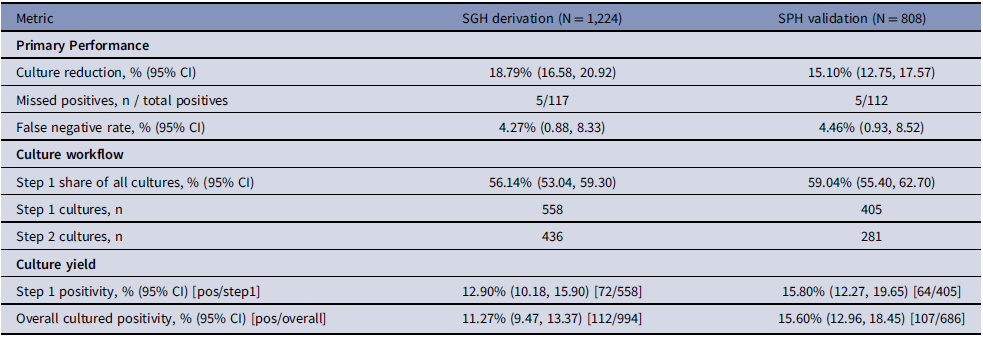
Applied to the derivation cohort, the SCANNED rule would have reduced blood cultures by 18.8% (994/1,224 cultured, 95% CI 16.6 to 20.9) while missing 4.3% of positives (5/117 positives, 95% CI 0.9 to 8.3). Among cultures obtained under the rule, 56.1% (95% CI 53.0–59.3) of all cultures were triggered by Step 1 (Table 4, Supplement 2).
Performance of 2 step blood culture rule in derivation and validation cohort

Table 4. Long description
The table compares the performance of a two-step blood culture rule in derivation and validation cohorts. It has four rows and three columns. The columns are labeled Metric, SGH derivation (N = 1,224), and SPH validation (N = 808). The rows are grouped under Primary Performance, Culture workflow, and Culture yield. Row 1: Culture reduction, percent (95 percent CI), 18.79 percent (16.58, 20.92), 15.10 percent (12.75, 17.57). Row 2: Missed positives, n / total positives, 5/117, 5/112. Row 3: False negative rate, percent (95 percent CI), 4.27 percent (0.88, 8.33), 4.46 percent (0.93, 8.52). Row 4: Step 1 share of all cultures, percent (95 percent CI), 56.14 percent (53.04, 59.30), 59.04 percent (55.40, 62.70). Row 5: Step 1 cultures, n, 558, 405. Row 6: Step 2 cultures, n, 436, 281. Row 7: Step 1 positivity, percent (95 percent CI) [pos/step1], 12.90 percent (10.18, 15.90) [72/558], 15.80 percent (12.27, 19.65) [64/405]. Row 8: Overall cultured positivity, percent (95 percent CI) [pos/overall], 11.27 percent (9.47, 13.37) [112/994], 15.60 percent (12.96, 18.45) [107/686].
External validation
External validation in the independent SPH cohort (N = 808; 112 culture-positive) demonstrated similar performance. The rule would have reduced cultures by 15.1% (686/808 cultured, 95% CI 12.8–17.6) while missing 4.5% (5/112 positives, 95% CI 0.9–8.5), corresponding to 95.5% positivity capture. In SPH, 59.0% (95% CI 55.4–62.7%) of cultures were triggered by Step 1, supporting generalizability (Table 4, Supplement 2).
Subgroup analysis
Subgroup analysis across infection sources showed consistent rule performance; in patients with unclear infection source - the hardest group to stratify - culture reduction was 17.5% with a false-negative rate of 3.7% (Supplement 1).
Sensitivity analysis
Excluding 27 neutropenic patients (ANC <1.5 x 10 ^ 9/L) from the derivation cohort (remaining n = 1,197), the rule reduced cultures by 18.0% (982/1,197 cultured, 95% CI 15.9–20.2) with a false-negative rate of 4.6% (5/108 positives, 95% CI 1.9–9.9), consistent with the primary analysis.
Missed bacteremia cases
The organisms among the 10 missed bacteremia cases (5 per cohort) are presented in Supplement 3. All but 1 case from SPH were admitted. One SPH case had a neutropenia (ANC 0.7) resulting in an NLR of 0.47- a known limitation of the NLR. None of the patients died in the ED; subsequent clinical outcomes for missed cases were not available for retrospective review.
Discussion
This study derived and externally validated the SCANNED rule, a simple two-step clinical decision rule for blood culture stewardship in the ED. Applying the SCANNED rule at two independent sites across two countries, the rule reduced blood cultures by 15–19% while missing fewer than 5% of positive cultures. Notably, rule performance held up despite substantial differences in baseline severity, demographics and clinical settings between the two cohorts.
From a diagnostic stewardship perspective, the rule’s primary value lies not in merely reducing test volume, but concentrating cultures where bacteremia is most probable. Cultures done in the ED carry disproportionately high contamination rates compared to inpatient draws, contributing to antimicrobial escalation and prolonged admissions for workup of false-positive results.Reference Sacchetti, Travis, Steed and Webb25 By withholding cultures from the lowest-risk tier – where the pretest probability of bacteremia is already low - the rule reduces exposure to this contamination cascade without sacrificing diagnostic yield for true bacteremia. Furthermore, the NO-BACT cohort study demonstrated that 40% of patients with negative blood cultures received inappropriate antimicrobial treatment at 48 hours, with insufficient coverage independently predicting 30-day mortality - highlighting that negative cultures do not reliably prevent antimicrobial misuse, and that not drawing cultures from genuinely low-risk patients may avoid antibiotic inertia rather than perpetuate it.Reference Girón-Ortega JA, Fernández-Guerrero and De Oca Arjona4
The rule’s performance compares favorably with existing blood culture decision tools while offering practical advantages. In its original derivation and validation study, the Shapiro Score can potentially reduce cultures by up to 26.7%, but requires blood test results and a subjective judgement on clinical suspicion of infective endocarditis.Reference Shapiro, Wolfe, Wright, Moore and Bates9 The BAROC score does not require blood test results and can potentially reduce cultures by 10%,Reference Pehlivan, Douillet and Jérémie10 but requires 12 items, a web-calculator and clinical judgement on whether “bacterial infection is the most likely diagnosis” and “suspected endocarditis”. Comparatively, the SCANNED rule can potentially reduce blood cultures by 15% with practical advantages: it requires only three variables (age, NEWS, NLR), needs no electronic health record integration (unlike machine-learning approaches);Reference Boerman, Schinkel and Meijerink26 and leverages scores already used for sepsis screening.Reference Inada-Kim23 As a three-variable rule requiring no additional infrastructure, the SCANNED rule is readily integrated into institutional diagnostic stewardship programmes alongside existing antimicrobial stewardship committee oversight.
The two-step design concentrates cultures where bacteremia risk is highest. Step 1 uses NEWS thresholds already integrated into sepsis screening pathways; Step 2 applies NLR – readily calculated from routine complete blood counts – as a safety net after initial assessment. 56 to 59% of cultures are triggered at Step 1 alone, capturing most bacteremic patients before laboratory results are required.
Prior blood culture decision-making frameworks have shown variable real-world impact,Reference Fabre, Sharara, Salinas, Carroll, Desai and Cosgrove27,Reference Theophanous, Ramos and Calland28 with Fabre et al.’s guidance- based on suspected types of infection- yielding culture reductions ranging from 0.8–25% across ED implementation.Reference Theophanous, Ramos and Calland28,Reference Ramos, Theophanous and Gettler29 The SCANNED rule complements this and operates upstream, providing a validated risk-stratification tool prior to provisional diagnosis- a distinction that might be valuable where infection source is initially unclear. Subgroup analysis in patients with unclear infection source - arguably the hardest group to stratify - demonstrated a 17.5% culture reduction with a false-negative rate below 3.7%, supporting the rule’s utility precisely in this setting.
The use of NLR as a step two criteria, while supported by our univariate analysis, is also a practical choice- this value is likely to be widely available regardless of resource setting. At the same time, NLR has its drawbacks in neutropenic patients (falsely low), or malignancy/ chronic inflammatory diseases/ steroid use (falsely high).Reference Russell, Parajuli and Gale30,Reference Templeton and McNamara31 Institutions with varying populations may wish to evaluate differing NLR thresholds or other step 2 biomarkers.
Limitations
Several limitations warrant consideration. First, derivation and validation cohorts were substantially different- The SGH cohort took all consecutive blood cultures, and included immunocompromised patients, while the SPH cohort took a sicker cohort and excluded certain populations at higher risk of bacteremia. In centers with large oncology populations or high prevalence of injection drug use, the applicable proportion of patients might be lower as such information might not be available at triage.Reference Choi, Chia and Koh32 Second, our study is a retrospective study on patients for whom blood cultures were already ordered. Real-world implementation might paradoxically increase culture rates if applied to all patients with suspected infection, rather than as a rule-out tool for patients being considered for cultures (the design intent). Third, antibiotic administration timing relative to culture draw was not captured and may affect culture positivity rates. Fourth, CRP, lactate and/or procalcitonin was not available for a large proportion of the derivation cohort, limiting biomarker comparisons. Procalcitonin may achieve superior performance to NLRReference Kaal, Meziyerh and Van Burgel33 and should be evaluated as a step 2 marker in further studies. Fifth, with only 5 missed positive cultures in each cohort, the false negative rate estimates have wide confidence intervals (0.9–8.5%). This imprecision is inherent to studies with low event rates, and further prospective studies are required. Sixth, different approaches were used for adjudicating contaminants- while both are accepted approaches, borderline cases might be classified differently, potentially affecting false-negative estimates in either direction. The consistent performance across both definitions is reassuring but does not eliminate this concern. Seventh, the derivation cohort only spanned 3 months and might miss seasonal variation in infection epidemiology. However, the validation cohort spanned 3 years – consistent rule performance is partially reassuring. Eighth, downstream clinical outcomes were not assessed, and the rule’s impact on mortality, ICU admission or antibiotic decisions remain unknown and should be evaluated prospectively.
Conclusion
The SCANNED rule offers a pragmatic approach to blood culture stewardship, leveraging clinical variables already embedded in acute care sepsis pathways. Its consistent performance across two geographically and clinically distinct cohorts is encouraging. As a three-variable tool deployable without electronic health record integration, it is readily incorporated into institutional diagnostic stewardship programmes alongside existing antimicrobial stewardship committee oversight. Prospective evaluation is the necessary next step - to determine not only whether culture reduction is achieved in real-world implementation, but whether this translates to measurable reductions in contamination events, inappropriate antimicrobial use, and associated patient outcomes.
Supplementary material
The supplementary material for this article can be found at https://doi.org/10.1017/ice.2026.10507.
Data availability statement
Deidentified data and statistical code will be made available upon reasonable request to the corresponding author following publication.
Acknowledgments
The authors thank the Office of Value Based Care, Singapore General Hospital for extracting deidentified data from SGH.
Author contribution
Study concept and design: ZL, RS. Acquisition of data: ZL (SGH site supervision), RS (SPH site supervision), MH. Analysis and interpretation of data: ZL, MH. Drafting of the manuscript: ZL. Critical revision of the manuscript for important intellectual content: RS, MFR, JJLY, XYT, SYT, FS. Statistical expertise: ZL. Acquisition of funding: ZL, RS, FS. All authors attest to meeting the four ICMJE.org authorship criteria: (1) substantial contributions to conception and design, acquisition of data, or analysis and interpretation of data; (2) drafting the article or revising it critically for important intellectual content; (3) final approval of the version to be published; and (4) agreement to be accountable for all aspects of the work.
Financial support
ZL is supported under the Nurturing Clinician Researcher Scheme (2025/PG/000020/C2) from the SingHealth Duke-NUS Academic Medical Centre. RS is supported by St. Paul’s Hospital Foundation Emergency Department Support Fund. RS is the Innovation Program Lead for Sepsis and Infections, Emergency Care BC.FS is supported by the St. Paul’s Hospital Foundation Emergency Department Support Fund, and University of British Columbia Department of Emergency Medicine.The funders had no role in study design, data collection, analysis, interpretation of data, writing of the manuscript, or decision to submit for publication.
Competing interests
ZL reports no conflict of interest. MFR reports no conflict of interest. JJLY reports no conflict of interest. XYT reports no conflict of interest. MH reports no conflict of interest. SYT reports no conflict of interest. FS reports no conflict of interest. RS serves as an unpaid Medical Director for ASEP Medical Holdings. The company had no role in the design, conduct, analysis, or reporting of this study.