


1. Introduction
Sandstone-type uranium deposits are primary exploration targets within the Mesozoic–Cenozoic basin and significant global uranium resources due to their cost-effective in-situ leaching methods and favourable environmental benefits (Zammit et al. Reference Zammit, Brugger, Southam and Reith2014; Hall et al. Reference Hall, Van Gosen and Zielinski2023). These types of deposit, which have identified resources exceeding 50% in China, are predominantly located in the northern sedimentary basins (Akhtar et al. Reference Akhtar, Yang and Pirajno2017; Qin et al. Reference Qin, Huang, Liu, Liu, Gu, Jia and Jiang2022; Yan et al. Reference Yan, Zhang, Zhang, Xia, Nie and Wu2023), including the Yili, Junggar, Ordos, and Erlian Basins, etc. (Xia et al. Reference Xia, Lin, Liu, Fan and Hou2003; Cai et al. Reference Cai, Han, Zhang, Yi, Li, Zhang, Wang and Li2021; He et al. Reference He, Hu, Qiu, Wang, Chen, Jia, Li, Ji and Zhu2024). Therein, most sandstone uranium ores are generally hosted within grey coal-bearing clastic rocks that possess notable reducing properties (Penney, Reference Penney2013; Yi et al. Reference Yi, Wang, Li, Zhang and Wang2018; Cuney et al. Reference Cuney, Mercadier and Bonnetti2022). In contrast, the red-variegated rock series, characterized by original oxidizing properties (Xiang et al. Reference Xiang, Jiao, Wu, Rong and Zhang2022; Ji et al. Reference Ji, He, Zhong, Chen, Zhu, Wu and Dong2023; Jiang et al. Reference Jiang, Qin, Fan, Jia, Guo, Huang, Ning and Xiao2023), has historically been regarded as an unfavourable reservoir for uranium mineralization and has received limited attention (Huang et al. Reference Huang, Qin, Liu, Xiao and Liu2024; Zhang et al. Reference Zhang, He, Li, Liu, Li, Wang, Liu, Li, Zhang and Luo2024).
Over the past 30 years, several sandstone uranium deposits, including Dongsheng, Na’lingou, Ba’yinqinggeli, etc. (Chen et al. Reference Chen, Sun, Nie, Li, Zhen and Zhou2020; Cai et al. Reference Cai, Han, Zhang, Yi, Li, Zhang, Wang and Li2021; Zhang et al. Reference Zhang, Liu, Zhang, Fayek, Lei and Quan2022), have been discovered within the Middle Jurassic Zhiluo Formation in the northern Ordos Basin (Figure 1a–b). These deposits exhibit a unified superimposed mineralization model associated with the secondary reduction of hydrocarbon fluids (Guo et al. Reference Guo, Jiao, Miao, Wang, Wang and Cheng2015; Akhtar et al. Reference Akhtar, Yang and Pirajno2017). All ore bodies are situated between the green ancient oxidation zone and the primary grey reduction zone (Yi et al. Reference Yi, Wang, Li, Zhang and Wang2018), which markedly differs from the traditional roll-type uranium ores that typically occur between the red or yellow oxidation zone and the grey reduction zone (Hall et al. Reference Hall, Mihalasky, Tureck, Hammarstrom and Hannon2017; Bohari et al. Reference Bohari, Harouna, Mosaad, Qian and Laouali2022). In recent years, a large-scale Tel’aobo uranium deposit was discovered within the Lower Cretaceous oxidizing red-variegated strata (Liu et al. Reference Liu, He, Yan, Wu and Zhang2022; Wang et al. Reference Wang, Yan, Jiao, Wu, Zhang, Rong, Zhang, Li and Zhong2023), northern Ordos Basin (Figure 1b). Some scholars investigated the sedimentary system and geochemical properties of the ore-bearing layer, genesis of the green sandstone (Wu et al. Reference Wu, Wu and Li2020; Han et al. Reference Han, Li, Zhang, Luo and Wang2022), composition and origin of the ore and mineralization mechanisms of this deposit (Zhang et al. Reference Zhang, He, Li, Liu, Li, Wang, Liu, Li, Zhang and Luo2024). They propose that the green sandstone, lacking native reducing agents, shares a similar hydrocarbon secondary reduction genesis with the underlying Zhiluo Formation (Qiu et al. Reference Qiu, Li, Zhang, Wang, Li, Han and Wang2024). Furthermore, the ores predominantly consist of high-grade brownish-grey sandstone, with a minimal proportion of green sandstone ores that exhibit relatively low grades (Han et al. Reference Han, Li, Zhang, Luo and Wang2022). This distinction from typical sandstone uranium deposits globally has sparked controversy surrounding the mineralization mechanisms of infiltration and exudation (Huang et al. Reference Huang, Liu, Qin and He2023). For example, a three-stage superimposed uranium mineralization model, which includes twice oxidation events and one hydrocarbon transformation, has been established to explain this deposit (Wang et al. Reference Wang, Yan, Jiao, Wu, Zhang, Rong, Zhang, Li and Zhong2023). He et al. (Reference He, Li, Liu, Zhang, Wang, Liu, Zhang, Qiu and Han2023) propose that a two-stage fluid mixing process between coeval oxidizing water and hydrocarbon-bearing fluids generates the deposit, with both deep and shallow fluids serving as sources of uranium. Regarding the form of uranium in deep hydrocarbon fluids, some researchers propose that it exists as a U–organic complex (Li et al. Reference Li, Liu, Li, Li, Qin, Cai, Zhang, He, Wu, Qiu, Liu, Zhu, Ji and Guo2022), whereas others suggest it is present as an aerosol colloid (Liu et al. Reference Liu, Zhang, Huang, Wu, Wang, Zhang, Tan, Ma and Zhao2024a). Additionally, it is posited that hydrothermal fluids may have introduced uranium into the Tel’aobao deposit (Hu et al. Reference Hu, Ling, Xu, Wei, Yang, Lu, Wang, Zhang, Jiang and Zhao2025), based on elementary geochemical data from red ores.
Structural units of the Ordos Basin and the position of the study area (a: Han et al. Reference Han, Li, Qiu, Zhang and Wang2025), geologic map of the northern Ordos Basin showing the location of typical sandstone-hosted uranium deposits (b: Huang et al. Reference Huang, Liu, Qin and He2023) and column map showing the cover layer (c: Ren et al. Reference Ren, Yang, Miao, Hu, Chen, Chen and Zhao2022).

Figure 1. Long description
Panel A: A structural units map of the Ordos Basin showing the position of the study area. The map includes various geological units such as Paleogene-Quaternary cover, Cretaceous strata, Jurassic strata, Triassic strata, Late Paleozoic Unit, Early Paleozoic Unit, and Archaean unit. It also marks granite, stratigraphic boundaries, stratigraphic unconformities, uranium deposits, cities, and faults. The inset map provides a broader context of the region. Panel B: A geologic map of the northern Ordos Basin displaying the locations of typical sandstone-hosted uranium deposits. The map uses different colors to represent various geological formations and units, such as Quaternary, Neogene, Cretaceous, Jurassic, and others. It also includes symbols for cities, faults, and different types of rock formations. Panel C: A column map showing the cover layer of the Ordos Basin. The column map details the stratigraphic units, lithology, and sedimentary environment, providing a vertical cross-section of the geological layers.
Despite the existing research, the characteristics that significantly differ from the traditional roll-shaped U deposit require further detailed investigation to determine the ore genesis and the dominant factors controlling uranium mineralization in this deposit. For instance, notable differences in understanding persist regarding the primary and secondary genesis of green sandstone (Wu et al. Reference Wu, Yu, Zhou and Zhu2005; Xiang et al. Reference Xiang, Jiao, Wu, Rong and Zhang2022), as well as the sources and nature of the complex ore-forming fluids (Hu et al. Reference Hu, Ling, Xu, Wei, Yang, Lu, Wang, Zhang, Jiang and Zhao2025). Currently, there is also a lack of systematic research on how the three types of fluid are coupled with uranium mineralization. The sandstone reservoir of the Huanhe Formation exhibits a distinctive redox zoning and warm-toned mineralization types, which serve as a new exemplary case for the study of sandstone-type uranium deposit (Cuney et al. Reference Cuney, Mercadier and Bonnetti2022; Ren et al. Reference Ren, Yang, Miao, Hu, Chen, Chen and Zhao2022). This research encompasses a series of petrological, mineralogical and geochemical analyses of sandstones exhibiting various colours and mineralization states, thereby providing a comprehensive chain of evidence for uranium mineralization from ternary fluids. The objectives are to (1) reveal the geochemistry and geochronology of the deposit, (2) uncover the genesis of the red and green sandstones, (3) investigate the origin and nature of multiple ore-forming fluids and (4) elucidate the mechanisms of uranium mineralization and the associated ore genetic model.
2. Geological setting
2.a. The Ordos Basin
The Ordos Basin, situated in the western region of the North China Craton, is characterized as a multi-cycle tectonically superimposed background (Ren et al. Reference Ren, Tamaki, Li and Junxia2002; Zhang et al. Reference Zhang, Liu, Zhang, Fayek, Lei and Quan2022). This basin, which exhibits a nearly north–south orientation, extends approximately 640 km in length and about 400 km in width (Figure 1a), encompassing an area of approximately 137 000 km2 (Liu et al. Reference Liu, He, Yan, Wu and Zhang2022). Topographically, it is bordered to the south by the Qinling Range, to the north by the Yinshan Hills, to the east by the Taihang-Lvliang Mountain range and to the west by the Helan Mountain range (Luo et al. Reference Luo, Yang, Lu, Liu and Tang2021). The tectonic evolution involves a mid-late Proterozoic depression basin, a Paleozoic-Jurassic craton basin, a Cretaceous foreland basin and a Cenozoic peripheral fault basin (Chen et al. Reference Chen, Sun, Nie, Li, Zhen and Zhou2020). Based on internal structural characteristics (Ren et al. Reference Ren, Yang, Miao, Hu, Chen, Chen and Zhao2022), six secondary structural units have been identified (Zhu, Reference Zhu2016): the Yimeng Uplift, the Western Margin Thrust Zone, the Tianhuan Depression, the Yishan Slope, the Jinxi Fold Belt and the Weibei Uplift (Figure 1a).
The research area is situated in the Hangjinqi region of the northern Ordos Basin (Figure1a) and occupies a structural position in the transitional zone between the Yimeng Uplift and the Yishan Slope (Hu et al. Reference Hu, Ling, Xu, Wei, Yang, Lu, Wang, Zhang, Jiang and Zhao2025). The structural configuration of the area is characterized by a slope that is elevated in the northeast and declines towards the southwest, exhibiting a relatively low degree of folding deformation (Zhang et al. Reference Zhang, Liu, Zhang, Fayek, Lei and Quan2022). Several major faults trending east-west (EW), north-east (NE) and north-west (NW), including the Bo’erjianghaizi, Ulan-Jilin, and San’yanjing faults (Figure1b), have developed from east to west (Liu et al. Reference Liu, Ma, He, Wen, Tang, Zheng, Ren and Luo2023). In the cross-section, these faults penetrate the basement and the Lower Cretaceous, exhibiting the morphology of upper steep and lower gentler (Zhang, Reference Zhang2022).
The dual crystallization- and folding-basement of the basin is primarily composed of a metamorphic rock series ranging from Archean to Proterozoic, as well as Upper Paleozoic sedimentary strata (Wu et al. Reference Wu, Yu, Zhou and Zhu2005; Wang et al. Reference Wang, Shi, Xie, Zhang, Qin, Liu and Busbey2020). The Mesozoic cover predominantly includes the Triassic, Jurassic and Cretaceous strata (Figure 1c), with a significant portion of the Cenozoic missing (Qi et al. Reference Qi, Liu, Zhang and Li2009). The Lower Cretaceous consists of red-variegated formations characterized by a primary oxidation environment (Lin et al. Reference Lin, Fan, Ni, Pan, Jin, Cheng, Cui, Cheng, Li, Zhu, Zhu and Li2025), which can be subdivided into the Luohe Formation (K1 l), Huanhe Formation (K1 h), Luohandong Formation (K1 lh), and Jingchuan Formation (K1 j) from bottom to top (Zhu, Reference Zhu2016; Huang et al. Reference Huang, Liu, Qin and He2023). Their lithology primarily comprises purple-red and grey-green sandstone, sandstone interbedded with purple-red and brownish-red silty mudstone (Figure1c) and thin layers of conglomerate (He et al. Reference He, Li, Liu, Zhang, Wang, Liu, Zhang, Qiu and Han2023). These formations are primarily deposited within both aeolian and aqueous sedimentary systems (Zhang et al. Reference Zhang, He, Li, Liu, Li, Wang, Liu, Li, Zhang and Luo2024). The marginal facies is typically characterized by alluvial fans and aeolian dunes (Wu et al. Reference Wu, Yu, Zhou and Zhu2005), whereas the basin’s hinterland gradually transitions into rivers, deltas, and inland lakes (Wu et al. Reference Wu, Wu and Li2020).
2.b. Tel’aobao uranium deposit
The Lower Cretaceous Huanhe Formation in the northwest of the Ordos Basin exhibits significant geochemical zoning (Wang et al. Reference Wang, Yan, Jiao, Wu, Zhang, Rong, Zhang, Li and Zhong2023), which includes red oxidation zone, transition zone and green reduction zone (Figure 2a). The Tel’aobao uranium deposit is situated in the northern part of the redox transition zone and is associated with the finger-like infiltration and migration of oxygen-containing water from the northern recharge area to the southern discharge zone (Hu et al. Reference Hu, Ling, Xu, Wei, Yang, Lu, Wang, Zhang, Jiang and Zhao2025). The Huanhe Formation, characterized by aeolian and braided fluvial facies in the research area, exhibits two unique properties. (1) The formation is predominantly oxidized (Han et al. Reference Han, Li, Zhang, Luo and Wang2022), with sandstone and mudstone displaying a red hue, followed by green coloration, while primary reducing media, such as plant stems, carbonaceous fragments and pyrite, are not present at the scale of the naked eye (Huang et al. Reference Huang, Liu, Qin and He2023). (2) The strata are divided into upper and lower sections (Liu et al. Reference Liu, He, Yan, Wu and Zhang2022), with sandstone thicknesses ranging from 98.80 to 440.50 m and 109.00 to 349.20 m, and average sand ratios of 96.78% and 96.19%, respectively (Zhang et al. Reference Zhang, He, Li, Liu, Li, Wang, Liu, Li, Zhang and Luo2024). The stratigraphic structure of the sand–mud interbeds, which is conducive to interlayer uranium mineralization, is not well developed.
Geochemical zoning map of the Huanhe Formation. (a) Regional distribution for the redox belts. The blue box highlights the position of Figure 2b. (b) Cross-section showing spatial redox distribution of sandstone units and location of ores.

The industrial ore bodies of this deposit primarily occur in the upper section of the Huanhe Formation (Figure 2b). The uranium ore belt extends approximately 4 km from east to west and varies in width from 400 to 2000 m from north to south (He et al. Reference He, Li, Liu, Zhang, Wang, Liu, Zhang, Qiu and Han2023). These ore bodies are located at depths ranging from 188 to 505 m, with grades between 0.03% and 0.06%, averaging about 0.025% (Qiu et al. Reference Qiu, Li, Zhang, Wang, Li, Han and Wang2024). Their thickness generally ranges from 5 to 20 m, with the thickest sections exceeding 30 m. The uranium content per square metre typically varies from 3 to 10 kg/m2, with some ores reaching approximately 20 kg/m2 (Wang et al. Reference Wang, Yan, Jiao, Wu, Zhang, Rong, Zhang, Li and Zhong2023). A notable feature of this deposit is the presence of multiple-layer ore bodies, with up to ten layers developed vertically within the same sandstone reservoir (Zhang et al. Reference Zhang, He, Li, Liu, Li, Wang, Liu, Li, Zhang and Luo2024). Each individual ore body exhibits a tabular shape, whereas some areas display a lenticular or lamellar appearance (Figure 2b). The lithology of the ores primarily consists of brownish-grey medium-coarse sandstone, followed by green sandstone with varying grain sizes or gravel-bearing coarse sandstone, along with minor occurrences of brown, red and grey fine sandstone (Hu et al. Reference Hu, Ling, Xu, Wei, Yang, Lu, Wang, Zhang, Jiang and Zhao2025). It is important to note that the grade of sandstone ores with a light-oxidized colour tone is higher than that of those with a reduced colour tone.
3. Sampling and methodology
The core samples used in this paper are collected from the Lower Cretaceous Huanhe Formation and are classified into four categories: (1) red non-mineralized sandstones in the oxidized belt, (2) brownish-grey and green mineralized sandstones in the transition belt, (3) (greyish-) green non-mineralized sandstones in the reduced belt and (4) mudstones. Detailed petrological observation and photograph were carried out for these samples in the Tel’aobao uranium deposit; then, they were powdered in an agate mill to 40–200 mesh for whole-rock geochemical analysis at the Testing and Analysis Center of Beijing Research Institute of Uranium Geology, Beijing, China.
3.a. Petro-mineralogical studies
Some representative samples were set in epoxy resin and prepared as polished thin sections of 2 × 5 cm size and 30 μm thickness for optical petrographic and mineralogical studies with a LEICA Camera microscope (Hu et al. Reference Hu, Yang, Wu, Ren and Miao2022). Then, some well-polished thin sections were coated with carbon to improve conductivity and were used to characterize high-resolution textural and chemical variations using a Nova Nano SEM 450 scanning electron microscope (SEM) equipped with an EDAX Genesis energy-dispersive X-ray spectrometer (EDS) (Huang et al. Reference Huang, Qin, Liu, Xiao and Liu2024). The SEM was operated at an accelerating voltage of 15 kV, probe current of 20 nA and beam diameter of 1–5 μm, respectively. The counting time was 20 s for each element, and the precision is ±1.0‰ (Reference Liu, Qin, Huang, Liu and ZhangLiu et al. 2024b ). A set of 5 mineralized samples were selected to quantitatively determine the contents of elements in uranium minerals or altered minerals by an electron microprobe analyser (JXA-8100 Plus) (Table 1). Experimental conditions were set as 1 µm spot diameter, 20 keV accelerating voltage, 20 nA beam current and 30 s integration time (Yan et al. Reference Yan, Zhang, Zhang, Xia, Nie and Wu2023).
Electron probe for uranium minerals within the mineralized sandstones of the Huanhe Formation (wt%)

Table 1. Long description
A table comparing the composition of uranium minerals in different samples. The table has 5 rows and 19 columns. The columns are labeled as Samples, Point, Y 2 O 3, T i O 2, P 2 O 5, A l 2 O 3, S i O 2, F e O, C a O, M n O, U O 2, P b O, C e 2 O 3, Z r O 2, E u 2 O 3, Y b 2 O 3, V 2 O 5, N d 2 O 3, T a t o l, and Mineral type. The rows are labeled with sample identifiers and point numbers. Row 1: w 19-11, 1, 3.23, BDL, 1.35, 1.39, 19.28, 0.22, 1.54, 0.14, 58.93, 0.04, 0.54, 0.12, BDL, 0.22, 0.06, 0.61, 87.77, Cof. Row 2: w 19-11, 2, 3.47, BDL, 1.31, 1.28, 19.13, 0.2, 1.12, 0.12, 60.99, 0.06, 0.28, BDL, BDL, 0.16, 0.22, 0.54, 89.34, Cof. Row 3: w 10-31, 1, 3.4, BDL, 1.24, 0.97, 11.65, 0.19, 2.74, 0.47, 71.48, 0.06, 0.78, BDL, 0.08, 0.11, 1.14, 95.06, Cof. Row 4: w 10-31, 2, 5.09, BDL, 1.89, 0.85, 13.01, 0.2, 2.63, 0.36, 68.41, 0.06, 0.69, 0.12, 0.16, 0.03, 0.89, 94.92, Cof. Row 5: w 19-15, 1, 6.33, 0.15, 2.5, 1.89, 17.52, BDL, 2.14, BDL, 62.24, 0.04, 0.59, BDL, 0.2, BDL, 0.05, 1.43, 94.46, Cof. Row 6: w 19-15, 2, 6.28, BDL, 2.65, 0.93, 17.62, 0.09, 1.99, 0.03, 57.83, 0.38, 0.77, 2.03, 0.11, 0.06, 0.09, 1.95, 93.72, Cof. Row 7: w 31-3, 1, 5.71, 0.25, 0.88, 2.47, 18.09, 6.69, 1.2, 0.08, 19.18, 0.21, 0.25, 13.14, 0.06, 0.42, BDL, BDL, 69.39, Zr-Cof. Row 8: w 31-3, 2, 7.51, 0.27, 1.27, 3.62, 25.08, 7.13, 0.59, 0.12, 23.91, 0.08, 0.16, 17.98, 0.04, 0.52, 0.03, 0.12, 89.51, Zr-Cof. Row 9: w 31-10, 1, 18.06, 0.23, 6.38, 0.94, 14.99, 0.2, 1.86, 0.08, 45.33, 0.09, 0.29, 0.66, 0.1, 0.73, BDL, 0.28, 90.67, Y-Cof. Row 10: w 31-10, 2, 17.15, 2.67, 5.3, 1.38, 16.58, 0.58, 1.67, 0.09, 40.45, 0.07, 0.12, 0.46, 0.16, 0.59, 0.04, 0.28, 87.89, Y-Cof.
Note: BDL, below detection limit; Cof., coffinite; Zr-Cof, zirconium-bearing coffinite; Y-Cof, yttrium-bearing coffinite.
3.b. Whole-rock analysis
Major and trace element concentrations were determined for the whole-rock powders with a size <200 mesh using HNO3+HF dissolution method and high-resolution inductively coupled plasma-mass spectrometry (ICP-MS). The AB104L, Axios-mAX wavelength dispersive X-ray fluorescence spectrometer and ELEMENTXRICP-MS were used for element quantification as reported previously by Zhao et al. (Reference Zhao, Cai, Jin, Li, Li, Wei, Guo and Zhang2018). The relative standard deviations for the analysed elements are better than 5% by referring to the national standard GB/T 14506.
X-ray diffraction (XRD) was performed for 80-mesh powdered samples using a Panalytical X’pert Pro XRD instrument, with an operating voltage of 40 kV and a current of 40 mA (Zhang et al. Reference Zhang, Liu, Zhang, Fayek, Lei and Quan2022). The scanning angle was between 5° and 70° for bulk mineralogy and from 3° to 30° for clay minerals. Further detailed work process followed the standard procedure SY/T 5163-2010 (He et al. Reference He, Hu, Qiu, Wang, Chen, Jia, Li, Ji and Zhu2024).
Total organic carbon and sulphur contents were determined with a CS580A analyser to study the reduction ability of the sandstone samples. The infrared absorption method was adopted for the 200 mesh sample powders on the basis of the standard EJ/T 20154-2018 (Jiang et al. Reference Jiang, Qin, Fan, Jia, Guo, Huang, Ning and Xiao2023). A total of 20 sample powders with a size of 40 meshes were used to measure acid-hydrolysed hydrocarbon contents under the GC7890F gas chromatograph. Statistical results of all the above measurements are shown in Tables 2–6.
X-ray diffraction for the Huanhe Formation in the Tel’aobao uranium deposit, NW Ordos Basin (wt%)

Table 2. Long description
The table presents geochemical belt data for various minerals and compounds. It is divided into two main sections: the first section focuses on quartz, K-feldspar, plagioclase, calcite, analcime, and clay mineral, while the second section focuses on illite-smectite mixed layer, illite, kaolinite, chlorite, and chlorite-smectite mixed layer. Each section is further divided into rows labeled as Oxidation belt, Mineralized belt, Reduction belt, and Mudstone. The table includes specific percentage ranges and average values for each mineral and compound within these belts. Row 1: Oxidation belt, 11 samples. Quartz: 32.3-48.8 percent/41.0. K-feldspar: 4.1-15.1 percent/9.8. Plagioclase: 13.3-40 percent/30.8. Calcite: 2.4-9.2 percent/4.9. Analcime: 3.7-10.8 percent/6.5. Clay mineral: 2.9-28.9 percent/8.7. Row 2: Mineralized belt, 10 samples. Quartz: 33.5-47.1 percent/39.2. K-feldspar: 2.5-14.7 percent/7.6. Plagioclase: 15.9-47.6 percent/27.5. Calcite: 1.6-30 percent/10.2. Analcime: 4.1-13.3 percent/9.0. Clay mineral: 2.4-20.6 percent/8.3. Row 3: Reduction belt, 22 samples. Quartz: 14.8-57.7 percent/36.9. K-feldspar: 4.3-32.4 percent/12.0. Plagioclase: 8.1-41.4 percent/22.2. Calcite: 2.0-22.7 percent/9.4. Analcime: 2.3-51.8 percent/10.8. Clay mineral: 3-40.3 percent/13.4. Row 4: Illite-smectite mixed layer, 19 samples. Quartz: 30-61 percent/40.5. Illite: 11-46 percent/26.7. Kaolinite: 2-20 percent/9.1. Chlorite: 3-34 percent/13.9. Chlorite-smectite mixed layer: 43-73 percent/58.7. I/S ratio: 69-96 percent/78.8. C/S ratio: 31-89 percent/49.2. Row 5: Mineralized belt, 15 samples. Quartz: 5-90 percent/53.6. Illite: 6-77 percent/34.0. Kaolinite: 2-14 percent/6.7. Chlorite: 2-29 percent/13.1. Chlorite-smectite mixed layer: 16-74 percent/43.7. I/S ratio: 40-95 percent/74.3. C/S ratio: 36-71 percent/56.7. Row 6: Reduction belt, 24 samples. Quartz: 13-83 percent/44.2. Illite: 4-42 percent/18.2. Kaolinite: 3-23 percent/8.7. Chlorite: 3-35 percent/12.9. Chlorite-smectite mixed layer: 52-89 percent/70.3. I/S ratio: 5-86 percent/69.0. C/S ratio: 20-95 percent/55.8. Row 7: Mudstone, 24 samples. Quartz: 24-57 percent/39.0. Illite: 8-57 percent/28.4. Kaolinite: 3-15 percent/6.7. Chlorite: 3-22 percent/13.2. Chlorite-smectite mixed layer: 6-56 percent/25.3. I/S ratio: 5-8 percent/6.1. C/S ratio: 24-82 percent/54.7.
Note: (Minimum–Maximun)/Average.
Major elements for the Huanhe Formation in the Tel’aobao uranium deposit, NW Ordos Basin (wt%)

Table 3. Long description
The table presents the major elements in the Huanhe Formation across different geochemical belts in the Telaobao uranium deposit, NW Ordos Basin, measured in weight percentages. It is divided into three main sections based on geochemical belts: Oxidation belt, Mineralized belt, and Reduction belt. Each section lists the minimum, maximum, and average values for various elements. The table has 3 sections, 11 rows, and 12 columns. The columns are labeled as follows: Geochemical belt, Num., Values, Si, Al, Fe, MgO, CaO, Na, K, MnO, Ti, P, FeO. The rows are labeled with the type of belt and the number of samples analyzed. The elements measured include Silicon (Si), Aluminum (Al), Iron (Fe), Magnesium Oxide (MgO), Calcium Oxide (CaO), Sodium (Na), Potassium (K), Manganese Oxide (MnO), Titanium (Ti), Phosphorus (P), and Iron Oxide (FeO). Row 1: Oxidation belt, 11, Min, 64.37, 12.25, 1.87, 0.84, 0.81, 2.85, 1.99, 0.04, 0.22, 0.07, 1.82. Row 2: Oxidation belt, 11, Max, 73.79, 13.07, 7.02, 3.41, 4.42, 4.14, 2.67, 0.10, 0.55, 0.10, 5.17. Row 3: Oxidation belt, 11, Average, 71.21, 12.55, 3.11, 1.37, 2.34, 3.67, 2.25, 0.06, 0.35, 0.08, 1.70. Row 4: Mineralized belt, 5, Min, 60.18, 12.43, 1.52, 0.653, 1.06, 2.9, 2.17, 0.06, 0.316, 0.084, 2.5. Row 5: Mineralized belt, 5, Max, 72.82, 15.18, 6, 3.75, 4.45, 4.12, 2.43, 0.102, 0.623, 0.165, 6.19. Row 6: Mineralized belt, 5, Average, 66.91, 13.46, 3.52, 2.03, 2.79, 3.63, 2.28, 0.08, 0.51, 0.13, 2.07. Row 7: Reduction belt, 7, Min, 67.95, 12.03, 2.03, 1.03, 1.42, 2.92, 1.98, 0.04, 0.25, 0.07, 2.21. Row 8: Reduction belt, 7, Max, 73.41, 12.98, 3.75, 1.71, 3.17, 3.98, 2.47, 0.08, 0.51, 0.14, 3.67. Row 9: Reduction belt, 7, Average, 71.09, 12.67, 2.79, 1.38, 2.46, 3.67, 2.23, 0.06, 0.39, 0.10, 1.60.
Trace and rare earth elements for the Huanhe Formation in the Tel’aobao uranium deposit, NW Ordos Basin (μg/g)

Table 4. Long description
The table presents data on trace and rare earth elements for the Huanhe Formation in the Telaobao uranium deposit, NW Ordos Basin, measured in micrograms per gram. It is divided into three geochemical belts: Oxidation belt, Mineralized belt, and Reduction belt. Each belt has minimum, maximum, and average values for various elements. The table is organized into three main sections, each corresponding to a different geochemical belt. Each section lists the minimum, maximum, and average values for elements such as Li, Be, Sc, V, Cr, Co, Ni, Cu, Zn, Ga, Rb, Sr, Y, Mo, Cd, In, Sb, Cs, Ba, W, Re, Tl, Pb, Bi, Th, U, La, Ce, Pr, Nd, Sm, Eu, Gd, Tb, Dy, Ho, Er, Tm, Yb, Lu, REE, LREE, HREE, LREE/HREE, La/Yb, and Eu/Ce. For example, in the Oxidation belt, the minimum value for Li is 12.5, the maximum is 26.9, and the average is 17.02. Similarly, the Mineralized belt and Reduction belt sections follow the same format. The table provides a comprehensive comparison of the distribution of these elements across different geochemical belts, highlighting variations and trends in their concentrations.
Organic carbon and total sulphur value of the Huanhe Formation in the Tel’aobao uranium deposit, NW Ordos Basin (wt%)

Table 5. Long description
The table presents data on organic carbon and total sulphur values in the Huanhe Formation of the Telaobao uranium deposit, NW Ordos Basin. It is organized into three main geochemical belts: Oxidation belt, Mineralized belt, and Reduction belt. Each belt has associated minimum, maximum, and average values for total organic carbon and total sulphur. The table has three columns: Geochemical belt, No. Values, Total organic carbon, and Total sulphur. Row 1: Geochemical belt, Oxidation belt, 8. Row 2: Min, 0.039, 0.004. Row 3: Max, 0.127, 0.013. Row 4: Average, 0.071, 0.007. Row 5: Geochemical belt, Mineralized belt, 5. Row 6: Min, 0.05, 0.008. Row 7: Max, 0.066, 0.074. Row 8: Average, 0.058, 0.0298. Row 9: Geochemical belt, Reduction belt, 7. Row 10: Min, 0.044, 0.002. Row 11: Max, 0.1, 0.017. Row 12: Average, 0.072, 0.007.
Acid hydrolysed hydrocarbon content for the Huanhe Formation in the Tel’aobao uranium deposit, NW Ordos Basin (μL/kg)

Table 6. Long description
A table showing the acid hydrolysed hydrocarbon content for various sandstone samples from the Huanhe Formation in the Tel’aobao uranium deposit. The table has 8 rows and 9 columns. The columns are labeled as follows: Samples, CH4, C2H6, C3H8, i-C4H10, n-C4H10, i-C5H12, n-C5H12, and Total. The row labels are W2019-2, W2019-3, W2019-4, W2019-5, W2019-6, W2019-7, Y63-214, Y63-215, and Y63-217. The values in the table are as follows: Row 1: W2019-2, 2002, 177, 90.2, 18.8, 11.3, 3.08, 2.26, 2304.64. Row 2: W2019-3, 989, 92.2, 33.2, 8.93, 5.18, 1.58, 1.01, 1131.1. Row 3: W2019-4, 5456, 560, 310, 65.0, 45.0, 10.0, 6.00, 6452. Row 4: W2019-5, 22.6, 1.02, 0.48, 0.24, 0.13, 0.08, 0.05, 24.6. Row 5: W2019-6, 44.2, 2.69, 1.15, 0.36, 0.19, 0.10, 0.08, 48.77. Row 6: W2019-7, 28.7, 1.25, 0.61, 0.30, 0.14, 0.08, 0.07, 31.15. Row 7: Y63-214, 47.1, 2.72, 1.29, 0.49, 0.22, 0.11, 0.08, 52.01. Row 8: Y63-215, 1208, 123, 40.4, 10.6, 6.18, 1.98, 1.20, 1391.36. Row 9: Y63-217, 995, 96.3, 35.0, 8.76, 6.13, 1.97, 1.14, 1144.3.
3.c. Stable isotopes analysis
Ten dense sandstone samples with calcite cementation were selected for carbon and oxygen isotopic analyses with a Thermo Fisher MAT 253 mass spectrometer. Meanwhile, the sulphur isotope composition of ten samples was then measured using a Delta V Plus gas source mass spectrometer. The national standard reference materials NBS19 (limestone, δ 13C=+1.95‰, δ 18O=−2.20‰) and LTB-2 (δ 34S=+1.84‰) was used as internal standard (Hu et al. Reference Hu, Yang, Wu, Ren and Miao2022). Detection limits are ±0.10‰, ±0.15‰ and ±0.2‰ for δ13C, δ 18O and δ 34S, respectively. The isotope data are summarized and shown in Table 7.
Whole-rock carbon–oxygen–sulphur isotopes of the Huanhe Formation in the Tel’aobao uranium deposit, NW Ordos Basin (wt ‰)

Table 7. Long description
The table presents data on lithology and isotope compositions of sandstone samples from the Huanhe Formation in the Telʼaobao uranium deposit, NW Ordos Basin. It includes two main sections with columns for sample identifiers, lithology descriptions, and various isotope measurements. The first section has columns for Samples, Lithology, δ13CVPDB, δ18OVPDB, and δ18OVSW. The second section has columns for Samples, Lithology, and Δ34SVCDT. The table contains data for 20 samples, detailing their lithology and corresponding isotope values. Each row provides specific measurements for each sample, allowing for comparisons across different lithologies and isotope compositions.
3.d. Dating for uranium mineralization
The low grade of the sandstone ores impedes the selection of discrete coffinite particles for dating (Xia et al. Reference Xia, Lin, Liu, Fan and Hou2003; Liu et al. Reference Liu, Xia and Tian2007). This challenge is further exacerbated by the fact that the coffinite grains are typically micro-sized (Doynikova and Petrov, Reference Doynikova and Petrov2022), falling below the spatial resolution limits of in-situ techniques such as laser ablation-inductively coupled plasma-mass spectrometry (LA-ICP-MS) and secondary ion mass spectroscopy (SIMS), which require a larger minimum beam spot size (Corcoran and Simonetti, Reference Corcoran and Simonetti2020; Wen et al. Reference Wen, Zhu and Cheng2023). In this study, both whole-ore U-Pb isotopic dating and electron microprobe analysis (EMPA) chemical dating method were applied to constrain the ages of multi-stage uranium mineralization (Table 8). A total of five sandstone ores from ZKW20-1 drill were used to obtain the isotope compositions of uranium and lead by using ISOPROBE-T thermal surface ionization mass spectrometer, and thus utilized to fit the isochronal ages (Ludwig et al. Reference Ludwig, Simmons and Webster1984). Twenty-two elements (Y, Ti, P, Al, Si, Fe, Ca, Mn, La, Hf, Ce, Zr, Eu, Mo, Yb, Nb, V, Lu, Nd, Pb, Th and U) were analysed for the coffinite grains using an accelerating voltage of 15 kV, a beam current of 40 nA and a beam size of 2 μm as experimental conditions. To enhance the accuracy of the chemical age, counting time of peaks and backgrounds for U, Th and Pb were 120 and 60 s, respectively, and those for all the other elements were 40 and 20 s (Hu et al. Reference Hu, Yang, Wu, Ren and Miao2022). The analytical uncertainties were <1% for major elements and <10% for trace elements. The chemical ages for uranium minerals were calculated from the U, Th and Pb contents obtained by electron microprobe analysis (EPMA) using the equation and age determination software provided by Bowles (Reference Bowles2015). Other standard analytical procedures and conditions are described by Zhao et al. (Reference Zhao, Cai, Jin, Li, Li, Wei, Guo and Zhang2018).
Whole-rock U-Pb isotopes and EMPA dating for uranium minerals in the Tel’aobao uranium deposit, NW Ordos Basin

Table 8. Long description
The table presents data on uranium and lead isotopic compositions and chemical analyses of sandstone ores from the Tel’aobao uranium deposit. It is divided into two main sections: whole-ore U-Pb isotopic dating and electron microprobe analysis (EMPA) chemical dating. The first section includes columns for sample IDs, uranium (U) content in micrograms per gram, radium (Ra) content in becquerels per gram, lead (Pb) content in micrograms per gram, and various lead isotopic ratios (238U/204Pb, 208Pb/204Pb, 207Pb/204Pb, 206Pb/204Pb), along with the method used. The second section includes columns for sample IDs, analysis points, uranium dioxide (UO2) content in percent, lead oxide (PbO) content in percent, thorium dioxide (ThO2) content in percent, age in million years (T/Ma), and the method used. The table lists data for multiple samples and analysis points, providing detailed isotopic and chemical information.
Note: t = 7550Pb / (U + 0.365Th), U, Th and Pb are the mass percentage of uranium mineral, %; T is the formation age of uranium mineral, Ma; BDL, below detection limit.
4. Result analysis
4.a. Petrography and mineralogy
4.a.1. Non-meneralized sandstone
Macroscopic field and microscopic observations indicate that both the red and green non-mineralized sandstone samples exhibit consistent litho-facies (Figure 3). Their mineral composition is dominated by quartz, lithic fragments and feldspar – specifically microcline showing grid twinning and perthite with clustered twinning – along with biotite and muscovite. Lithic fragments are primarily composed of granite and acidic volcanic rocks, with subordinate metamorphic lithologies such as mica schist and mica quartzite. Trace amounts of heavy minerals, including zircon, apatite, barite, pyrite and Fe–Ti oxides, were also observed under optical microscopy. Additionally, these sandstones are generally poorly consolidated (Figure 3a–b, f), dominated by a clay-rich matrix with minor calcareous cement present locally (Figure 3c–d, g). They show poor sorting and moderate roundness, with clasts ranging from subangular to subrounded. Between the rock fragments, particle-supported fabric and basal structures can be identified, typically as point or point-line contacts (Figure 3c–d, g–h). These features collectively indicate that the target stratum experienced shallow burial process throughout its geological history (Lin et al. Reference Lin, Fan, Ni, Pan, Jin, Cheng, Cui, Cheng, Li, Zhu, Zhu and Li2025), leading to weak compaction and limited diagenesis (Shikazono and Utada, Reference Shikazono and Utada1997).
Macro-microscopic characteristics of the red and green sandstone from the Huanhe Formation in the Tel’aobao deposit. (a) Greenish-red coarse sandstone. (b) Red sandstone bearing black carbonaceous fragment, which indicates epigenetic oxidation origin. (c) Lithic sandstone with basal cementation, with haematitization occurring at the edge of debris and calcite. (d, e) Globular pyrite oxidation residual occurred in the red sandstone. (f) Green coarse sandstone. (g) Red oxidation residue and calcite within green sandstone, and green rim occurred at the edge of fragment. (h, i) BSE images showing the smectite and chlorite within the matrix or at the edges of debris, which indicates alkaline alteration for the green sandstone. (j) SEM–EDS spectrum showing the close coexisation of amorphous organic matter, framboïdal pyrite and chlorite. Hm: haematitization; Q: quartz; Cal: calcite; Lv: volcanic debris; Fe-O: iron oxide; Lm: metamorphic rock debris; Ms: mica schist; Sm: smectite; Chl: chlorite; Om: organic matter; Pl: plagioclase; Py: pyrite.

In addition, the red sandstone has undergone extensive haematite alteration. At the macroscopic scale, differential oxidation is reflected in colour variations (Figure 3a), and occasional black oxidized carbonaceous debris can be observed (Figure 3b). Significant iron staining is developed within the matrix and along the edges of debris (Figure 3c–d). Locally, framboidal pyrite oxidation features are commonly found in the matrix (Figure 3d), with clear evidence observed in Figure 3e. These characteristics collectively indicate epigenetic oxidation processes, consistent with findings reported by Rackley (Reference Rackley1972) and Dong et al. (Reference Dong, Xiao, Ma, Deng and Cai2023). Generally, the green sandstone exhibits reductive characteristics under both macroscopic and microscopic examination, with the edges of debris often showing greenish clay alteration (Figure 3f). However, sporadic red haematite residues are occasionally observed in certain areas (Figure 3g), sometimes completely embedded within calcareous cement. Backscattered electron (BSE) images reveal that the greenish tint of the sandstone is largely due to the presence of abundant montmorillonite and chlorite (Figure 3g–i), whereas amorphous organic matter is closely associated with framboidal pyrites (Figure 3j).
4.a.2. Sandstone ores
The sandstone ore from the Huanhe Formation of the study area exhibits two dominant colours (Figure 4a): predominantly brownish-grey (Figure 4b), with green as a secondary hue (Figure 4c). Notably, these sandstone ores contain almost no visible typical reducing agents such as carbonaceous debris or pyrite grains. Their lithological characteristics are consistent with those of the red and green nonmineralized sandstones, featuring loose cementation and classified as lithic sandstones (Figure 4d). In some instances, mica minerals appear weakly deformed or undeformed, showing elongated to short-columnar shapes and a distinct directional alignment. Compared with green ore, the brownish-grey ore typically contains higher amounts of red iron oxides and calcite within its matrix, which likely contributes significantly to its distinct coloration. Calcite can also be observed weakly replacing the margins of lithic fragments and occasionally infilling fractures or intercrystalline spaces within quartz grains (Figure 4e), indicating an epigenetic origin (Bailey et al. Reference Bailey, Kirk, Hemming, Krantz and Reiners2021).
Macro-microscopic characteristics of the two types mineralized sandstones and their back-scattered electron mode images of uranium minerals. (a) Sandstone ores with two distinctive colours. (b) Brownish-grey mineralized sandstone. (c) Green mineralized sandstone. (d) Lithic sandstone with basal cementation and green rim. (e) Earlier haematitization occurring within calcite cements. (f) Coffinite microspherules grew within the poles of feldspar, associated with a little rutile. (g) BSE image showing aboundant coffinite occurred at the edge of debris, accompanied by a few colloidal pyrites and iron oxides. (h) Rice-shaped coffinite granules on the surface of clay mineral. (i) Titanium-bearing uranium mineral aggregates. Q: quartz; Pl: plagioclase; Qp: polycrystalline quartz; Mi: microcline feldspar; Bit: biotite; Mu: muscovite; Cal: calcite; Ms: mica schist; Hm: haematitization; Cof: coffinite; Ru: Rutile; Lm: metamorphic rock debris.

Figure 4. Long description
The image contains nine panels showing different types of mineralized sandstones and their microscopic characteristics. Panel A: A photo showing sandstone ores with two distinctive colors, labeled as reduced-tone ore and oxidized-tone ore. Panel B: A photo of brownish-gray mineralized sandstone. Panel C: A photo of green mineralized sandstone. Panel D: A microscopic image of lithic sandstone with basal cementation and a green rim, labeled with various minerals such as quartz, plagioclase, polycrystalline quartz, microcline feldspar, biotite, muscovite, and mica schist. Panel E: A microscopic image showing earlier hematitization occurring within calcite cements, labeled with minerals like quartz, calcite, biotite, and hematitization. Panel F: A back-scattered electron mode image showing coffinite microspherules grew within the poles of feldspar, associated with a little rutile, labeled with plagioclase, coffinite, and rutile. Panel G: A back-scattered electron mode image showing abundant coffinite occurred at the edge of debris, accompanied by a few colloidal pyrites and iron oxides, labeled with quartz, plagioclase, polycrystalline quartz, microcline feldspar, biotite, muscovite, calcite, mica schist, hematitization, coffinite, and rutile. Panel H: A microscopic image showing rice-shaped coffinite granules on the surface of clay mineral. Panel I: A back-scattered electron mode image showing titanium-bearing uranium mineral aggregates, labeled with plagioclase, coffinite, and metamorphic rock debris.
4.a.3. Occurrence and compositions of uranium minerals
SEM observations and EDS analyses reveal that coffinite is the dominant uranium mineral type in the ore (Figure 4f–h), followed by U–Ti aggregates (Figure 4i). EMPA data further indicate that coffinite contains 57.83–71.48% UO2, 11.65–19.29% SiO2, and 1.31–2.65% P2O5 (Table 1). Zirconium-bearing coffinite (Zr-cof) and yttrium-bearing coffinite (Y-cof) were also identified, with ZrO2 and Y2O3 contents ranging from 13.14% to 17.98% and 5.71% to 18.06% (Table 1), respectively. These uranium minerals are mainly distributed along the margins of detrital grains, with additional occurrences in the intergranular matrix, as well as within pores or dissolution cavities of detrital minerals; and pyrite, iron oxides and the montmorillonitization or chloritization of feldspar are developed in adjacent areas (Figure 4f–g). BSE images of whole-ore show that coffinite predominantly displays short-columnar and rice-grain morphologies (Figure 4h), indicating relatively high crystallinity (Deditius et al. Reference Deditius, Utsunomiya and Ewing2008). Abundant fine-grained, colloidal U-Ti aggregates also occur within the interstitial network of Ti-bearing detrital minerals (Figure 4i). Nevertheless, uranium minerals are not exclusively bound to particular host phases, suggesting that uranium precipitated wherever local geochemical barriers were available within the ore system (Goldhabe et al. Reference Goldhaber, Hemingway, Mohagheghi, Reynolds and Northrop1987; Doynikova and Petrov, Reference Doynikova and Petrov2022).
4.b. XRF results
Whole-rock XRD analyses indicate that the principal detrital components of the host sandstones are broadly consistent across different geochemical zones (Table 2; Figure 5a). Quartz is the dominant mineral, with average contents of 41%, 39.2% and 36.9%, followed by plagioclase (averaging 30.8%, 27.5% and 22.2%). Minor constituents include potassium feldspar (9.8%, 7.6%, 12%), calcite (4.9%, 10.2%, 9.4%) and analcime (6.5%, 9.0%, 10.8%). The clay mineral compositions of both mudstone and sandstones are also similar (Table 2; Figure 5b), being composed predominantly of illite–smectite (I/S) (averaging 40.5%, 53.6%, 44.2% and 39%) and chlorite–smectite (C/S) mixed layer clays (averaging 58.7%, 74.3%, 70.3% and 25.3%). The content of kaolinite (averaging 9.1%, 6.7%, 8.7% and 6.7%) and chlorite (averaging 13.9%, 13.1%, 12.9% and 13.2%) is relatively low. These mineralogical features reflect arid-hot paleoclimatic conditions and an alkaline pore-water environment during the sedimentary period (Jiang et al. Reference Jiang, Qin, Fan, Jia, Guo, Huang, Ning and Xiao2023; Chen et al. Reference Chen, Yang, Jiang, Wang, Qiu and Habulashenmu2025). Furthermore, compared with other sandstone types, the green sandstone exhibits a lower illite content but a higher proportion of chlorite–smectite (C/S) mixed-layer clays, with average values of 18.2% and 70.3%, respectively (Table 2). The content of the C/S and I/S mixed layer in various sandstone zones is significantly higher than that in mudstone (Figure 5b), and the illite content also exhibits notable variations.
Bulk mineral compositions (a) and relative contents of clay minerals (b) for the different samples of the Huanhe Formation in the Tel’aobao uranium deposit.

4.c. Characteristics of major and trace elements
The analytical data for constant elements in different sandstone types are summarized in Table 3. Most of these stable elements show a high degree of consistency; for example, the average sodium (Na) and potassium (K) contents are approximately 3.6% and 2.2%, respectively. In mineralized sandstone, however, some elements exhibit varying degrees of enrichment. Notably, certain alkaline earth elements such as magnesium (Mg) and calcium (Ca) are slightly enriched, with average contents reaching 2.03% and 2.79%, respectively. The variable valence elements generally show low to moderate enrichment. Specifically, the contents of total iron (TFe), ferrous oxide (FeO) and manganese (Mn) are 3.52%, 2.07% and 0.08%, respectively. Titanium (Ti) and phosphorus (P) exhibit more significant enrichment, with respective ranges of 0.316–0.623% (avg. 0.51%) and 0.084–0.165% (avg. 0.13%). In contrast, silicon (Si) content shows a slight decrease, averaging 66.91%. Furthermore, total iron is notably depleted in green sandstone, with an average content of only 2.79%.
As shown in Table 4 and Figure 6a, the concentrations of most trace elements across the three geochemical zones do not differ significantly, with the notable exception of uranium (U). Uranium is markedly enriched in mineralized sandstone, ranging from 18.2 to 212 ppm with an average of 75.88 ppm. In contrast, non-mineralized sandstones from both the oxidation and reduction zones also exhibit relatively elevated U contents, varying from 4.19 to 9.5 ppm and from 4.12 to 13.7 ppm, respectively. Other elements, including lithium (Li), vanadium (V), cobalt (Co), copper (Cu), zinc (Zn), yttrium (Y) and cesium (Cs), also show slight enrichment in mineralized sandstone, with average concentrations of 24.16, 87.94, 12.33, 18.54, 51.8, 19.62 and 7.03 ppm, respectively.
Upper continental crust-normalized trace elements distribution patterns (a) and chondrite-normalized REES (b) of different type sandstones from the Huanhe Formation in the Tel’aobao uranium deposit. Chondrite- and primitive mantle-normalized data are taken from Sun and McDonough (Reference Sun and McDonough1989), UCC normalization values from Taylor and McLennan (Reference Taylor and McLennan1985).

Figure 6. Long description
Two line graphs compare trace elements and rare earth elements in different sandstone types from the Huanhe Formation in the Telaobao uranium deposit. Panel A: A line graph shows the distribution patterns of trace elements normalized to the upper continental crust. The x-axis lists various elements, including Li, Be, Se, V, Cr, Co, Ni, Cu, Zn, Ga, Rb, Sr, Y, Mo, Cd, In, Sb, Cs, Ba, W, Re, Tl, Pb, Bi, Th, and U. The y-axis represents the Rock/UCC ratio on a logarithmic scale ranging from 0.001 to 1000. Different symbols and colors represent data from oxidation belts, mineralized belts, reduction belts, and upper continental crust (UCC). Notable trends include peaks at certain elements like Mo, Cd, and U, with variations across different belts. Panel B: Another line graph displays the chondrite-normalized rare earth elements (REEs) distribution. The x-axis lists REEs from La to Lu, and the y-axis shows the Rock/Chondrite ratio on a logarithmic scale ranging from 0.1 to 1000. Similar to Panel A, different symbols and colors represent data from oxidation belts, mineralized belts, reduction belts, and UCC. The graph shows a decreasing trend from La to Lu, with some variations among the different belts.
Table 4 and Figure 6b show that although the red and green sandstones have broadly similar rare earth element (REE) characteristics, the green sandstone displays a slight enrichment in light rare earth elements (LREEs). Specifically, the green sandstone records LREE and REE average values of 117.44 and 121.34 ppm, respectively, compared with 107.96 and 111.69 ppm for the red oxidized sandstone. The REEs in mineralized sandstones show varying degrees of enrichment with the contents of LREE, heavy rare earth elements (HREEs) and REE, reaching 129.18, 13.29 and 142.47 ppm, respectively. Notably, the enrichment of HREE is more pronounced, which is reflected in lower LREE/HREE and La/Yb ratios averaging 10.01 and 15.87. The sandstone samples from the three geochemical zones show average δEu values of 0.95, 0.80 and 0.88, respectively, with a consistent average δCe value of 0.96. This geochemical signature indicates a europium deficit and suggests that the ore-bearing sandstones were characterized by relatively strong reducing conditions (Floyd and Leveridge, Reference Floyd and Leveridge1987; Dana et al. Reference Dana, Cesari, Montomoli, Laccarino, Corno, Rubatto and Carosi2025).
4.d. Reduction capacities
The mineralized sandstone exhibits the highest reduction capacity, as shown in Table 5, with total organic carbon (TOC) and total sulphur content (TSC) ranging from 0.05% to 0.066% (avg. 0.058%) and from 0.008% to 0.074% (avg. 0.0298%), respectively. In contrast, non-mineralized sandstones from both the oxidation and reduction zones show low reduction capacity, with average TOC and TSC of 0.07% and 0.007%, respectively.
According to Table 6, the total hydrocarbon content in ten tight sandstones ranges from 24.6 to 6452 μL/kg, suggesting that abundant light hydrocarbon fluids are preserved within the calcareous cement of the sandstone (Huang et al. Reference Huang, Qin, Liu, Xiao and Liu2024). Methane is the predominant component, with concentrations ranging from 22.6 to 5456 μL/kg, followed by ethane (1.02–560 μL/kg) and propane (0.48–560 μL/kg). Other hydrocarbons such as butane and pentane are present in very low amounts.
4.e. C-O-S isotopic compositions
As presented in Table 7, with the exception of sample W0-31-14, which has a carbon isotope value (δ 1 3CV-PDB) of –7.6‰, all other samples show similar δ 1 3C values ranging from –2.3‰ to –1.1‰. Oxygen isotope compositions are likewise consistent, with δ 18O values between –14.6‰ and –12‰ relative to V-PDB, and between 15.9‰ and 18.1‰ relative to V-SMOW. All sulphur isotope values are negative and can be divided into two groups: samples W20-1-28 and Y63-216 yield relatively heavier δ 34S values of –7‰ and –7.5‰, respectively, whereas the remaining samples display significantly lighter δ 34S values, ranging from –38.7‰ to –19.1‰.
4.f. Dating results
As shown in Table 8, the uranium (U) and lead (Pb) contents in sandstone ores range from 61.9 to 425 ppm and 5.5 to 80.9 ppm, respectively, and the radium (Ra) content varies from 0.752 to 4.84 Bq/g. The measured isotopic ratios are as follows: 238U/204Pb = 49.57–8895.049, 208Pb/204Pb = 39.223–40.724, 207Pb/204Pb = 15.752–19.189 and 206Pb/204Pb = 19.05–79.331. Data from three samples (W20-1-14, W20-1-23 and W20-1-26) define an isochron corresponding to an age of 53.8 ± 6.3 Ma (Figure 7a), with an initial 206Pb/204Pb ratio of 28.9 ± 2.7 and a mean square weighted deviation (MSWD) of 1.7 (Liu et al. Reference Liu, Xia and Tian2007). Previous studies employing the same methodology have identified four age clusters (Wang et al. Reference Wang, Yan, Jiao, Wu, Zhang, Rong, Zhang, Li and Zhong2023; He et al. Reference He, Li, Liu, Zhang, Wang, Liu, Zhang, Qiu and Han2023; Han et al. Reference Han, Li, Qiu, Zhang and Wang2025): 117.8 ± 6.2 Ma, 112.5 ± 18.1 Ma, 108.6 ± 8.2 Ma and 106.98 ± 9.49 Ma (Figure 7b–e).
Whole-ores U-Pb isochronal age (a–e) and EMPA chemical ages of uranium minerals (f) from mineralized sandstones in the Tel’aobao uranium deposit. (b): Han et al. Reference Han, Li, Qiu, Zhang and Wang2025; (c–d): Wang et al. Reference Wang, Yan, Jiao, Wu, Zhang, Rong, Zhang, Li and Zhong2023; (e): He et al. Reference He, Li, Liu, Zhang, Wang, Liu, Zhang, Qiu and Han2023.

Further EMPA chemical dating of uranium minerals from five samples shows that UO2 content ranges from 16.61% to 71.43%, while PbO and ThO2 range from 0.04% to 0.77% and 0.08% to 0.64%, respectively (Table 8). Based on the calculate scheme of Bowles (Reference Bowles2015), a set of 18 accurate ages are between 4.45 and 134.43 Ma. These EMPA chemical ages fall into four stages: Early Cretaceous, Late Cretaceous, Paleogene and Neogene (Figure 7f).
5. Discussion
5.a. Reservoir properties
Investigating the primary characteristics of the ore-bearing strata is essential for understanding epigenetic uranium mineralization in sandstones(Hall et al. Reference Hall, Mihalasky, Tureck, Hammarstrom and Hannon2017; Xiang et al. Reference Xiang, Jiao, Wu, Rong and Zhang2022; Ji et al. Reference Ji, He, Zhong, Chen, Zhu, Wu and Dong2023). Inert element geochemistry indicates that stable element concentrations in the Huanhe Formation of the Tel’aobo deposit have not been significantly modified by subsequent fluid activity (Tables 4 and 5), thus reliably preserving information about source rock composition in the provenance area (Mclennan et al. Reference Mclennan, Hemming, Mcdaniel and Hanson1993; Chen et al. Reference Chen, Yang, Jiang, Wang, Qiu and Habulashenmu2025).
5.a.1. Composition of source rocks
The geochemical composition of all sandstones studied falls within the field of felsic volcanic rocks, as indicated by both the F1–F2 discrimination diagram (Figure 8a) and the La/Th–Hf provenance diagram (Figure 8b). The Al2O3/TiO2 ratios of sandstones from the three geochemical zones range 22.7–58.7, 22.9–40.7 and 25.1–50.6, respectively, all of which lie within the 21–70 range typical of felsic igneous rocks. The corresponding Th/Sc ratios are 0.7–1.42, 0.7–1.24 and 0.62–0.96 (Figure 8c). These geochemical indices collectively suggest that the source material of the Huanhe Formation is predominantly intermediate to acidic volcanic rocks characterized by a high uranium background (Sun and McDonough, Reference Sun and McDonough1989). These source rocks are rich in silicon and aluminium derived from the continental crust, indicating an abundant external uranium supply for the ore-bearing layer (Taylor and McLennan, Reference Taylor and McLennan1985; Hall et al. Reference Hall, Van Gosen and Zielinski2023). Further evidence includes the abundance of granite and acidic volcanic rock fragments observed in the sandstone (Figures 3 and 4). The average uranium content in red and green non-mineralized sandstones is as high as 6.8 and 7.46 mg/kg, respectively (Table 4), significantly exceeding the typical average values of c. 1.8 and c. 3.0 mg/kg reported for sandstones of similar colour in sedimentary basins (Hu et al. Reference Hu, Yang, Wu, Ren and Miao2022; Liu et al. Reference Liu, Qin, Huang, Liu and Zhang2024 b).
Indexes for provenance and paleo-environment of the Huanhe Formation. (a, b) Main and trace elements indicating the composition of source rocks, base diagram from Floyd & Leveridge, 1987. (c) Representative environmental geochemical indexes. (d) Identification diagram for paleoclimate, base diagram from Mclennan, 1993. F1 = −1.773TiO2 + 0.607Al2O3 + 0.76TFe2O3-1.5MgO + 0.616CaO + 0.509Na2O-1.224K2O-9.09; F2 = 0.445TiO2 + 0.07Al2O3-0.25TFe2O3-1.142MgO + 0.438CaO + 1.475Na2O + 1.426K2O-6.861.

Figure 8. Long description
The image contains four panels, each depicting different types of graphs related to the provenance and paleo-environment indexes of the Huanhe Formation. Panel A shows a scatter plot with axes labeled F1 and F2, indicating the composition of source rocks. The plot includes data points categorized into oxidation zone, mineralized zone, and reduction zone, with different symbols representing each zone. Panel B presents another scatter plot with axes labeled La/Th and Hf, showing the trace elements indicating the composition of source rocks. The plot includes regions labeled with different geological materials and origins, such as tholeiite oceanic island arc material, lower crust, and upper crust. Panel C is a bar graph with multiple bars representing different environmental geochemical indexes like Sr/Ba, V/Cr, Ni/Co, V/(V+Ni), Th/Sc, Al/Ti, and Sr/Cu. The bars are categorized into oxidation zone, mineralized zone, and reduction zone, with different colors representing each index. Panel D is a scatter plot with axes labeled SiO2 percent and Al2O3 + K2O + Na2O percent, identifying the paleoclimate. The plot includes regions labeled as semi-humid, humid, semi-arid, and arid, with data points categorized into oxidation zone, mineralized zone, and reduction zone.
5.a.2. Ancient climate and paleo-lacustrine water
According to the paleoclimate discriminant diagram of SiO2–(Al2O3+K2O+Na2O) (Figure 8d), all sandstone samples plot within the semi-arid climate field (Hu et al. Reference Hu, Ling, Xu, Wei, Yang, Lu, Wang, Zhang, Jiang and Zhao2025). The Sr/Cu ratios are notably higher than 5, with values ranging from 23 to 68.5, 15.1 to 79.1 and 27.3 to 94.4, respectively (Figure 8c). These geochemical features collectively suggest that the studied strata were deposited under (semi)arid-hot paleoclimatic conditions (Jiang et al. Reference Jiang, Qin, Fan, Jia, Guo, Huang, Ning and Xiao2023). The V/Cr ratios of sandstones from the three geochemical zones show distinct variation, ranging from 0.17 to 0.76, 0.15 to 2.91 and 0.23 to 0.62, respectively (Figure 8c), reflecting slight vanadium enrichment in mineralized sandstones (Ren et al. Reference Ren, Yang, Miao, Hu, Chen, Chen and Zhao2022). Meanwhile, the V/(V+Ni) ratios are relatively uniform across the zones, with values of 0.71–0.84, 0.67–0.86 and 0.72–0.85, respectively. The Ni/Co ratios range from 1.8 to 2.7, 1.1 to 2.2 and 2.1 to 2.5, respectively (Figure 8c), indicating collectively that the ancient lacustrine water during deposition was oxygenated and exhibited moderate redox stratification (Mclennan et al. 1993).
5.a.3. Native environment
The Huanhe Formation is a typical red-variegated rock series with primary oxidative nature in the Ordos Basin (Wu et al. Reference Wu, Yu, Zhou and Zhu2005). In this study, the TOC in all coloured sandstones is below 0.1%, with averages ranging from 0.058% to 0.072%. The average TSC in both red and green sandstones is about 0.007% (Table 5). These results indicate that the original carbonaceous debris and pyrite concentrations in the Huanhe Formation are very low, leading to limited initial reducing capacity (Han et al. Reference Han, Li, Zhang, Luo and Wang2022). This conclusion is consistent with the observed scarcity of visible carbonaceous debris and pyrite in hand specimens of the sandstones.
The sandstones from the three geochemical zones also exhibit elevated strontium concentrations, with average values of 471.4, 568.6 and 467.8 mg/kg, respectively, all exceeding 300 mg/kg (Table 4). Their Sr/Br ratios range 0.3–1.7 (avg. 0.71), 0.6–1.8 (avg. 1.16) and 0.5–0.9 (avg. 0.72), as shown in Figure 8c. These geochemical signatures suggest two main implications: (1) the paleo-lacustrine water during deposition was predominantly fresh to brackish (Chen et al., Reference Chen, Yang, Jiang, Wang, Qiu and Habulashenmu2025), which is further corroborated by XRD data from low permeability mudstones that show a much higher proportion of alkaline versus acidic clay minerals (Table 2); (2) the mineralized sandstone may have been affected by Sr-bearing fluid (Araoka et al., Reference Araoka, Itano, Simandl, Paradis and Yoshimura2025), with strontium participating in uranium mineralization and thereby elevating both the strontium content and the Sr/Ba ratio.
5.b. Epigenetic transformation of ternary fluids
Red and grey sandstones could have formed during the sedimentary period or may represent alteration products resulting from external oxidation or reduction fluids following diagenesis (Kochkin and Bortnikov, Reference Kochkin and Bortnikov2020; Ji et al. Reference Ji, He, Zhong, Chen, Zhu, Wu and Dong2023; Huang et al. Reference Huang, Liu, Qin and He2023). Accurately distinguishing between the primary and secondary origins of differently coloured sandstones in red-variegated formations is crucial for guiding sandstone-type uranium deposit exploration (Xiang et al. Reference Xiang, Jiao, Wu, Rong and Zhang2022; Liu et al. Reference Liu, Zhang, Huang, Wu, Wang, Zhang, Tan, Ma and Zhao2024a). Currently, there remain differences in the genesis of red and green sandstones of the Huanhe Formation (Han et al. Reference Han, Li, Zhang, Luo and Wang2022; He et al. Reference He, Li, Liu, Zhang, Wang, Liu, Zhang, Qiu and Han2023). In this study, we identified three types of fluids that modified the hosting sandstone (Yan et al. Reference Yan, Zhang, Zhang, Xia, Nie and Wu2023), including shallow oxygenated groundwater, reducing hydrocarbon fluid, and deep alkaline hydrothermal fluid.
5.b.1. Epigenetic oxidation
Although primary red sandstones of syn-sedimentary origin occur in the Huanhe Formation (Wu et al. Reference Wu, Wu and Li2020), extensive epigenetic oxidation has also produced red sandstones (Huang et al. Reference Huang, Liu, Qin and He2023), which are widely distributed within 30–50 m above and below the uranium ore bodies in the study area (Wang et al. Reference Wang, Yan, Jiao, Wu, Zhang, Rong, Zhang, Li and Zhong2023). Macroscopic indicators of epigenetic oxidation include: colour variations in the red sandstone, presenting as brownish-red, purplish-red and light-red hues; and heterogeneous oxidation patterns visible in core samples, such as patchy, streaky and spotted textures (Figure 3a). Red-green and red-yellow interbedding are commonly observed in some variegated sandstones, attributed to incomplete post-depositional oxidation of the reduced sand bodies (Penney, Reference Penney2013; Kochkin and Bortnikov, Reference Kochkin and Bortnikov2020). Moreover, scattered black oxidized carbonate fragments occur locally within the red friable sandstone (Figure 3b), providing direct macroscopic evidence of late-stage oxidation (Rackley, Reference Rackley1972; Bohari et al. Reference Bohari, Harouna, Mosaad, Qian and Laouali2022). Microscopically, extensive red haematite mineralization is widely developed in the matrix, along detrital grain boundaries, and within carbonate minerals of the red sandstone (Figs. 3c–d). Additionally, partially oxidized pyrite framboids are frequently observed in certain areas (Figs. 3d–e), indicating significant infiltration and alteration by post-oxygenation fluids in the red sandstone (Deng et al. Reference Deng, Chi, Williams-Jones, Li, Wang, Xu and Wang2023; Hall et al. Reference Hall, Van Gosen and Zielinski2023).
5.b.2. Secondary reduction
Acid-hydrolysed light gas preserved in sedimentary rocks was trapped during the migration and oxidation of ancient hydrocarbon fluids (Qiu et al. Reference Qiu, Li, Zhang, Wang, Li, Han and Wang2024). In this study, high concentrations of hydrocarbon components were detected in some tight sandstones (Table 7). In contrast, carbonaceous debris in these sandstones is limited (Table 6) and is unlikely to have generated substantial hydrocarbons on its own (Du et al. Reference Du, Li, Bao, Xu, Wang, Huang, Wang, Wanyan and Wang2019). Therefore, the preserved gases must have originated from external hydrocarbon fluids (Liu et al. Reference Liu, Ma, He, Wen, Tang, Zheng, Ren and Luo2023). Field investigations reveal that lens-shaped (light-) grey sandstones are enveloped by red sandstone bodies, with their colour fading closely associated with fault intersections (Figure 9a). Thin green alteration films and black asphalt granules are occasionally observed along localized fault or fracture planes in red mudstone cores (Figure 9b–c). Under polarized light microscopy, pale-yellow light-oil fluorescence and hydrocarbon-bearing inclusions are developed within the sandstone (Figure 9d). These features clearly indicate the occurrence of at least one hydrocarbon migration event within the host sandstone (Zhu, Reference Zhu2016; Liu et al. Reference Liu, Ma, He, Wen, Tang, Zheng, Ren and Luo2023 b). Given the regional petroleum context, it is inferred that these gases most likely originated from the Dongsheng gas field in the adjacent Hangjinqi area (Luo et al. Reference Luo, Yang, Lu, Liu and Tang2021; Zhang, Reference Zhang2022).
Macro-microscopic alteration markers for the hydrocarbon and hydrothermal fluids within the Huanhe Formation in the Tel’aobao uranium deposit. (a) Field photos showing the relationship between colour fading and faults within red sandstone. (b) Green alteration film on the fault-plane of red mudstone. (c) Black asphalt within red sandy mudstone. (d) Pale-yellow light oil fluorescence in the dense sandstone, indicating hydrocarbon filling. (e) Boundary between carbonation and haematitization, and structure fragmentation of rock debris and minerals. (f) Fluid inclusions with medium to high temperatures and salinities and associated iron oxides occurring within calcite cement. (g) Fluid inclusions with medium temperatures and low salinities occurring within calcite cement. (h) BSE image showing the coexistence of hydrothermal sphalerite and iron oxides. (i) BSE image showing genetic sequence of the pyrite framboids and iron oxide. (j) BSE image for the gelatinous iron oxides and apatite in the pores of albite, with a little colloidal pyrite developing in surrounding area. Q: quartz; Cal: calcite; Hm: haematite; Mc: microcline feldspar; Lv: volcanic debris; Fe-O: iron oxide; An: anorthite; Py: pyrite; Kfs: Orthoclase; Ab: albite; Ap: apatite.

Multiple lines of compelling evidence indicate that the green sandstones were formed by secondary reduction involving hydrocarbon-rich fluids (Zhang et al. Reference Zhang, Liu, Zhang, Fayek, Lei and Quan2022; He et al. Reference He, Hu, Qiu, Wang, Chen, Jia, Li, Ji and Zhu2024), rather than through synsedimentary processes (Wu et al. Reference Wu, Yu, Zhou and Zhu2005; Han et al. Reference Han, Li, Qiu, Zhang and Wang2025). Specifically, Fe3+ in the sandstone was widely reduced to Fe2+, leading to a colour transformation from primary red to secondary green (Yi et al. Reference Yi, Wang, Li, Zhang and Wang2018; Zhao et al. Reference Zhao, Cai, Jin, Li, Li, Wei, Guo and Zhang2018). Microscopic images commonly show unevenly distributed relic red haematite within the green sandstone (Figure 3g). Additionally, detrital grain boundaries are often surrounded by green clay minerals (Figure 3g–j), which substantially contribute to the overall green colouration of the sandstone (Cai et al. Reference Cai, Han, Zhang, Yi, Li, Zhang, Wang and Li2021; Feng et al. Reference Feng, Zhang, Nie, Xia, Ning and Zhang2024). The clay minerals are mainly composed of honeycomb-like and flocculent S/C mixed-layer clays, along with fine-grained or fibrous chlorite (Figure 3h–i). However, due to incomplete transformation between clay types in open systems (Chen et al. Reference Chen, Yang, Jiang, Wang, Qiu and Habulashenmu2025), the S/C mixed-layer clays maintain a high average relative content of 70.3% (Table 2). Microscopic examination shows the coexistence of pyrite, black amorphous organic matter, and chlorite in the green sandstone (Figure 3j). The strongly negative sulphur isotope composition (−38.7‰ to −7‰; Table 7) suggests that pyrite formation was closely linked to organic matter and resulted from bacterial sulphate reduction (BSR) under low-temperature conditions (Kaplan and Rittenberg, Reference Kaplan and Rittenberg1964; Lovley et al. Reference Lovley, Roden, Phillips and Woodward1993) (Figure 10a). These features suggest that the migrating hydrocarbon fluids were predominantly alkaline and reducing and contained minor amounts of H2S (Huang et al. Reference Huang, Qin, Liu, Xiao and Liu2024).
δ34S-δ13C-δ18O values indicating the origin of various fluids in the Huanhe Formation of the Tel’aobao uranium deposit. (a) Genesis map indicating pyrite through bacteria reduction, base diagram from Kaplan and Rittenberg, Reference Kaplan and Rittenberg1964. (b–c) Identification diagram for the calaite within the dense sandstone. Base diagram b and c from Liu et al. (Reference Liu, He, Li, Liu and Li2004) and Wang and Song (Reference Wang and Song1992), respectively.

Figure 10. Long description
Panel A: A horizontal bar graph shows the genesis map indicating pyrite through bacteria reduction. The x-axis represents delta 34 sulfur values in percent, ranging from -30 to 30. The y-axis lists different origins such as bacterial origin, thermochemical genesis, organic genesis, modern seawater genesis, ancient ocean and evaporation genesis, volcanic origin, and atmospheric origin. Each origin is represented by a horizontal bar, with bacterial origin having the widest range and atmospheric origin the narrowest. Panel B: A scatter plot identifies the calcite within the dense sandstone. The x-axis represents delta 18 oxygen values in percent, ranging from 0 to 30. The y-axis represents delta 13 carbon values in percent, ranging from -35 to 10. The plot includes various data points representing different processes such as crystal fractionation, decarbonization, dissolution, decarboxylation, and organic matter oxidation. Specific regions are labeled, such as mantle-derived, ultrabasic-basic magma, granite, marine carbonate rock, and sedimentary organic matter. Panel C: Another scatter plot identifies the calcite within the dense sandstone. The x-axis represents delta 13 carbon values in percent, ranging from -25 to 15. The y-axis represents delta 18 oxygen values in percent, ranging from -25 to 10. The plot includes data points representing diagenetic carbonate, biogenic carbonate, and carbonates related to organic matter. The data points are grouped into distinct clusters, indicating different types of carbonates.
5.b.3. Thermal transformation
In certain sandstone samples, both calcitization and haematitization are observed microscopically. Additionally, highly fragmented fracture networks are evident in brittle minerals such as quartz and feldspar (Figure 9e), attributed to late-stage tectonic compression (Qin et al. Reference Qin, Huang, Liu, Liu, Gu, Jia and Jiang2022; Yan et al. Reference Yan, Zhang, Zhang, Xia, Nie and Wu2023). These calcite minerals contain abundant fluid inclusions of diverse morphologies, predominantly liquid phase with minor gas–liquid phases (Figure 9f–g). Homogenization temperature and salinity measurements reveal two distinct populations: some inclusions exhibit high values (e.g., 167°C, 16.34 wt% NaCl) and are associated with surrounding black spherical iron oxides (Figure 9f), whereas others show lower values (e.g., 124°C, 2.24 wt% NaCl) (Figure 9g). Overall, the inclusions show limited variation in temperature but exhibit wide salinity differences (Spangenberg et al. Reference Spangenberg, Fontbote and Macko1999). No clear correlation exists between temperature and salinity, suggesting the mixing of fluids with distinct properties within the sandstone (Heinrich, Reference Heinrich2007; Harlaux et al. Reference Harlaux, Kouzmanov, Gialli, Marger, Bouvier, Baumgartner, Rielli, Dini, Chauvet, Kalinaj and Fontboté2021). Therefore, the host sandstone was likely altered by a hydrothermal fluid (Heinrich, Reference Heinrich2007; Qin et al. Reference Qin, Huang, Liu, Liu, Gu, Jia and Jiang2022), formed through mixing of a deep sourced, relative middle temperature (>250°C), high salinity (>20 wt% NaCl) brine with shallow, low temperature (<60°C), low salinity (<3 wt% NaCl) groundwater (Spangenberg et al. Reference Spangenberg, Fontbote and Macko1999; Mercadier et al. Reference Mercadier, Cuney, Lach, Boiron, Bonhoure, Richard, Leisen and Kister2011).
Microscopic observations of brownish-grey ores show that abundant iron oxide fragments are accompanied by minor sphalerite and calcite (Figure 9h). Notably, the sphalerite remains unoxidized. A small amount of chlorite occurs along feldspar grain edges, whereas clusters of flocculent iron oxides encircle early colloidal and framboidal pyrite (Figure 9i). The contact between the two phases is either sharply abrupt or completely separated in space, indicating that the gelatinous iron oxides are not the product of low temperature surface oxidation of pyrite (Keyser et al. Reference Keyser, Ciobanu, Cook, Feltus, Johnson, Slattery, Wade and Ehrig2019), but more likely represent a high temperature thermochemical precipitate (Makvandi et al. Reference Makvandi, Huang, Beaudoin, Quirt, Ledru and Fayek2021; Deng et al. Reference Deng, Chi, Williams-Jones, Li, Wang, Xu and Wang2023). In addition, abundant fine-grained dispersed iron oxides and minor gelatinous apatite occur within dissolution pores of some detrital grains (e.g., feldspar), while small amounts of pyrite are developed in the surrounding intergranular pores (Figure 9j). Whole-rock carbon-oxygen (C–O) isotope data also suggest that the mixed carbon sources are primarily inorganic in origin (δ 1 3CV-PDB < −7.6‰; Table 7), likely derived from the dissolution of marine carbonate debris within the sandstone (Liu et al. Reference Liu, He, Li, Liu and Li2004) (Figure 10b). Nevertheless, all carbon sources show an association with organic matter (Figure 10c), which may reflect influence from organic-rich hydrocarbon fluids (Wang and Song, Reference Wang and Song1992; Shikazono et al. Reference Shikazono and Utada1997). And this hydrothermal event postdates hydrocarbon fluid activity.
5.c. Genesis of uranium ore
5.c.1. Low-temperature bacterial reduction
On the geological profile, the uranium ores within the Huanhe Formation are situated between the reddish epigenetic oxidation zone and the greenish secondary reduction zone (Figure 2b), suggesting that redox interfaces represent the principal mechanism governing uranium precipitation (Milodowski et al. Reference Milodowski, West, Pearce, Hyslop, Basham and Hooker1990; Cuney et al. Reference Cuney, Mercadier and Bonnetti2022). The oxidizing fluids are primarily shallow, low-temperature, uranium- and oxygen-bearing groundwater (Hall et al. Reference Hall, Mihalasky, Tureck, Hammarstrom and Hannon2017; Kochkin and Bortnikov, Reference Kochkin and Bortnikov2020), whereas the reducing agents consist predominantly of pyrite and chlorite generated by external hydrocarbon fluids (Bailey et al. Reference Bailey, Kirk, Hemming, Krantz and Reiners2021; He et al. Reference He, Hu, Qiu, Wang, Chen, Jia, Li, Ji and Zhu2024).
Mineralogical and EPMA data indicate that coffinite in the ore exhibits a close spatial association with pyrite of BSR origin (Figure 10a), secondary chlorite, and altered ilmenite fragments. Some coffinites appear to have partially replaced pre-ore framboidal pyrite-1 (Figure 11a), retaining its characteristic spheroidal texture, whereas other coffinite precipitated concurrently with the framboidal and colloidal ore-stage pyrite-2 (Figure 11b–c). This association implies that microbial activity likely played a crucial role in uranium precipitation (Lovley et al. Reference Lovley, Roden, Phillips and Woodward1993; Alessi et al. Reference Alessi, Lezama-Pacheco, Stubbs, Janousch, Bargar, Persson and Bernier-Latmani2014). Furthermore, the textural and compositional evidence – including the presence of massive, phosphorus-rich coffinite and the identification of P-enriched coffinite exhibiting bacterial cell morphologies (Figure 11d) – indicates that epigenetic redox processes were the primary controls on ore formation under the low-temperature environment (Milodowski et al. Reference Milodowski, West, Pearce, Hyslop, Basham and Hooker1990; Nakashima et al. Reference Nakashima, Disnar, Perruchot and Trichet1984). Due to differences in U and P content, the BSE images of these coffinites typically exhibit uneven, spot-like and harbour-like brightness patterns (Figure 11d). In darker-toned regions, P is higher and U is lower, whereas the opposite trend is observed in brighter regions.
Photomicrographs showing the two types of uranium mineralization within sandstone ores. (a) Microphotoes indicating framboidal pre-ore pyrite was replaced by coffinite. (b–c) BSE images showing co-precipitation of coffinite and framboidal and colloidal ore-stage pyrites. (d) Phosphorus-containing coffinite with coccoid morphology, exhibiting cell lumen microorganisms. (e, f) BSE images showing symbiotic relationship between (Zr-) coffinite and iron oxide. (g) BSE image showing both yttrium-coffinite and rutile was prior to iron oxide. (h) SEM–EDS spectrum for the coexistence of Zr-coffnite and hydrothermal sphalerite. (i) Anhedral monazite with epigenetic hydrothermal origin produced in the pores. Py: pyrite; Cof: coffinite; Ru: rutile; Sm: smectite; Chl: chlorite; Pl: plagioclase; Spn: sphalerite; Mon: monazite.

5.c.2. Thermochemical precipitation
The most distinctive feature of the Tel’aobao deposit is the strong correlation between colour and mineralization quality (Figure 4a–c). The brownish-grey primary ore exhibits a warm hue, high grade and considerable thickness (Zhang et al. Reference Zhang, He, Li, Liu, Li, Wang, Liu, Li, Zhang and Luo2024). In contrast, the green ore is typically low-grade and thin-bedded (Wang et al. Reference Wang, Yan, Jiao, Wu, Zhang, Rong, Zhang, Li and Zhong2023). This pattern differs markedly from conventional sandstone-hosted uranium deposits, where darker hues generally correspond to higher grades, and the dominant colour is (dark-)grey (Penney, Reference Penney2013). Evidence from petrography and elemental geochemistry indicates that a thermal fluid event contributed to the formation of the brownish-grey sandstone ore (Pointer et al. Reference Pointer, Ashworth and Simpson1989; Makvandi et al. Reference Makvandi, Huang, Beaudoin, Quirt, Ledru and Fayek2021). Iron oxides are commonly observed within these ores (Figure 4e, g). This association is evident in several contexts: (1) gelatinous iron oxides and uranium phases are co-precipitated within dissolution pores (Figures 11e–f); (2) both ore-stage rutile and Y-coffinite are completely enveloped by iron oxides (Figure 11g); and (3) zirconium-bearing uraninite is found in close association with amorphous sphalerite in certain domains (Figure11h–i, Table 1). Given that uranium is more susceptible to oxidation than iron, these iron oxides are unlikely products of surface oxidation (Rackley, Reference Rackley1972). Instead, they probably formed at elevated temperatures and alkaline environment (Sidhu et al. Reference Sidhu, Gilkes and Posner1980), analogous to the red haematite alteration commonly observed in hydrothermal uranium deposits (Deng et al. Reference Deng, Chi, Williams-Jones, Li, Wang, Xu and Wang2023).
Based on the evidence presented, this study proposes that a hydrothermal fluid with relative middle temperature, high-salinity, weakly reducing and alkaline, migrated into the ore-bearing sandstone (Klus et al. Reference Klus, Pořízka, Prochazka, Mikysek, Novotný, Novotný, Slobodník and Kaiser2017; Hu et al. Reference Hu, Ling, Xu, Wei, Yang, Lu, Wang, Zhang, Jiang and Zhao2025). The migration direction may extend from the deeper reduction zone to the shallower oxidation zone, as the green sandstone is slightly more enriched in REEs and LREEs than the red sandstone (Table 4). Thus, the coupling between hydrothermal fluids and a low-temperature, low-salinity and oxidizing pore-fluid infiltrating from shallower levels will take place in the redox transition zone (Heinrich, Reference Heinrich2007;Kochkin and Bortnikov, Reference Kochkin and Bortnikov2020). This interaction triggers significant thermal alteration of the pre-existing uranium ores and contributes to the formation of fluid inclusions with varying properties within the transition zone (Harlaux et al. Reference Harlaux, Kouzmanov, Gialli, Marger, Bouvier, Baumgartner, Rielli, Dini, Chauvet, Kalinaj and Fontboté2021; Qin et al. Reference Qin, Huang, Liu, Liu, Gu, Jia and Jiang2022). Environmental shifts will give rise to two principal consequences (Araoka et al. Reference Araoka, Itano, Simandl, Paradis and Yoshimura2025). First, elements transported by the hydrothermal fluid were unloaded (Rene, Reference Rene2008) and significantly result in alterations of certain trace and REE sconcentrations in ores (Table 4). For example, compared with non-mineralized sandstone, mineralized sandstone exhibits significantly higher REE concentrations, particularly in HREE (Figure 6); minor amounts of cryptocrystalline monazite were seen in local pore spaces (Figure 11j). Second, the mixed fluid – characterized by moderate temperature, weakly oxygen fugacity and alkaline conditions – promoted the dissolution of detrital grains within the sandstone ore (Sidhu et al. Reference Sidhu, Gilkes and Posner1980; Feng et al. Reference Feng, Zhang, Nie, Xia, Ning and Zhang2024), releasing elements such as Zr, Y, Co, Si, Fe, Zn and Cu. Consequently, the hydrothermal assemblage comprising Zr-cof or Y-cof, haematite, sphalerite and calcite occurred in the brownish-grey ore (Goldhaber et al. Reference Goldhaber, Hemingway, Mohagheghi, Reynolds and Northrop1987; Klus et al. Reference Klus, Pořízka, Prochazka, Mikysek, Novotný, Novotný, Slobodník and Kaiser2017). It should be noted that the abundant iron oxides and (Zr-, Y-) coffinites may adversely affect the efficiency of in-situ leaching (Table 1), rendering a portion of the uranium refractory to extraction (Zammit et al. Reference Zammit, Brugger, Southam and Reith2014).
5.d. Sandstone uranium metallogenic model
Based on an integrated research of petro-mineralogy, elemental-isotopic geochemistry and geological chronology, a prolonged multi-stage coupled model was developed for the Tel’aobo uranium deposit (Figure 12).
Proposed genetic model for the Lower Cretaceous Luohe-Huanhe Formations in the Tel’aobao uranium deposit, northwestern Ordos basin.

Figure 12. Long description
A diagram illustrating the genetic model for the Lower Cretaceous Luohe-Huanhe Formations in the Tel’aobao uranium deposit, showcasing geological age, tectonic evolution, hydrocarbon history, hydrothermal processes, and uranium mineralization stages. Panel A: A timeline chart showing geological age in millions of years (Ma) on the x-axis and various geological processes on the y-axis. The processes include tectonic evolution, hydrocarbon history, hydrothermal processes, and uranium mineralization stages. The timeline spans from 150 Ma to the present, with different formations and stages marked along the timeline. Panel B: A cross-sectional diagram of the Tianhuan depression and Yimeng uplift regions, showing the distribution of different geological formations and mineral alteration assemblages. The diagram includes labels for various formations such as K1 lh, K1 j, and J-T, and indicates the presence of minerals like hematite, dolomite, pitchblende, and framboidal pyrite. Panel C: A cross-sectional diagram illustrating structure compression and inversion in the Yimeng uplift region. It shows the distribution of gas and oil, along with mineral alteration assemblages like framboidal and colloidal pyrite, calcite, chlorite, and asphalt. Panel D: A cross-sectional diagram depicting tectonic uplift and erosion, showing the distribution of different geological formations and mineral alteration assemblages. The diagram includes labels for formations like K1 j and indicates the presence of minerals like hematite, framboidal and colloidal pyrite, and barite. Panel E: A cross-sectional diagram illustrating structural extension, showing the distribution of different geological formations and mineral alteration assemblages. The diagram includes labels for formations like E3-Q and indicates the presence of minerals like apatite, illite, sphalerite, galena, and Y-coffinite.
5.d.1. Sedimentation and phreatic redox mineralization stages (c. 145–c. 115 Ma)
During the Early Cretaceous, the inland regions of northern China experienced a predominantly hot and arid climate (Qi et al. Reference Qi, Liu, Zhang and Li2009), which led to the widespread development of primary oxidative red beds (Figure 12a–b). In the Hangjinqi area, the Huanhe Formation, with limited reduction capacity (Table 5), is characterized by fluvial and fluvial-deltaic sedimentary facies (Wu et al. Reference Wu, Yu, Zhou and Zhu2005). In such a climatic setting, insufficient rainfall leads to the absence of floodplain mudstone (Liu et al. Reference Liu, He, Yan, Wu and Zhang2022), thereby facilitating the development of interconnected channel sand bodies. Additionally, intense evaporation can further increase the solubility of uranium in groundwater, leading to elevated uranium background levels (>5 ppm) in the sediments (Jiang et al. Reference Jiang, Qin, Fan, Jia, Guo, Huang, Ning and Xiao2023). And alkaline water promotes the formation of montmorillonite and dolomite in the sandstone (Figure 12b). In the Tel’aobao deposit, a limited number of grey beds containing carbonaceous fragments are observed (Figure 3b), promoting the production of framboidal pyrites during the sedimentation period (Figure 11a). Consequently, paleo-phreatic redox conditions likely developed at the contact between the primary red and grey sandstones within the Huanhe Formation (Wang et al. Reference Wang, Yan, Jiao, Wu, Zhang, Rong, Zhang, Li and Zhong2023). This redox mineralization process corresponds to the mineralization age of 134.43 Ma determined by EMPA in the present study (Table 8; Figure 7f). And it is inferred to have persisted until the deposition of fine-grained sediments in the Lower Cretaceous Jingchuan Formation.
5.d.2. Secondary reduction stage of hydrocarbon fluids (c. 115–c. 105Ma)
At the end of the Early Cretaceous, significant structural reversal occurred in the northern Ordos Basin (Zhu, Reference Zhu2016). Data from previous studies – including structural chronology, seismic profiles, stratigraphic contacts and oil–gas inclusions – suggest that the hydrocarbon dispersal event in this region primarily took place during c. 110–100 Ma (Luo et al. Reference Luo, Yang, Lu, Liu and Tang2021; Liu et al. Reference Liu, Zhang, Huang, Wu, Wang, Zhang, Tan, Ma and Zhao2024a). Hydrocarbon fluids from the Dongsheng gas field migrated upwards along the San’yanjing and Bo’erjianghaizi penetrating faults (Zhang, Reference Zhang2022; Liu et al. Reference Liu, Ma, He, Wen, Tang, Zheng, Ren and Luo2023), and subsequently migrated laterally through the dominant channels within the shallow sandstone of the Huanhe Formation (Figure 12a, Table 6). This led to extensive reduction of the primarily oxidized sandstone (Han et al. Reference Han, Li, Zhang, Luo and Wang2022; Qiu et al. Reference Qiu, Li, Zhang, Wang, Li, Han and Wang2024), resulting in a colour change from red to green (Figure 12c). Field investigations have revealed a gradual colour transition from red to grey-white along normal faults and fractures cutting through the Huanhe Formation sandstone (Figure 9a), with incompletely reduced reddish-brown dense lenses present in the adjacent areas. Inherent reducing agents within the host sandstone are scarce; for example, the average TSC and TOC in the reduced green non-mineralized sandstone are only 0.007% and 0.072%, respectively (Table 5). Consequently, secondary reducing agents – such as pyrite, amorphous bitumen, chlorite and abundant light hydrocarbons – formed a favourable secondary reduction geochemical barrier (Figure 3j), facilitating subsequent uranium precipitation through redox processes (Milodowski et al. Reference Milodowski, West, Pearce, Hyslop, Basham and Hooker1990; Liu et al. Reference Liu, Qin, Huang, Liu and Zhang2024b; Lin et al. Reference Lin, Fan, Ni, Pan, Jin, Cheng, Cui, Cheng, Li, Zhu, Zhu and Li2025).
During this period, fluid mixing between coeval shallow oxygenated water and hydrocarbon-bearing fluids could also generate limited uranium mineralization (Nakashima et al. Reference Nakashima, Disnar, Perruchot and Trichet1984;Kochkin and Bortnikov, Reference Kochkin and Bortnikov2020), which is typically localized in the transitional zones between the red oxidized and green reduced intervals (Figure 12c). This mineralization phase aligns with previously reported whole-rock U-Pb ages from the Lower Cretaceous, which range from 117.8±6.2 to 106.98 ± 9.49 Ma (Figure 7b–d). It is also consistent with the mineralization ages of 126 to 101.99 Ma obtained from the Middle Jurassic Zhiluo Formation in the area (Table 9).
5.d.3. Primary redox mineralization stage (c. 105–c. 53 Ma)
From the Late Cretaceous to the Eocene, the northern Ordos Basin entered a phase of regional tectonic compression and stratigraphic uplift (Ren et al. Reference Ren, Tamaki, Li and Junxia2002). During this period, shallow uranium-bearing oxygenated water extensively infiltrated the Lower Cretaceous sand bodies along outcrops at the basin margin (Yi et al. Reference Yi, Wang, Li, Zhang and Wang2018), triggering widespread regional interlayer oxidation (Penney, Reference Penney2013) (Figure 12d). In the resulting redox transition zone, significant low-temperature, microbially influenced uranium mineralization is inferred to have occurred, ultimately forming green sandstone ores. The mineral alteration assemblage includes (P-) coffinite, U-Ti minerals, framboidal and colloidal pyrite and barite (Figure 4, 11a–d). This prolonged mineralization event in the Huanhe Formation corresponds temporally to the main mineralization stage of the underlying Jurassic Zhiluo Formation during the Late Cretaceous (Guo et al. Reference Guo, Jiao, Miao, Wang, Wang and Cheng2015; Wen et al. Reference Wen, Zhu and Cheng2023). Notably, two episodic mineralization ages – 87.05 and 67.01 Ma – were identified through EMPA dating (Figure 7f, Table 8). The mineralization age of the underlying Jurassic deposits, as determined by previous studies using various methods (Liu et al. Reference Liu, Xia and Tian2007), is similarly concentrated between 96 ± 14 and 60.24 ± 0.8 Ma (Table 9). Collectively, they constitute a unified metallogenic system in the northern Ordos Basin (Akhtar et al. Reference Akhtar, Yang and Pirajno2017; Huang et al. Reference Huang, Liu, Qin and He2023).
Metallogenic ages and ore-bearing strata of sandstone-hosted uranium deposit in northern Ordos Basin (from Wen et al. Reference Wen, Zhu and Cheng2023)

Table 9. Long description
A table comparing metallogenic ages and ore-bearing strata of sandstone-hosted uranium deposits in the northern Ordos Basin. The table has 15 rows and 11 columns. The columns are labeled as follows: Deposit and ore-bearing layer, J3, J2, K1, K2, E1, E2, E3, N1, N2-Q, Method, and Data source. The rows list different deposits and their corresponding metallogenic ages in million years (Ma) and the methods used for dating. Each row provides specific ages and methods for different geological periods. Notable trends include varying ages and methods across different deposits, indicating diverse geological processes and dating techniques. The table provides a comprehensive overview of the temporal and stratigraphic context of uranium deposits in the region.
5.d.4. Hydrothermal reformation and deficient oxidation stage (since c. 53 Ma)
At the end of the Eocene, retreat of the ancient Pacific Plate led to regional extensional tectonics in Northeast China (Chen et al. Reference Chen, Sun, Nie, Li, Zhen and Zhou2020; Guo et al. Reference Guo, Liu, Teng, Tian, Teng, Wang, He and Zhang2023). Subsequently, during the Oligocene, the Hetao fault-depression in the northern Ordos Basin underwent gradual subsidence (Figure 12a, e). At this stage, pre-existing faults in the area were likely reactivated, enabling the ascent of deep hydrothermal fluids (Yan et al. Reference Yan, Zhang, Zhang, Xia, Nie and Wu2023; Hu et al. Reference Hu, Ling, Xu, Wei, Yang, Lu, Wang, Zhang, Jiang and Zhao2025). While the precise timing of this fluid activity remain uncertain, mineralogical evidence indicates the presence of a mixed-fluid system – characterized by distinct temperatures and salinities – within the redox zone of the Huanhe Formation (Keyser et al. Reference Keyser, Ciobanu, Cook, Feltus, Johnson, Slattery, Wade and Ehrig2019; Harlaux et al. Reference Harlaux, Kouzmanov, Gialli, Marger, Bouvier, Baumgartner, Rielli, Dini, Chauvet, Kalinaj and Fontboté2021). This hydrothermal process overprinted earlier green ores (Figure 11e–i) and gave rise to the present-day high-grade brownish-grey ores due to the absence of thermogenic iron oxide (Rene, Reference Rene2008; Makvandi et al. Reference Makvandi, Huang, Beaudoin, Quirt, Ledru and Fayek2021). Both whole-rock U-Pb and EMPA dating yielded mineralization ages of 53.8 ± 6.3 and 52.24 Ma, respectively, which are comparable to the ages of 54.6 ± 1.8 and 48.62 Ma obtained from the Zhiluo Formation (Table 9).
As the fine-grained lacustrine sediments of the Upper Jingchuan Formation are progressively eroded, limited rainfall continues to infiltrate the target layer (Krempl et al. Reference Krempl, Novotný, Wertich, Škoda, Kanický and Leichmann2023). This results in insufficient phreatic oxidation and alteration of the ancient ore bodies (Figure 12e). New mineralization took place during the Cenozoic, which corresponds to the younger ages (<34.18 Ma) obtained from EMPA dating (Figure 7f, Table 9).
6. Concluding remarks
The Tel’aobao uranium deposit, hosted in the oxidized Huanhe Formation, northwestern Ordos Basin, challenges the conventional model of uranium exploration in native grey reducing strata. Ancient depositional and climatic conditions have imparted distinct characteristics to the ore-bearing layer: a lack of native reducing agents, abundant mixed layered chlorite/smectite (C/S) and illite/smectite (I/S), and elevated uranium content even in non-mineralized sandstone. The host sandstones have been modified by three distinct fluids at different periods: oxidized water, hydrocarbon fluid and hydrothermal fluid. Correspondingly, the fluid–rock interactions resulted in epigenetic alterations such as pyritization, sphaleritization, calcitization, chloritization, haematitization, the presence of high acid hydrocarbons, light-yellow fluorescence, etc. Two distinct uranium mineralization mechanisms – low-temperature redox and thermochemical precipitation – operated within the transition zone. These processes explain the coexistence of brownish-grey and green ores, as well as the widespread occurrence of coffinite (enriched in both P, Zr and Y) and U-Ti aggregates associated with pyrite, sphalerite, chlorite and iron-oxide. Accordingly, a whole-rock U-Pb isochron age of 53.8 ± 6.3 Ma was obtained, and EMPA dating constrains the mineralization time from 134.43 to 4.45 Ma. Based on above-mentioned constraints, a four-stage metallogenic model is proposed: sandstone reservoir and ore-embryos formation (c. 145–115 Ma), hydrocarbon-driven secondary reduction (c. 115–105 Ma), regional interlayer redox mineralization (c. 105–53 Ma) and thermal transformation with minor supergene oxidation (c. 53 Ma–present). This paper elucidates the genesis of the Tel’aobao deposit in the Ordos Basin and serves as a framework for uranium exploration in the red-variegated strata of global sedimentary basins.
Author contributions
Shaohua Huang: Writing–original draft, Investigation, Methodology, Formal analysis, Data curation, Conceptualization. Longhui Wang: Writing–review & editing, Investigation, Formal analysis, Data curation, Conceptualization. Mingkuan Qin: Writing–original draft, Methodology, Investigation, Data curation, Validation, Supervision, Conceptualization. Zhangyue Liu: Writing–review & editing, Methodology, Formal analysis, Data curation, Validation, Supervision, Conceptualization. Zhongbo He: Writing–review & editing, Investigation, Formal analysis, Data curation. Xiaojun Yang: Editing, Formal analysis, Data curation, Conceptualization. Nian Liu: Writing–review & editing, Investigation, Data curation, Formal analysis, Conceptualization. Fujun Zhong: Writing–review & editing, Formal analysis, Methodology, Conceptualization. Yingying Geng: Writing–review & editing, Supervision, Investigation, Formal analysis, Conceptualization, Funding acquisition, Validation, Supervision, Project administration.
Financial support
This study is supported by National Natural Science Foundation of China (grant No. U2441201), the Key Basic Research Program (grant No. NKLUR-2024-ZD-003, YFPT2402) from National Key Laboratory of Uranium Resource Exploration-Mining and Nuclear Remote Sensing, Beijing, China, and the Fourth of Talent Project (grant No. QNYC 2102) from China National Nuclear Corporation (CNNC).
Competing interests
The authors declare that they have no known competing financial interests or personal relationships that could have appeared to influence the work reported in this paper, and the article is approved by all authors for publication.


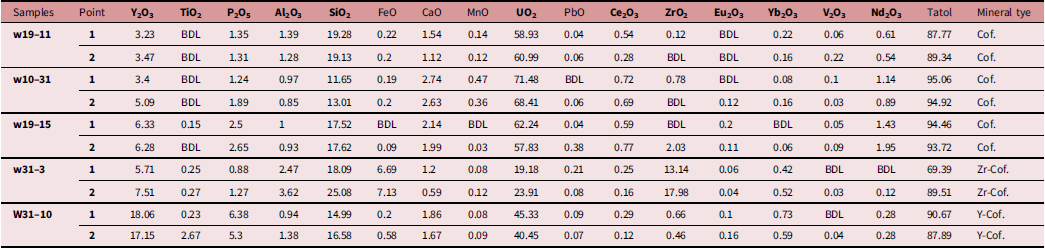
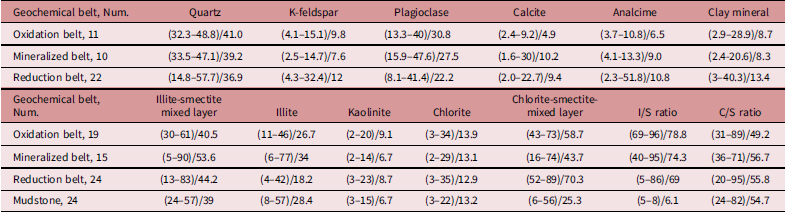
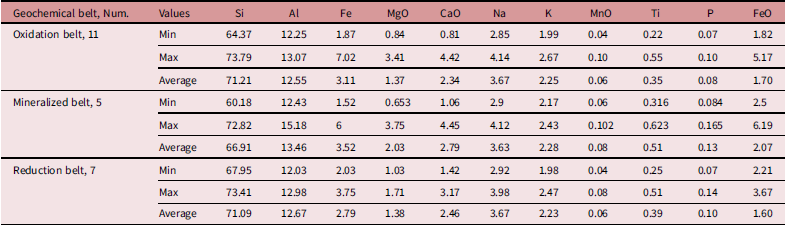
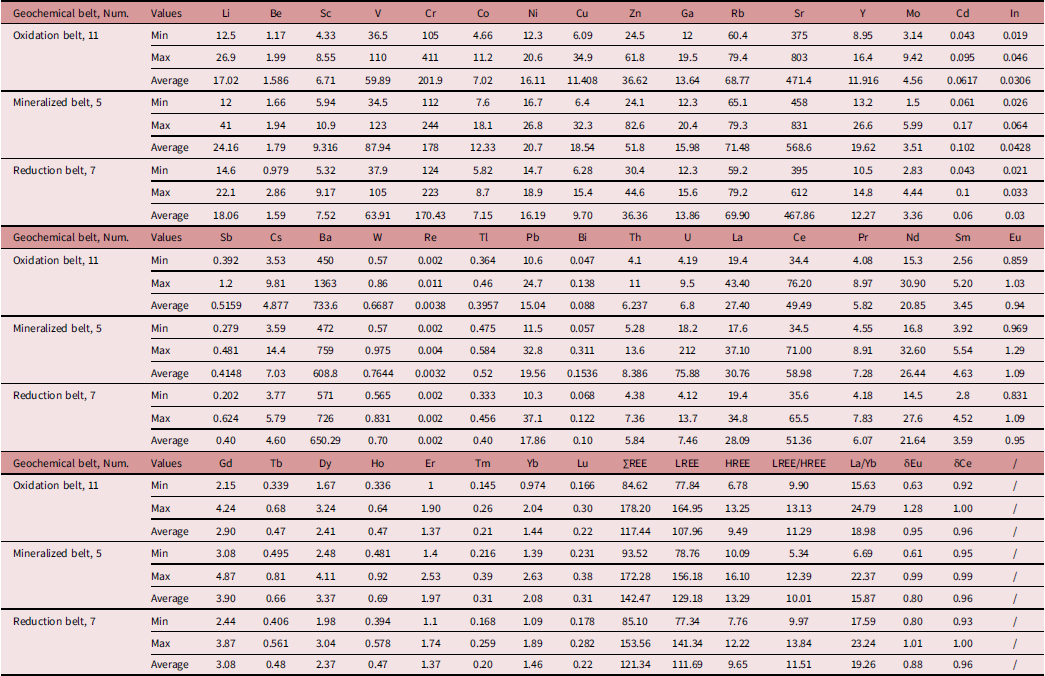
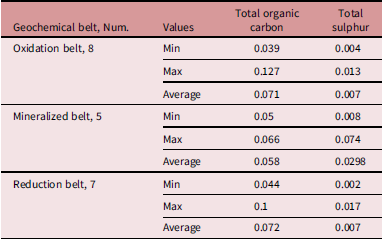
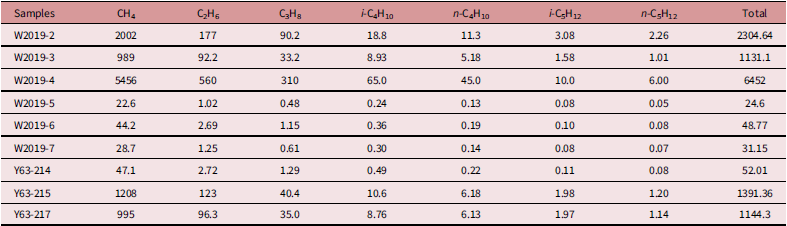
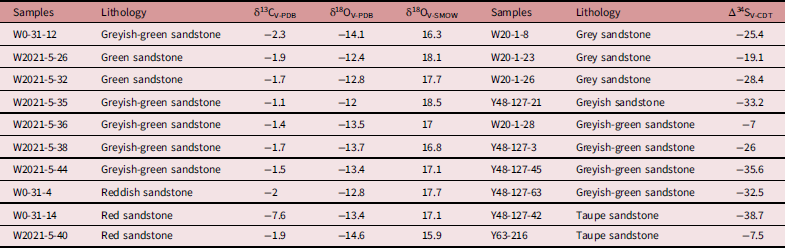
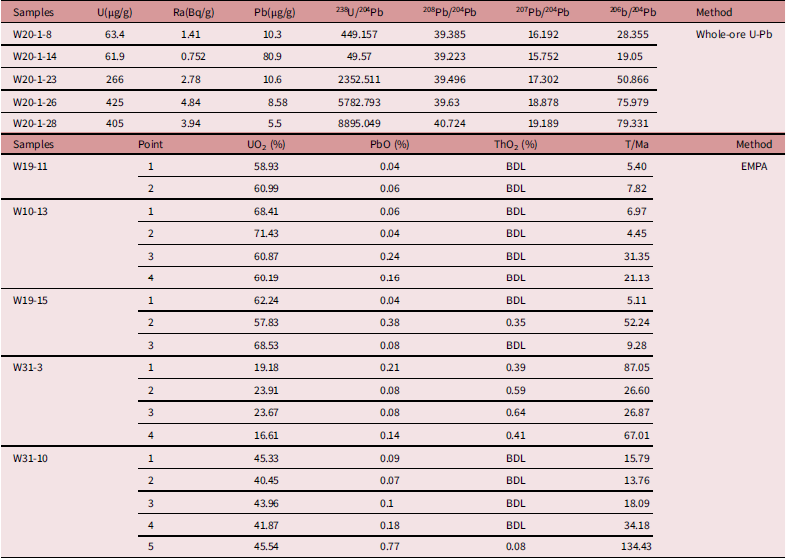


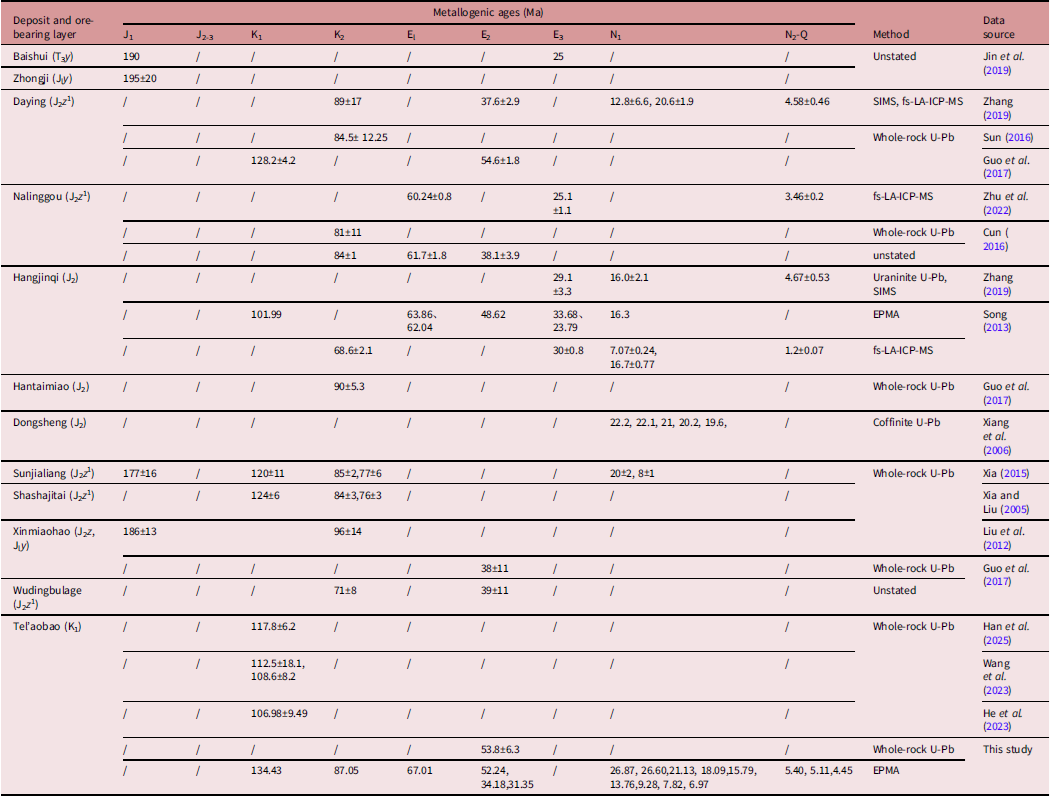

 Open access

